Every year, generic pharmaceutical companies write off hundreds of millions of dollars on programs that were commercially viable on paper but legally uninvestigable in practice. The composition-of-matter patent had nominally expired. The market was large. The formulation science was straightforward. Nobody had done the actual patent work.
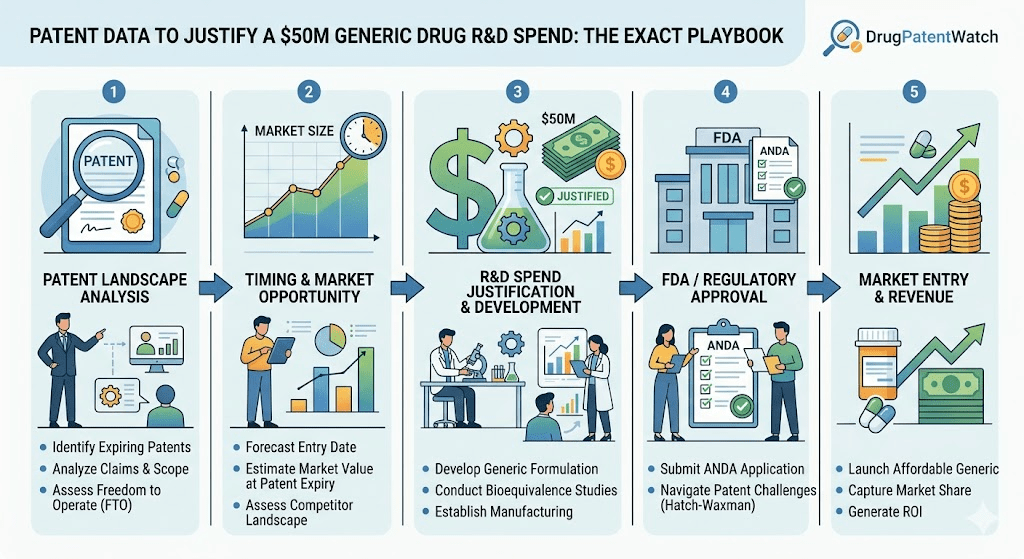
This article is for the person who needs to make that work rigorous enough to move $50 million off the sidelines. It covers the full architecture of a patent-intelligence-driven investment case: how to read the Orange Book as a financial document, how to model Paragraph IV litigation risk with actual probability weights, how to quantify the 180-day exclusivity opportunity on a specific drug, and how to stress-test your assumptions against the scenarios that kill generic programs most often.
The methodology works for a standard oral solid with a clean patent landscape. It works differently, but it still works, for a complex generic with a thicket of secondary patents. And it works for a 505(b)(2) program where some of the exclusivity is the point. The core logic is the same throughout: patent data is financial data, and treating it as anything else means you are flying without instruments.
“A first-to-file position on a $1 billion drug with a 60% probability of litigation success, a 40% probability of an authorized generic, and a 180-day exclusivity revenue capture of $150 million has a probability-weighted NPV of approximately $50 million to $70 million before development and litigation costs.” — DrugPatentWatch Strategic Analysis, 2026
What Patent Data Actually Tells You About a Generic Drug Opportunity
Patent data is not a legal checklist. It is a map of when and how a branded drug’s revenue wall will come down, who else is trying to take it down at the same time, and what the rubble is likely to be worth once the wall falls.
Before any $50 million decision gets made, you need to understand four distinct layers of what the Orange Book and USPTO records are actually encoding.
The Four Layers of Patent Intelligence That Drive Generic Investment Decisions
The first layer is the composition-of-matter (CoM) patent. This is the base layer, the one that covers the active pharmaceutical ingredient itself. When it expires, the molecule is unambiguously available to copy. For most small-molecule drugs, this is the patent that matters most and the one every competitor’s planning team has circled in red for years in advance.
The second layer is secondary patents: formulation patents on specific tablet architectures, polymorph patents on crystal forms of the API, method-of-use patents on specific therapeutic indications, process patents on manufacturing routes, and combination-product patents. These patents do not protect the molecule. They protect specific commercial expressions of it. Secondary patents are where the strategic complexity actually lives, because a brand company can file hundreds of them after the CoM expires, each potentially triggering a separate Paragraph IV proceeding and a separate 30-month stay.
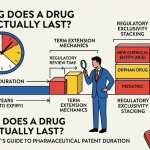
The third layer is FDA exclusivity, which runs on a completely separate clock from patent protection. New Chemical Entity (NCE) exclusivity gives a brand five years of protection against ANDA filings. Orphan drug exclusivity runs seven years. Pediatric exclusivity adds six months to the end of any patent or exclusivity period. These exclusivities can block an ANDA even when every listed patent has expired. A generic team that models only patent expiry and ignores the FDA exclusivity calendar will produce a commercialization date that is legally wrong.
The fourth layer is the competitive landscape within the patent data itself: the ANDA filings that have already been made, the Paragraph IV certifications already on file, the litigation already in progress. This layer tells you whether you are entering a race that is already over, a race you can win from first position, or one where a half-dozen well-capitalized competitors are already in the starting blocks.
How to Read the Orange Book as a Financial Document
The Orange Book — officially the FDA’s Approved Drug Products with Therapeutic Equivalence Evaluations — lists every NDA-approved drug, the patents associated with it, and the expiry dates of those patents. Generic teams access it as a database. The mistake is treating the listed expiry dates as the answer rather than the starting question.
Every expiry date in the Orange Book requires three verification steps before it can go into a financial model. First, check whether the patent has received a Patent Term Extension (PTE) under 35 U.S.C. § 156, which can add up to five years to compensate for regulatory review time. Second, check whether pediatric exclusivity has been granted, adding six months. Third, verify that the expiry date listed has not been updated due to terminal disclaimer filings or patent reissuance. DrugPatentWatch maintains a continuously updated version of Orange Book data with these adjustments applied, which is the correct primary source for financial modeling rather than the raw FDA database that requires manual cross-referencing with USPTO records.
Once the adjusted expiry dates are confirmed, the financial document interpretation proceeds through two questions: What is the total revenue currently protected by each listed patent? And how many distinct patents must be cleared before unencumbered generic entry is possible?
Patent Expiry Date vs. Effective Exclusivity Date: Why the Gap Destroys Generic ROI Models
The date a patent expires is not the date a generic can launch. This distinction destroys more generic ROI models than any other single error.
Between patent expiry and generic launch, the following events must occur: the ANDA must be approved (typically 10 to 12 months under GDUFA III review timelines, with a first-cycle approval rate well below 50% for complex products); any active Paragraph IV litigation stay must be resolved; any remaining FDA exclusivities must expire; and manufacturing scale-up must be complete.
For a brand drug whose last Orange Book patent expires in June 2027, a realistic generic launch date for a program starting development today might be Q3 2028 or later, depending on the complexity of the bioequivalence study design, the number of outstanding litigation stays, and the ANDA review cycle. A financial model that uses June 2027 as the launch date and projects revenue from that point is systematically wrong and will produce an NPV that overstates the opportunity by 12 to 24 months of revenue.
Building the Patent Landscape Analysis: Step-by-Step for a $50M Decision
A patent landscape analysis is not a literature review. It is a structured due diligence process that has specific outputs, each of which feeds directly into the financial model. The following steps represent the minimum required analysis before committing $5 million to development scoping, let alone $50 million to a full program.
Step 1: Orange Book Patent Enumeration and Classification
Pull every patent listed in the Orange Book for the target NDA. Classify each patent by type: composition of matter, formulation, method of use, device, or process. Process patents and device patents — if they were improperly listed in the Orange Book in the pre-2024 enforcement environment — may be delist candidates following the Federal Circuit’s December 2024 ruling in Teva v. Amneal Pharmaceuticals. That decision held that for a patent to be Orange Book-eligible, its claims must recite the active pharmaceutical ingredient. Device patents that claim only the delivery mechanism without reciting the API are now subject to delisting. For any device patents in your target drug’s Orange Book listing, assess whether they are vulnerable to an FTC challenge or a court-ordered delisting, because if they are, the effective exclusivity timeline compresses.
Step 2: USPTO Cross-Reference and Full Prosecution History Review
The Orange Book tells you what patents exist and when they expire. The USPTO prosecution history tells you how strong they are. For each patent in the Orange Book, pull the full prosecution history from USPTO Public PAIR or Patent Center. You are looking for: claim amendments made under examiner rejection (which often narrow the claims and create prosecution history estoppel that limits infringement arguments), prior art cited by the examiner, and any continuation or divisional filings that may be pending and not yet listed.
Pending continuation applications are the most dangerous blind spot in Orange Book analysis. A brand company can file a continuation of an existing patent application years after the parent was granted, claim the benefit of the parent’s filing date, and receive a new patent with a term that extends well beyond the parent. If a continuation is pending at the time you do your analysis and you miss it, your competitive timeline model will be wrong by the full term of the continuation, potentially years.
Step 3: Competitive ANDA Filing Intelligence
The FDA publishes ANDA filing information in its drugs database, and Orange Book updates disclose Paragraph IV certification notifications. Pull every ANDA filer already on record for your target drug. For each filer, determine whether they have a first-filer position, whether their ANDA is currently under litigation stay, and what their estimated development status is based on public disclosures.
This competitive mapping directly affects the economics of your investment decision. If three well-capitalized generic companies are already in active Paragraph IV litigation and you are evaluating entering as a fourth, the math is categorically different from a situation where no ANDA has been filed and you have a clear path to first-filer status. In the crowded scenario, you will share market entry with multiple competitors on day one, the 180-day exclusivity has already been claimed by the first filer, and your revenue assumption cannot include any exclusivity premium.
Step 4: Patent Validity Assessment by Patent Type
Composition-of-Matter Patent Validity Factors
CoM patents are generally the strongest because they protect the molecule itself. Invalidity attacks typically run on anticipation (prior art that discloses the same structure) or obviousness (prior art that would have rendered the structure obvious to a skilled chemist). The strength of a CoM patent correlates directly with the novelty of the chemistry at the time of filing: a first-in-class small molecule with no structural analogs in the prior art is much harder to invalidate than a me-too compound that sits in an obvious structural series.
Formulation Patent Validity: Obviousness as the Primary Weapon
Formulation patents — covering things like extended-release tablet matrices, spray-dried dispersions, or specific excipient combinations — are far more vulnerable to invalidity on obviousness grounds. The relevant prior art includes both earlier patents and published pharmaceutical science literature. A formulation patent claiming an extended-release matrix using well-known hydrophilic polymers at concentrations within the ranges routinely described in pharmaceutical textbooks is an obvious invalidity target. The question is whether the brand’s prosecuting attorney created meaningful claim differentiation from that prior art.
Polymorph and Salt Form Patents: The Evergreening Defense That Increasingly Fails
Polymorph patents cover specific crystalline forms of an API. Salt form patents cover specific salt selections (e.g., the hydrochloride salt versus the free base). Both are classic evergreening tools. Both are frequently challenged on obviousness grounds, with mixed results in court. The controlling question is whether the claimed polymorph or salt form had unexpected or non-obvious properties at the time of filing: a polymorph that merely exists without demonstrating superior stability, solubility, or manufacturability compared to other forms is a weak patent. If the brand’s own internal documents (disclosed in discovery) show that the polymorph was selected for routine screening rather than unexpected discovery, invalidity is a strong argument.
Method-of-Use Patents and Skinny Label Strategy
Method-of-use patents cover specific therapeutic applications. They do not prevent a generic from copying the molecule; they potentially prevent the generic from labeling its product for the specific indication covered by the patent. The generic’s response is a ‘skinny label’ — omitting the patented indication from its approved labeling and certifying only a Paragraph III (non-challenge) against the method-of-use patent rather than a Paragraph IV. The skinny label strategy allows the generic to launch without triggering a litigation stay for the method-of-use patent.
Skinny labeling became significantly riskier for generics after the Federal Circuit’s 2021 ruling in GSK v. Teva, where the court found that Teva’s skinny-label generic for carvedilol could induce infringement of GSK’s method-of-use patent because Teva’s cartons referenced the patented indication. The GSK v. Teva decision requires any generic using a skinny label to ensure that all promotional materials, carton text, package inserts, and FDA-mandated labeling elements are scrubbed of any reference to the carved-out indication. The induced infringement risk is real and must be specifically addressed in the legal due diligence supporting an investment decision.
Step 5: Litigation History Mapping and Outcome Probability Estimation
For the specific drug you are evaluating, pull all Paragraph IV litigation history from PACER and published case records. The litigation history tells you three things: how aggressively the brand defends this patent family, which law firms they use and what those firms’ track records are in Hatch-Waxman litigation, and what prior invalidity and non-infringement arguments have already been tested in court.
Prior rulings on the same patent claims have precedential or at least persuasive value. If a district court already found one of the listed formulation patents invalid for obviousness in litigation brought by a different ANDA filer, your Paragraph IV challenge on that patent starts in a much stronger position. The brand may choose to settle rather than face a second adverse ruling.
How to Model Paragraph IV Litigation Risk in a Generic R&D Business Case
Litigation risk modeling in a generic drug investment case is not about predicting whether you will win in court. It is about assigning probability weights to a set of discrete financial outcomes, then discounting the NPV of the program by those weights.
The Four Litigation Outcome Scenarios That Must Be Modeled
Every Paragraph IV case ultimately resolves in one of four ways. Each has a different financial profile, and each has a historically observable frequency.
The first scenario is a favorable court ruling: the court finds the challenged patents invalid or not infringed, the FDA can approve the ANDA immediately, and the first filer gets 180-day exclusivity. This is the highest-value outcome. The second scenario is settlement with a date-certain entry. Brand and generic negotiate a launch date, often accompanied by a license and sometimes a no-authorized-generic (no-AG) commitment. Settlements now account for the majority of Paragraph IV resolutions. The value depends entirely on the negotiated entry date and whether an AG will compete during the exclusivity window. The third scenario is an unfavorable ruling: the court upholds the challenged patents, the ANDA cannot be approved until expiry, and the entire investment is a sunk cost except for any manufacturing infrastructure built for other programs. The fourth scenario is a 30-month stay expiration followed by at-risk launch: the brand filed suit within 45 days, the stay ran its full 30 months, but the litigation is unresolved, and the generic launches commercially before a final ruling. This is the at-risk launch scenario, which carries massive upside if the eventual ruling is favorable but catastrophic downside if the court awards damages for patent infringement on the at-risk sales.
What Historical Paragraph IV Win Rates Actually Tell You
An RBC Capital Markets study analyzing over 370 court rulings since 2000 found that generic challengers prevailed (through either court win or favorable settlement) at rates that varied substantially by patent type and drug class, but the overall win rate for contested cases run to judgment has historically been around 50-60% for generics. That figure is not a license to assume a coin-flip probability. It is a population average that needs to be adjusted for the specific characteristics of the patents you are challenging.
Stronger validity adjustments toward the generic (higher win probability): the CoM patent has already expired and you are challenging only secondary patents; the challenged patents have narrow claims that require amendments during prosecution; the drug class has a rich prior art landscape that predates the patents; prior court decisions in related cases have gone against the brand.
Stronger validity adjustments toward the brand (lower win probability): the patents cover novel chemistry with limited prior art; the brand has a dedicated Hatch-Waxman litigation team at an experienced patent litigation firm; the drug is a high-revenue product where the brand has demonstrated willingness to litigate aggressively through multiple ANDA filers; there are 10 or more patents listed in the Orange Book covering different aspects of the product.
Modeling the Authorized Generic Risk: The Variable That Most Generic Business Cases Get Wrong
An authorized generic (AG) is a version of the brand product sold by the brand company itself, or licensed to a third party, that enters the market simultaneously with the first-filer generic during the 180-day exclusivity period. The FTC has documented that authorized generics reduce first-filer revenue by 40 to 52 percent during the exclusivity window.
Despite this, many generic investment models assign either a 0% or an arbitrary 20% probability to AG risk. The correct approach uses observable indicators of brand AG probability: Has the brand company launched AGs on other products? Do any existing settlement agreements across the brand’s portfolio include no-AG commitments (suggesting they use no-AG as settlement currency)? What is the brand’s financial position — a brand in financial distress with a blockbuster about to go generic is a near-certainty for an AG launch, because the AG revenue is the smoothest transition from full brand economics. What have equity analysts covering the brand company said about AG strategy for this specific product?
A no-AG agreement as part of a settlement negotiation is the most valuable single commercial term in a Paragraph IV negotiation. Its antitrust status remains complex — the FTC has consistently scrutinized no-AG commitments as potential reverse payment surrogates — but the commercial value is real enough that it should be explicitly modeled as a settlement scenario variant.
The 30-Month Stay Math: What Brand Revenue Protection Actually Means for Your Timeline
When a brand company sues within 45 days of receiving a Paragraph IV notification, the FDA cannot grant final ANDA approval for 30 months. For a drug generating $2 billion in annual revenue, that 30-month stay protects approximately $5 billion in brand revenue while litigation proceeds. This is why brands with large products sue virtually every Paragraph IV filer regardless of the merits: the litigation stay is worth billions, and the litigation cost is $5 million to $30 million, a trivial asymmetry.
For your generic investment model, the 30-month stay has a direct impact on the launch date and therefore the NPV. If you file your ANDA tomorrow and the brand sues within 45 days, your earliest possible FDA approval date is approximately 30 months from now, regardless of the strength of your patent challenge. Your financial model must include a scenario where the 30-month stay runs to completion, adding the stay period to your development timeline and discounting the NPV accordingly.
Quantifying the 180-Day Exclusivity Opportunity: The Core Revenue Case
The 180-day first-filer exclusivity is the prize that makes Paragraph IV litigation economically rational. Understanding exactly how to calculate the exclusivity opportunity for a specific drug is the core financial skill in generic drug investment analysis.
How 180-Day Exclusivity Is Triggered and When It Starts Running
The first ANDA applicant to file a substantially complete application with a Paragraph IV certification against a listed patent is eligible for 180-day exclusivity. During those 180 days, no subsequent ANDA applicant can receive final FDA approval for the same drug. This creates a temporary duopoly: brand and first-filer generic, or just the first-filer if the brand has not launched an AG.
The clock starts running on the earlier of the date of first commercial marketing or a court decision holding all challenged patents invalid or not infringed. This trigger timing matters because if you file early, win in court, but choose not to launch immediately, the exclusivity clock may begin running from the court decision date whether you are commercially ready or not. First-filer exclusivity can also be forfeited under specific conditions — including failure to market within 75 days of final FDA approval or a court decision, and certain antitrust agreements — so the forfeiture risk needs to be assessed as part of the investment case.
The Revenue Calculation: Drug Market Size × Capture Rate × Pricing × Exclusivity Duration
The 180-day exclusivity revenue calculation has four inputs, each of which requires its own sourcing and justification in the investment case.
First input: current brand revenue. This is the total annual revenue the brand drug generates in the United States market. Use trailing 12-month U.S. net revenue from brand company earnings disclosures, cross-referenced with IQVIA prescription volume data and WAC/net pricing information from SSR Health or Evaluate Pharma. Do not use global revenue; the 180-day exclusivity applies only in the U.S. market.
Second input: generic market capture rate during exclusivity. With only one generic in the market, volume capture typically runs at 40 to 65 percent of brand prescriptions within the first 90 days, increasing toward 70 to 80 percent by day 150. If an authorized generic is simultaneously in market, your share of the generic volume is approximately 50 percent, and the AG’s pricing pressure will reduce the achievable generic price. Model both the no-AG and AG scenarios as separate branches.
Third input: generic pricing during exclusivity. During 180-day exclusivity, a first-filer typically prices at 20 to 30 percent below the brand WAC, not at the 80 to 90 percent discount that multi-source generic competition eventually produces. This pricing premium is the direct financial expression of the exclusivity protection. Once exclusivity ends and the market opens to additional generic entrants, pricing compresses rapidly toward the multi-source equilibrium.
Fourth input: exclusivity duration net of launch delays. The full 180 days may not be commercially capturable if ANDA approval is delayed, if supply chain ramp-up lags the approval date, or if a Complete Response Letter (CRL) causes a review cycle delay that allows a second filer to file a cleaner submission and receive approval before you. A CRL at the Paragraph IV stage is commercially catastrophic: it can cost 12 to 24 months of launch delay, and for large-market drugs with first-filer exclusivity at stake, that delay may be worth $100 million or more in forgone revenue.
For a drug with $1.5 billion in annual U.S. net revenue: a 50% volume capture at 75% of WAC for 180 days generates approximately $140 million in gross revenue before cost of goods. Against total program investment (development, ANDA preparation, litigation, and manufacturing) of $50 million and litigation costs of $10 to $20 million, the risk-adjusted NPV at a 60% litigation success probability and 35% AG probability produces a probability-weighted NPV in the range of $40 to $60 million. That is a thin but defensible return on a $50 million investment, and it is precisely the kind of calculation a board or investment committee expects to see.
What Happens to 180-Day Exclusivity If You Settle: The Date-Certain Entry Model
Most Paragraph IV cases settle. The settlement terms, not the court outcome, determine the financial result. A settlement that grants an entry date of 24 months before natural patent expiry — meaning 24 months of generic revenue that would not otherwise exist — is the actual prize, not the court win. Generic challengers do not need to win in court to receive 180-day exclusivity: the exclusivity period is triggered even if the litigation ends in settlement, provided the generic markets its product during the exclusivity window.
The settlement NPV model needs to incorporate: the negotiated entry date, the no-AG commitment (or lack thereof), any royalty payment obligations, any supply or volume restrictions that affect revenue capture, and the litigation cost actually incurred to reach the settlement. A settlement that grants entry two years before patent expiry without an authorized generic, reached after $8 million in litigation costs, on a product generating $800 million in annual revenue, is an extraordinarily high-return investment even though it never produced a court ruling.
The Patent Thicket Problem: How to Evaluate Multi-Patent Defense Strategies
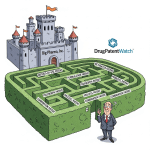
The most dangerous pattern in generic drug development is the patent thicket: a dense cluster of secondary patents that collectively maintain effective exclusivity years beyond the CoM expiry date. AbbVie’s Humira is the canonical example. The drug had a CoM patent that expired in 2016. Through a combination of 250-plus additional patents filed predominantly after market launch — covering formulations, manufacturing processes, dosing regimens, device components, and new indications — AbbVie maintained U.S. biosimilar exclusivity until 2023. Roughly 90 percent of Humira’s patent portfolio was filed after market launch. The U.S. exclusivity extension delivered over $100 billion in additional revenue.
How to Identify a Patent Thicket in the Orange Book Before You Commit Capital
A patent thicket is identifiable before you commit capital if you do the patent enumeration correctly. The indicators are: more than 10 patents listed in the Orange Book for a single NDA; multiple patents with expiry dates extending 5 or more years beyond the CoM expiry; a high proportion of continuation filings with filing dates that post-date FDA approval; and an absence of existing Paragraph IV challenges, which suggests previous generic teams evaluated the thicket and decided the litigation cost was not worth the return.
The last indicator is particularly important. When no other well-resourced generic company has filed a Paragraph IV against a patent thicket despite the drug’s market size, the most likely explanation is not that they missed it — it is that they evaluated it and passed. This reverse selection effect means that the most visible, large-market patent thickets have already been evaluated and declined by the best-resourced players in the industry. Your investment committee should ask directly: why are we going where Teva, Sandoz, and Mylan have not gone?
Patent-by-Patent Validity Mapping: How to Find the Weak Link in a Thicket
A patent thicket is not as strong as its largest number. It is only as strong as its strongest individual patent, because a generic company that successfully invalidates even one of the listed patents can eliminate the 30-month stay for that patent and potentially open a path to market. The analytical task is to map each patent in the thicket on two dimensions: validity (how likely is this patent to survive a Paragraph IV challenge) and commercial criticality (how much does this specific patent contribute to effective exclusivity).
Patents that are both weak on validity and high on commercial criticality are the primary targets. These are the cases where a Paragraph IV challenge has the best probability-adjusted return. Patents that are strong on validity but low on commercial criticality (because the CoM has already expired and these are minor formulation variations with no market-facing relevance) can be addressed via non-infringement arguments or skinny-label carve-outs rather than expensive validity challenges.
The Entresto Model: Fixed-Dose Combination Patent Thickets
Novartis’s Entresto (sacubitril/valsartan) illustrates the complexity of fixed-dose combination patent thickets. The drug generated approximately $7.8 billion in annual revenue in 2024, with loss of exclusivity expected in mid-2025. Its patent portfolio includes composition-of-matter protection on the sacubitril-valsartan molecular complex, formulation patents on the specific tablet architecture, and method-of-use patents covering heart failure with reduced ejection fraction.
Valsartan, one of the two components, is already generic. Sacubitril is the novel patented entity. Generic manufacturers challenging Entresto must demonstrate bioequivalence for the combination product despite sacubitril’s complex prodrug metabolism to its active form, LBQ657. This technical complexity adds to the development cost on top of the legal complexity of the patent portfolio. An investment team evaluating an Entresto ANDA in 2024 was not just modeling litigation risk on a patent thicket; it was also budgeting for a bioequivalence program significantly more expensive than a standard oral solid, against a drug with an effective exclusivity wall that required active management through 2025.
FDA Exclusivity Periods vs. Patent Expiry: What the Model Must Track Separately
FDA exclusivity and patent protection are two independent systems that must be tracked independently. An ANDA can be blocked by FDA exclusivity even when every Orange Book patent has expired, and it can be blocked by a patent stay even when FDA exclusivity has run out. Both clocks must be in your model.
New Chemical Entity Exclusivity: The Five-Year Wall
NCE exclusivity prevents the FDA from accepting any ANDA for the first four years after approval (or accepting and approving for the full five years). This exclusivity period runs from the NDA approval date, not from the patent filing date. For recently approved drugs where NCE exclusivity is still active, no ANDA can be filed for the covered drug for the relevant period, regardless of the patent situation. If you are evaluating a molecule approved in 2022, NCE exclusivity runs through 2026 or 2027, meaning ANDA filing is not legally possible until then, and approval — given a 12-month review cycle — would be 2027 or 2028 at earliest. This compresses your competitive window and extends your capital commitment timeline.
Pediatric Exclusivity: The Six-Month Surprise That Delays Generic Entry
Pediatric exclusivity, triggered by a brand company conducting FDA-requested pediatric studies, adds six months to the end of every patent and exclusivity period protecting the drug. For a CoM patent expiring December 31, 2026, pediatric exclusivity pushes the effective entry date to June 30, 2027. For a drug with multiple patents, pediatric exclusivity extends each one by six months, including any that were already the last patent standing before the six-month addition. Pediatric exclusivity is publicly disclosed in the Orange Book, but it is frequently overlooked in initial patent landscape reviews because analysts focus on the primary expiry dates. Check every target drug’s Orange Book entry for the pediatric exclusivity flag before finalizing any launch date assumption.
Orphan Drug Exclusivity and Niche Generics: When Seven Years Changes the Math
Orphan drug exclusivity gives a brand seven years of market protection against any ANDA or NDA for the same drug for the same orphan indication, measured from FDA approval. This exclusivity does not prevent an ANDA for a non-orphan indication of the same drug, nor does it prevent approval for a different orphan indication. For niche generic programs targeting orphan drugs — which are an increasingly attractive target because of the high price points that make the economics work on small unit volumes — the orphan exclusivity period is the dominant constraint on the timeline, often more restrictive than the patent portfolio itself.
At-Risk Generic Launches: How to Model the Upside and Quantify the Exposure
An at-risk launch occurs when a generic company launches commercially before patent litigation is fully resolved. The brand has filed suit, the 30-month stay has run or is running, and the generic decides to launch and bear the risk of an adverse court ruling, which would expose it to damages on every unit sold during the at-risk period. At-risk launches are not reckless; they are calculated decisions with clearly defined upside and downside. Modeling them correctly is essential for any investment case targeting a large-market drug with ongoing litigation.
At-Risk Launch Economics: Revenue Window vs. Damage Exposure
The upside of an at-risk launch is the commercial revenue generated during the pre-ruling period. If the drug generates $300 million per quarter in generic revenue and the litigation takes 12 more months to resolve, an at-risk launch generates approximately $1.2 billion in additional revenue against the risk of having to disgorge profits and pay damages if the court finds infringement.
The downside is not unlimited. In Hatch-Waxman cases, patent infringement damages are typically based on the brand’s lost profits or a reasonable royalty, not on the generic’s total revenue. The brand’s actual lost profit calculation is complicated by the fact that some market volume would have been captured by other generics or authorized generics even if the at-risk launch had not occurred. The expected damages range in Paragraph IV litigation is on the order of 10 to 30 percent of the at-risk revenue, not 100 percent. This means the expected-value calculation often favors launching at risk when the upside revenue is large and the patent challenge has a reasonably high probability of success.
The at-risk decision should never be made on the NPV model alone. It requires a legal opinion from trial counsel, a board resolution, and a clear escrow or reserve plan for potential damages. But it belongs in the investment case as a modeled option, not as an afterthought.
Warner Chilcott and the At-Risk Launch Precedent: What the Track Record Shows
Established precedent in Hatch-Waxman litigation shows at-risk launches occurring most frequently when: the remaining patent term is short (less than 24 months), the generic’s invalidity arguments are strong, the brand’s litigation behavior has been dilatory, and the generic has first-filer exclusivity to protect from a later entrant. The financial logic is symmetrical: the shorter the remaining exclusivity the brand is protecting, the smaller the damages pool if the at-risk launch fails. A brand defending patents with 18 months of remaining life is defending $X in revenue; the damages for infringement of that patent cannot exceed a reasonable royalty on the generic’s revenues during those 18 months, a figure that is often manageable relative to the market entry value.
Using DrugPatentWatch for Competitive Intelligence in R&D Investment Decisions
Building the analysis described in this article from raw sources — FDA Orange Book files, USPTO Patent Center, PACER litigation records, company SEC filings, and IQVIA commercial data — requires weeks of analyst time per drug evaluated. DrugPatentWatch integrates these sources into a structured database that allows rapid screening of patent landscapes, ANDA filing histories, litigation statuses, and expiry schedules across the full universe of branded drugs. For a portfolio team evaluating 20 to 30 potential generic programs in a pipeline review cycle, the platform compresses the initial screening phase from months to days.
The specific capabilities relevant to a $50 million investment case are: Orange Book cross-reference with USPTO records for PTE and continuation identification, Paragraph IV filing tracker with litigation status updates, settlement date-certain entry calendars, competitive ANDA filer intelligence, and patent claim text search for prior art cross-referencing. The platform also tracks FTC Orange Book delisting actions, which became material after the 2023-2024 FTC enforcement campaign challenged over 400 Orange Book patent listings as improperly filed.
How to Use Patent Expiry Screening to Build a Generic Drug Pipeline Prioritization Matrix
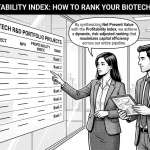
A practical pipeline prioritization matrix for generic drug R&D investment combines four variables from patent data into a single ranked output. The variables are: estimated effective exclusivity expiry (the latest expiry among all Orange Book patents and FDA exclusivities, adjusted for PTEs and pediatric exclusivity), current brand U.S. annual revenue (the market size), number of existing ANDA filers (the competitive intensity), and qualitative patent strength assessment (the expected difficulty and cost of the Paragraph IV challenge).
Sorting this matrix by the ratio of (brand revenue / competitive intensity / patent strength) produces a ranked list of targets ordered by expected return per unit of investment. Products with large revenues, few or no existing ANDA filers, and weak secondary patent positions consistently rank at the top. This is the first screen, not the last one. Every product in the top quartile of the matrix still requires the full landscape analysis described earlier in this article before a go/no-go decision is made.
Complex Generics and 505(b)(2) Programs: How the Patent Strategy Changes at Higher Development Costs
The patent analysis framework described above applies directly to standard oral solid generics with bioequivalence-based ANDA pathways. Complex generics — inhaled products, transdermal systems, modified-release oral formulations, injectable emulsions, ophthalmic suspensions — and 505(b)(2) programs require modifications to the framework that reflect both higher development costs and different legal exposure.
Complex Generic Development Costs vs. ANDA Standard: Where the $50M Threshold Comes From
A standard oral solid ANDA costs $1 million to $5 million to develop. A complex generic with a difficult bioequivalence pathway costs $10 million to $30 million in bioequivalence studies alone, with total program costs reaching $25 million to $50 million. Bioequivalence methodology for locally acting drugs — inhaled corticosteroids, dermatological products, ophthalmic drugs — is product-specific and often requires comparative clinical endpoint studies rather than simple pharmacokinetic trials. For an inhaled generic, the FDA product-specific guidance may require a full clinical endpoint study costing $20 million or more. That single cost item accounts for 40 percent of a $50 million total program budget.
At these development costs, the patent landscape analysis must clear a higher bar. A standard ANDA can be economically viable with a 40 percent probability of litigation success on a $500 million drug. A complex generic at $50 million in development costs requires either a much larger market ($1.5 billion or more in brand revenue) or a substantially higher probability of litigation success, or both, to produce an acceptable risk-adjusted return.
505(b)(2) Programs: When Exclusivity Is the Strategy, Not Just the Prize
A 505(b)(2) application references the safety and efficacy data of an existing NDA product but includes some clinical data supporting a new formulation, new dosage strength, new route of administration, or new indication. The product, if approved, may carry three years of Hatch-Waxman exclusivity as a new formulation, creating a protected window before additional ANDA competition.
For a generic company, the 505(b)(2) pathway is a mechanism to layer a specialty product margin on top of standard generic economics. Develop the standard ANDA for the commodity generic market; simultaneously develop a 505(b)(2) for a new extended-release formulation of the same molecule, with its own three-year exclusivity. The 505(b)(2) program costs more, but the protected pricing window during the three-year exclusivity period significantly improves the overall portfolio economics.
The patent analysis for a 505(b)(2) program must account for the fact that the brand’s listed patents may be partially relevant to the new formulation. If the 505(b)(2) product’s formulation is covered by a brand-listed formulation patent that the 505(b)(2) applicant has not independently developed around, the 505(b)(2) may still trigger a Paragraph IV challenge to that patent. The legal analysis of whether the 505(b)(2) formulation infringes any listed brand patent is a prerequisite for the investment decision, not an afterthought.
IRA Pricing Negotiations and Their Effect on Generic R&D Investment Cases
The Inflation Reduction Act of 2022, through its Medicare drug price negotiation provisions, materially changes the Paragraph IV litigation calculus for drugs subject to negotiated Medicare prices. This is a new dimension in the investment case that did not exist before 2024 and was not part of any published generic investment framework before the first negotiated prices took effect.
How IRA-Negotiated Medicare Prices Compress Generic Paragraph IV Returns
When Medicare negotiates a drug’s price downward by 50 to 79 percent (the statutory range for the first negotiation cycle), the revenue base that a successful Paragraph IV challenge is protecting shrinks. A drug generating $3 billion in annual U.S. revenue before IRA negotiation may generate $1.5 billion after negotiation. The 180-day exclusivity revenue calculation based on the pre-IRA revenue figure is wrong. The post-IRA figure is the correct input.
The IRA also directly affects the brand company’s incentive to defend its patents aggressively. A brand defending a patent on a drug whose price is already compressed by 50 percent through Medicare negotiation is defending less revenue per year of exclusivity extension. The ROI on spending $30 million in litigation costs to defend a patent that protects $600 million per year (post-IRA net) is different from the ROI on defending the same patent when the pre-IRA net was $1.2 billion per year. The brand’s settlement posture is likely to be more accommodating, which benefits the generic challenger’s timeline negotiation.
Which Drugs Are IRA Targets in 2026-2028 and What That Means for Generic Programs
The first IRA-negotiated prices took effect January 1, 2026, covering ten drugs selected for the first negotiation cycle. The second negotiation cycle, covering fifteen additional drugs selected in 2024, produces prices effective January 2027. Generic teams evaluating drugs on or near the negotiation selection list need to model the IRA price impact on their commercial assumptions. A drug that makes the negotiation list before the generic’s anticipated launch date will have a lower post-negotiation net price, and the generic’s price (which is set as a discount to the brand) will also be lower. Both the brand revenue base and the achievable generic pricing are affected.
The Patent Landscape Analysis Deliverable: How to Structure the Investment Committee Memo
The output of all of the above work is a document that a senior management team or investment committee can use to make a $50 million decision. This section describes the required components of that document and the format in which each should be presented.
Section 1: Target Product Profile and Market Sizing
One page. Drug name, NDA number, active ingredient, current brand company, formulation type, therapeutic indication, annual U.S. net revenue (trailing 12 months, sourced from brand earnings or IQVIA), patent expiry landscape summary (earliest entry date without challenge, earliest entry date with successful Paragraph IV challenge), and FDA exclusivity summary (any active NCE, orphan, or pediatric exclusivity periods).
Section 2: Patent Landscape Summary Table
A table with one row per Orange Book-listed patent, showing: patent number, patent type (CoM, formulation, method of use, device), expiry date (unadjusted), PTE-adjusted expiry, any pending continuations, current litigation status, and qualitative validity assessment (strong, moderate, weak) with one-sentence rationale. This table is the factual core of the investment case. Every number in it should be sourced to Orange Book data, USPTO records, or DrugPatentWatch, with the data pull date noted.
Section 3: Competitive ANDA Intelligence
List every current ANDA filer, their first-filer status, their litigation status, their estimated ANDA approval timeline, and any publicly disclosed settlement terms. Include the number of pending ANDAs not yet in litigation. This section directly informs the launch-day competitive scenario and the multi-source pricing model post-exclusivity.
Section 4: Financial Model with Scenario Analysis
Four scenarios modeled with full NPV calculations:
Scenario A: Successful Paragraph IV challenge with 180-day exclusivity, no authorized generic, generic launch 12 months before natural patent expiry
Scenario B: Successful Paragraph IV challenge with 180-day exclusivity, authorized generic competes during exclusivity window
Scenario C: Settlement with date-certain entry 24 months before natural expiry, no-AG commitment, 180-day exclusivity window shared with brand AG in the alternative
Scenario D: Adverse litigation outcome, generic launch at natural patent expiry without exclusivity
Assign probability weights to each scenario based on the patent validity assessment, competitive field analysis, and brand litigation behavior history. Compute the probability-weighted blended NPV. This is the number the investment committee votes on.
Section 5: Development Cost and Timeline
Total development cost itemized by stage: API sourcing and characterization, formulation development, bioequivalence study design and execution, ANDA preparation and filing, regulatory advisory fees, GDUFA fees, and contingency. Timeline from project start to ANDA filing, ANDA filing to anticipated approval, and approval to first commercial shipment. The timeline feeds directly into the NPV model’s discount rate application and should be stress-tested against a CRL scenario that adds 12 to 18 months to the review cycle.
Section 6: Litigation Cost Budget and Legal Strategy Outline
Litigation cost range (low, base, high) based on the expected complexity of the Paragraph IV challenge, number of patents to be challenged, anticipated trial duration if the case goes to judgment, and outside counsel rate estimates. Legal strategy summary: which patents will be challenged on invalidity, which on non-infringement, and whether skinny-label carve-outs are available for method-of-use patents.
Loss-of-Exclusivity Timing and Generic Entry Forecasting: How Brand Revenue Erosion Models Work
Understanding how branded drug revenue erodes after generic entry is as important as understanding the patent landscape. The revenue erosion model is the right-hand side of the generic investment case: it tells you what market you are entering and how quickly it will compress after the first generic arrives.
Generic Revenue Erosion by Drug Type: Historical Data for Financial Models
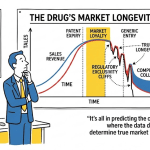
For small-molecule oral solid drugs in high-competition therapeutic categories, the Lipitor archetype holds: approximately 50 percent revenue erosion within 12 months of first generic entry, 80 to 90 percent erosion within 24 months. Pfizer’s atorvastatin (Lipitor) lost approximately 50 percent of its revenue within the first year of generic entry, and 80 to 90 percent within 24 months, regardless of the quality of the commercial defense Pfizer mounted.
For specialty molecules with smaller patient populations, less substitutable formulations, or physician-preference dynamics, erosion is slower: 40 to 60 percent within 24 months in some CNS and oncology categories. For locally acting drugs where bioequivalence is difficult to demonstrate and the FDA product-specific guidance is demanding, fewer generics get approved, and erosion is slower still because the competitive field is thinner.
Biosimilar erosion is categorically different from generic erosion. Prices for biologic reference products drop 30 to 40 percent initially when biosimilars enter, and market share transfer to biosimilars takes 3 to 5 years compared to the 12 to 24 months for small-molecule generics. The slower erosion reflects PBM rebate dynamics, physician substitution inertia, and the absence of automatic pharmacy-level substitution (unless the biosimilar has interchangeability designation).
When Should a Generic Company File Against a Drug Still Under Active Brand Promotion?
This question surfaces regularly in investment decisions for drugs that are generating high revenue and still under aggressive brand promotion. The investment logic argues for filing early, capturing first-filer status, and using the litigation period to complete development. The risk is that the brand’s commercial team uses the litigation period to entrench formulary positions, establish co-pay assistance programs that lock in patient-brand relationships, and prepare an authorized generic that is commercially ready the moment the stay lifts.
The countervailing argument for later filing — after the commercial peak but with a cleaner competitive field — is that you may lose first-filer exclusivity to a competitor but enter a market with more rational competitive dynamics. Neither timing strategy dominates universally. The correct answer depends on the specific brand’s commercial behavior pattern, the strength of the first-filer exclusivity premium for this drug, and the competitive threat from other potential Paragraph IV filers.
Paragraph IV vs. Paragraph III Certification: When Not to Challenge Is the Right Decision
Not every patent in the Orange Book should be challenged via Paragraph IV certification. Certifying Paragraph III — acknowledging a patent’s validity and agreeing to wait for its expiry — may be the correct strategic choice in several circumstances, and including Paragraph III certifications in an ANDA does not forfeit first-filer status on the patents that are being challenged via Paragraph IV.
When a Paragraph III Certification Makes More Economic Sense Than a Paragraph IV Challenge
Paragraph III makes sense when: the patent in question covers a method of use that the generic is not labeling for (in which case a Paragraph III or declaratory judgment approach may be available); the patent is a process patent improperly listed in the Orange Book that will be delisted through FTC or court action before your launch date; the patent expires within 12 to 18 months of your expected natural entry date, making the litigation cost not worth the marginal acceleration in launch timing; or the patent covers a formulation variant that your generic does not use and you can demonstrate non-infringement through a design-around that has already been validated.
Deciding which patents to challenge via Paragraph IV and which to certify Paragraph III is a strategic decision with both financial and legal dimensions. It needs to be made by a team that includes both patent litigation counsel and the commercial team, because the decision directly affects the launch date, the revenue model, and the litigation budget.
Supply Chain and API Sourcing in the Patent Investment Case
Generic drug investment cases often underweight API sourcing risk. The patent landscape is clear, the litigation strategy is sound, the bioequivalence study is designed — and then the program stalls because the API manufacturer has a process patent that blocks your supply chain, or because the API is controlled by a single supplier with inadequate capacity, or because an FDA warning letter at the API manufacturing site creates a supply reliability problem that delays ANDA approval.
Process Patent Risk in API Sourcing: The Invisible Layer in the Patent Landscape
Process patents cover the manufacturing route used to produce the API. They are not Orange Book-eligible and do not appear in the FDA patent registry. But they are real patents that a brand-affiliated API supplier can enforce against a generic manufacturer using the same or an equivalent process. The nitrosamine crisis of 2018-2022 exposed a related supply chain vulnerability: when widely used API synthesis processes were found to generate carcinogenic nitrosamine impurities, the entire generic drug supply chain for affected molecules required reformulation, and many generic programs that had cleared every regulatory and IP hurdle faced multi-year supply disruptions.
API sourcing due diligence for a $50 million program must include: a review of any process patents filed by API manufacturers in the same molecular space, an assessment of FDA warning letter history at the planned API supply sites, an independent evaluation of the API process for nitrosamine impurity formation risk, and confirmation that at least two qualified API suppliers exist or can be qualified within the development timeline. A single-source API supply chain at the stage of a $50 million commitment is an unacceptable concentration risk.
Global Patent Landscape Considerations: EU, Japan, and Emerging Markets
A U.S.-focused generic program with a positive NPV may have additional value from global patent landscape opportunities, or it may have its economics complicated by global patent and exclusivity terms that the U.S. analysis did not cover. Both directions need at least a high-level assessment in a $50 million investment case.
EU Market Entry: No 30-Month Stay and Different Exclusivity Rules
The European Union generic approval pathway does not carry the automatic 30-month litigation stay that is the central feature of U.S. Paragraph IV litigation. A generic company challenging a European patent does so through national court proceedings or EPO opposition, and the regulator is not bound to withhold approval pending litigation resolution. This is a structural advantage for European generic challengers: they can receive marketing authorization and launch commercially while patent litigation proceeds, subject to interim injunction risk. For drugs where the European patent position is weaker than the U.S. position, a European launch during litigation may be feasible while the U.S. case is still working through the courts.
The EU 8+2+1 data exclusivity formula (eight years of data exclusivity, two years of marketing exclusivity, one additional year for new therapeutic indication) runs independently of the patent term. Both the EU exclusivity calendar and the European patent status must be tracked concurrently in any global launch planning exercise. The common error is assuming that U.S. patent expiry means European entry is simultaneously available, when in fact European data exclusivity may still be running.
Risk-Adjusted Return Benchmarks: How Does a Generic R&D Investment Compare to Other Pharmaceutical R&D?
A $50 million generic drug R&D program competes for capital against branded drug development programs, biosimilar programs, and other generic programs within the same organization. The investment committee will inevitably ask for a relative return comparison. Understanding how generic R&D IRR compares to the alternatives is necessary context for any generic investment case.
Generic Drug R&D IRR vs. Branded Drug R&D IRR: The Numbers That Actually Matter
Branded drug development programs targeting novel mechanisms carry development costs in the range of $1 billion to $2 billion per approved drug (including the cost of failures), development timelines of 10 to 15 years, and probability of FDA approval from Phase I of approximately 10 to 12 percent. The IRR on successful branded programs is very high, but the expected value including failure probability is much lower. DeloitteCenter for Health Sciences estimates of branded R&D ROI have been declining since 2015 and as of the most recent analyses run below the cost of capital for many large pharma companies.
Generic drug R&D programs targeting first-filer Paragraph IV opportunities have development timelines of 3 to 5 years for complex generics, development costs of $10 million to $50 million, and probability of commercial viability (reaching a favorable litigation outcome or settlement on terms better than natural expiry) of approximately 50 to 70 percent for well-selected targets. The IRR on a first-filer exclusivity program on a $1 billion drug, at five to eight years from development start to exclusivity capture, is substantially higher than the expected IRR on comparable capital deployed in branded Phase II development.
This comparison does not mean generic R&D is a superior use of capital in all cases. It means that a $50 million generic program targeting a well-selected first-filer opportunity produces a risk-adjusted return competitive with early-stage branded development, with a shorter development timeline, a narrower set of specific risks, and a more analytically tractable investment case. Those attributes matter for capital allocation decisions in organizations where capital is finite and the cost of portfolio overcommitment is real.
Biosimilar vs. Generic Investment Case: When Does the Higher Development Cost Pay Off?
Biosimilar development programs cost $100 million to $250 million, driven by the analytical and clinical requirements of demonstrating biosimilarity to a complex biologic reference product. Interchangeability designation, which allows pharmacy-level substitution without physician intervention, adds another $20 million to $50 million and one to two additional years. The commercial payoff of interchangeability is real — pharmacy substitution rates for designated biosimilars are substantially higher than for non-designated products — but it requires modeling the specific market dynamics of the reference biologic, PBM rebate structures, and formulary positioning.
The generic vs. biosimilar capital allocation decision depends on three variables: available patent challenge opportunities in the small-molecule space, the organization’s existing biologics manufacturing capabilities, and the competitive field in the biosimilar market for the target reference product. A company without existing biologics manufacturing infrastructure faces a capital investment in facilities that, added to the development program cost, may push total biosimilar entry costs well above $300 million. At that scale, the financial modeling requirements are closer to a branded drug development investment case than a generic program investment case.
Case Study: Building the Investment Case for a Real Drug Patent Scenario
Rather than a hypothetical, consider how the framework applies to a real historical example: Ranbaxy’s Paragraph IV challenge against Pfizer’s atorvastatin (Lipitor), which ultimately produced 180-day exclusivity and approximately $600 million in revenue for Ranbaxy’s six-month exclusivity window in late 2011 and early 2012.
The Lipitor Paragraph IV: Patent Intelligence Anatomy of a $600M Outcome
Pfizer’s Lipitor (atorvastatin calcium) was the best-selling drug in pharmaceutical history at its patent expiry, generating approximately $10 billion in annual U.S. revenue at its peak. Ranbaxy filed the first Paragraph IV certification against Lipitor’s key patents in 2003, approximately eight years before the primary patent expiry date of November 2011.
Pfizer held a pediatric exclusivity extension worth six months beyond the base patent, pushing the final exclusivity date to March 2012. That six-month extension was worth approximately $1.8 billion in protected U.S. revenue at Lipitor’s then-current run rate. Pfizer also held formulation and process patents that Ranbaxy challenged via Paragraph IV certifications. Ranbaxy secured first-filer exclusivity by statute and eventually monetized the 180-day exclusivity period through a licensing arrangement with Pfizer that allowed Ranbaxy to market an authorized version of Lipitor as the authorized generic while also selling its own generic.
The eight-year gap between Ranbaxy’s 2003 Paragraph IV filing and the 2011 launch illustrates the capital patience required for first-filer strategies on heavily defended blockbuster drugs. An investment case written in 2003 would have needed to model litigation costs over eight years, the authorized generic risk from Pfizer, the competition from Teva and other Paragraph IV filers who entered after Ranbaxy, and the eventual settlement terms. The $600 million exclusivity revenue outcome was real, but the path to it required sustained investment and litigation expenditure over nearly a decade.
What the Lipitor Case Teaches About Modeling Long-Duration Generic Investments
The Lipitor case demonstrates three principles that belong in every generic investment case for large-market drugs. First, the litigation timeline is endogenous to the brand’s financial incentives: a drug generating $10 billion per year will be defended with whatever litigation resources are necessary, and the timeline model must reflect that reality. Second, settlement terms on large-market drugs increasingly involve authorized generic arrangements that share the exclusivity window value between brand and generic, requiring explicit AG probability modeling. Third, the first-filer position on a large-market drug is so commercially valuable that competitors will invest heavily to dispute it, litigate forfeiture triggers, and challenge the first-filer’s exclusivity through every available mechanism.
Timeline: From Patent Data to ANDA Filing to Generic Market Entry
A structured timeline is the operational backbone of any generic drug investment case. The following represents a realistic generic program timeline for a complex oral solid with an active Paragraph IV challenge, calibrated against GDUFA III review timelines and current litigation duration data.
Months 1-3: Target selection and patent landscape analysis. Output: go/no-go decision, investment committee approval of initial $5 million scoping budget.
Months 3-9: API sourcing and qualification. API characterization, process patent freedom-to-operate analysis, second supplier identification.
Months 6-18: Formulation development and optimization. Pilot-scale batches, preliminary stability data, BE study design work with FDA product-specific guidance review.
Months 12-24: Bioequivalence study design, IND submission if required, CRO selection and study execution.
Months 24-30: ANDA compilation and filing. Patent certification decisions, Paragraph IV legal opinion, brand notification letter preparation.
Month 30-32: Brand receives Paragraph IV notification. 45-day litigation decision window for brand. If brand sues: 30-month stay begins.
Months 30-42: FDA review cycle under GDUFA III. First-cycle decision: approval or CRL. If CRL, add 12-18 months.
Months 30-60: Paragraph IV litigation. Discovery, Markman hearing, trial, post-trial briefing. Or settlement negotiations.
Month 60: Target commercial launch (optimistic, no CRL, settlement at favorable terms, manufacturing ready).
What This Means for CFOs and Investment Committees Evaluating Generic Drug R&D
The CFO’s view of a $50 million generic drug R&D commitment should center on three questions that the patent analysis framework in this article is designed to answer.
First: Is the capital being deployed before or after a clear patent risk assessment? A go-decision made without the full patent landscape analysis described here is not a calculated risk; it is a blind bet. The patent analysis is not optional preliminary work; it is the primary investment filter. Every dollar of the $50 million is secured or wasted by the quality of the patent landscape work done in the first 90 days.
Second: Is the financial model built on the effective exclusivity expiry date or the nominal patent expiry date? The gap between these two dates, which can be as large as 18 to 24 months for drugs with FDA exclusivity, pediatric exclusivity, and pending continuation applications, translates directly into the NPV. A model built on the wrong date will produce an NPV that is systematically overstated.
Third: Has the authorized generic scenario been explicitly modeled with a probability weight based on observable brand behavior, not assumed away? The 40 to 52 percent revenue impact of an AG during the exclusivity window is the most important single variable in the generic exclusivity revenue model, and it is the variable most frequently underweighted in investment cases that fail to produce expected returns.
Key Performance Indicators for Monitoring a Generic Drug R&D Program Post-Approval
Once an ANDA is filed and the program is in the litigation and review phase, the KPIs that matter are: ANDA review status (first-cycle vs. CRL cycle), litigation milestone schedule (Markman ruling, trial date, settlement negotiation status), competitor ANDA status updates (new filers, competitor CRLs, competitor settlements), brand commercial behavior (any indication of AG preparation, product hopping activity, or formulary defense investment), and supply chain readiness (API inventory, manufacturing batch record status, commercial launch readiness milestones).
Each of these KPIs connects directly to a variable in the financial model. A material change in any of them — a competitor receiving approval before your ANDA, a brand announcing an AG partnership, your own ANDA receiving a CRL — should trigger a model refresh and a board-level decision on whether to continue, renegotiate the resource allocation, or exit the program.
Key Takeaways
Patent data is financial data. A $50 million generic R&D commitment made without a complete Orange Book analysis, USPTO prosecution history review, and FDA exclusivity calendar is not a justified investment — it is a lottery ticket.
The effective exclusivity expiry date is not the same as the nominal patent expiry date. PTEs, pediatric exclusivity, and pending continuation applications can add 12 to 36 months to the actual entry date. All three must be modeled.
The 180-day first-filer exclusivity period is the primary financial driver of Paragraph IV investment cases. For a drug with $1.5 billion in annual U.S. revenue, a successful first-filer program can produce $120 to $160 million in gross revenue during the exclusivity window, against total program costs of $50 to $70 million.
Authorized generic risk is the single most underweighted variable in generic investment cases. The FTC has documented a 40 to 52 percent revenue impact. Model it with an explicit probability weight based on observable brand behavior, not at zero.
Patent thicket analysis requires patent-by-patent validity mapping, not a holistic deterrence assessment. The strategic question is not ‘is this thicket too hard to clear?’ but ‘which specific patents in this thicket are weak enough to challenge profitably?’
IRA Medicare price negotiations materially compress the revenue base for any drug on the negotiation selection list. The correct commercial input to a generic model is the post-IRA net price, not the historical WAC.
A 30-month litigation stay is not a failure — it is a structural feature of Hatch-Waxman economics. The investment model must include the stay period in its timeline, and the at-risk launch option should be explicitly modeled for programs where the stay may run to completion with litigation still unresolved.
Complex generic programs at $25 to $50 million in development cost require either larger target markets ($1.5 billion or more) or higher patent challenge success probabilities to produce acceptable risk-adjusted returns. The financial model must reflect the higher development cost floor, not a standard oral solid cost assumption.
Tools like DrugPatentWatch integrate Orange Book data, USPTO records, and ANDA filing intelligence into a single searchable platform, compressing the initial landscape analysis from months to days for portfolio teams screening multiple targets simultaneously.
The investment committee deliverable must include four modeled scenarios (successful Paragraph IV win with no AG, successful win with AG, settlement with date-certain entry, adverse outcome), with explicit probability weights on each, producing a probability-weighted blended NPV as the decision number.
FAQ: Patent Data and Generic Drug R&D Investment
What is the minimum patent analysis required before committing to a generic drug R&D program?
At minimum: a full Orange Book patent enumeration for the target NDA, USPTO cross-reference for PTEs and pending continuations, FDA exclusivity calendar review (NCE, orphan, pediatric), competitive ANDA filer mapping, and a patent-by-patent validity classification (strong/moderate/weak) with rationale. Anything less produces a financial model that is unreliable for a $10 million commitment, let alone $50 million.
How do I find out how many generic companies have already filed ANDAs against a specific drug?
FDA’s Orange Book database and the drugs@FDA portal disclose ANDA applicant status information. DrugPatentWatch aggregates this data alongside litigation status, estimated approval timelines, and settlement intelligence in a single platform. The competitive ANDA count is a direct input to the launch-day market share model.
What is a Paragraph IV certification and why does it matter to generic drug investment decisions?
A Paragraph IV certification is a legal declaration by an ANDA filer that one or more of the brand’s listed Orange Book patents is invalid or will not be infringed by the generic product. Filing a Paragraph IV triggers the brand company’s right to sue within 45 days, which — if exercised — imposes a 30-month stay on FDA approval of the ANDA. The first ANDA filer to submit a substantially complete application with a Paragraph IV certification is eligible for 180-day first-filer marketing exclusivity if their challenge succeeds.
How much does Paragraph IV litigation typically cost a generic company?
Legal costs for a Paragraph IV challenge range from $1.5 million to $10 million per patent case for standard cases, with complex multi-patent litigation against well-resourced brand companies running $20 million to $50 million in total legal fees over a multi-year litigation campaign. For large-market drugs, the litigation cost is typically a small fraction of the potential exclusivity revenue, making the expected-value calculation strongly positive for well-selected targets.
What is an authorized generic and how does it affect first-filer exclusivity economics?
An authorized generic is a version of the brand drug sold by the brand company or its licensee during the first-filer’s 180-day exclusivity period. Because the AG is technically a brand product operating under the brand’s NDA, it does not count as a ‘generic drug’ under the Hatch-Waxman statute and can be marketed during the exclusivity window without triggering the block on other generic approvals. The FTC has documented that AGs reduce first-filer revenue by 40 to 52 percent. No-AG commitments in settlement agreements are the most commercially valuable single term a generic challenger can negotiate.
What is the difference between a patent term extension and pediatric exclusivity?
A Patent Term Extension (PTE) under 35 U.S.C. § 156 compensates a patent holder for the time lost during FDA regulatory review, extending the patent term by up to five years. It applies to the patent itself. Pediatric exclusivity is an FDA market protection period of six months that is added to the end of any patent or FDA exclusivity period when the brand company conducts FDA-requested pediatric studies. Both are listed in the Orange Book and both must be incorporated into the effective exclusivity expiry date used in financial models.
Can a generic company file an ANDA if FDA exclusivity has not yet expired?
An ANDA can be submitted to the FDA after four years of NCE exclusivity have passed, but it cannot be approved until the full five-year exclusivity period expires. For other FDA exclusivities (orphan, pediatric, three-year new formulation exclusivity), the ANDA can be filed at any time but cannot receive final approval until the exclusivity expires. Patent certification and FDA exclusivity are independent — an ANDA filer must clear both before commercial launch is legally available.
What is ‘skinny labeling’ and what are the legal risks after GSK v. Teva?
Skinny labeling is a generic drug strategy where the ANDA filer omits from its product labeling any indication covered by a brand method-of-use patent, thereby carving out the patented indication and avoiding an infringement dispute. Following the Federal Circuit’s 2021 ruling in GSK v. Teva, generic companies using skinny labels face induced infringement risk if their product cartons, marketing materials, or other communications reference the carved-out indication. Post-GSK v. Teva, every piece of commercial communication for a skinny-label generic must be reviewed by patent counsel for induced infringement exposure.
How does the IRA Medicare price negotiation change generic drug R&D investment cases?
IRA negotiated prices reduce the U.S. net revenue base for affected drugs by 50 to 79 percent. For generic investment cases targeting drugs on or near the negotiation selection list, the commercial model must use the post-IRA net price rather than historical WAC. The IRA also reduces the brand’s incentive to defend patents aggressively, since the protected revenue per year of exclusivity extension is lower, which may accelerate settlement timelines and improve generic entry dates.
What is the difference between a complex generic and a standard ANDA, and how does that affect the investment case?
A standard ANDA covers solid oral dosage forms (tablets, capsules) where bioequivalence can be demonstrated through pharmacokinetic testing. Development costs run $1 million to $5 million. A complex generic covers products like inhaled drugs, transdermal systems, injectable emulsions, and ophthalmic suspensions where demonstrating therapeutic equivalence requires product-specific clinical or pharmacodynamic studies. Development costs run $10 million to $50 million, and FDA approval timelines are longer. At these higher development costs, the target market must be larger and the patent challenge success probability higher to produce an acceptable risk-adjusted return.
Where can I find real-time data on generic drug patent expiry, ANDA filings, and Paragraph IV litigation status?
Primary regulatory sources include the FDA Orange Book (updated monthly), USPTO Patent Center for prosecution histories, and PACER for federal court filings. DrugPatentWatch provides an integrated platform that cross-references these sources, tracks Paragraph IV litigation status, settlement date-certain entries, and patent expiry adjustments, and maintains competitive ANDA filing intelligence in a format designed for generic drug portfolio analysis.
Sources
U.S. Food and Drug Administration. (2024). Orange Book: Approved Drug Products with Therapeutic Equivalence Evaluations. FDA. https://www.accessdata.fda.gov/scripts/cder/ob/
Congressional Research Service. (2026, January 21). Patent Listing in FDA’s Orange Book (IF12644). Congress.gov. https://www.congress.gov/crs-product/IF12644
Federal Trade Commission. (2024, April 30). FTC Challenges More Than 300 Junk Patents Listed in the FDA’s Orange Book. FTC.gov. https://www.ftc.gov/news-events/news/press-releases/2024/04/ftc-challenges-more-than-300-junk-patents-listed-fdas-orange-book
Teva Branded Pharmaceutical Products R&D, Inc. v. Amneal Pharmaceuticals of New York, LLC, No. 2024-1936 (Fed. Cir. Dec. 20, 2024).
GSK v. Teva, No. 2018-1976 (Fed. Cir. 2021).
Jazz Pharmaceuticals v. Avadel CNS Pharmaceuticals, No. 2022-1186 (Fed. Cir. 2023).
DrugPatentWatch. (2026, March). The Regulatory Pathway for Generic Drugs: A Strategic Guide to Market Entry and Competitive Advantage. https://www.drugpatentwatch.com/blog/the-regulatory-pathway-for-generic-drugs-explained/
DrugPatentWatch. (2026, March). Generic Drug Cost Optimization: Cut Production Costs, Win Patent Races, and Dominate the Market. https://www.drugpatentwatch.com/blog/how-to-optimize-generic-drug-production-costs-a-guide-to-market-domination/
DrugPatentWatch. (2026, March). The Patent Cliff Playbook: Pharmaceutical IP Valuation, Generic Entry Timing, and Biosimilar Strategy. https://www.drugpatentwatch.com/blog/patent-expirations-seizing-opportunities-in-the-generic-drug-market/
DrugPatentWatch. (2026, March). Drug Patent Expiration: The Complete Strategic Guide to Loss of Exclusivity, Lifecycle Management, and the $400 Billion Cliff. https://www.drugpatentwatch.com/blog/the-impact-of-drug-patent-expiration-financial-implications-lifecycle-strategies-and-market-dynamics/
DrugPatentWatch. (2026, April). Patent Cliff Playbook: How Generic Firms Win $200B in Off-Patent Drug Markets. https://www.drugpatentwatch.com/blog/the-generic-gold-rush-a-strategic-playbook-for-turning-patent-cliffs-into-market-dominance/
DrugPatentWatch. (2026, February). 180-Day Exclusivity: How It’s Triggered and Tracked in the FDA Orange Book. https://www.drugpatentwatch.com/blog/180-day-exclusivity-how-its-triggered-and-tracked-in-the-fda-orange-book/
DrugPatentWatch. (2026, January). Evergreening by Lawsuit: Strategic Patent Actions and Generic Entry Stagnation. https://www.drugpatentwatch.com/blog/evergreening-by-lawsuit-strategic-patent-actions-and-generic-entry-stagnation/
DrugPatentWatch. (2026, March). Drug Patent Evergreening Works, Until It Doesn’t. https://www.drugpatentwatch.com/blog/does-drug-patent-evergreening-prevent-generic-entry/
Association for Accessible Medicines. (2025). 2025 U.S. Generic and Biosimilar Medicines Savings Report. AAM.
Helland, E., & Seabury, S. (2022). Paragraph IV litigation settlement trends in pharmaceutical patent cases. Journal of Law and Economics.
O’Neill Institute, Georgetown University Law Center. (2025, November). Recent Developments in Orange Book Litigation: How Patent Disputes Shape Prescription Drug Affordability. https://oneill.law.georgetown.edu/recent-developments-in-orange-book-litigation-how-patent-disputes-shape-prescription-drug-affordability/
Mayer Brown. (2024, May). US FTC Continues Aggressive Scrutiny of Pharmaceutical Patents Listed in the Orange Book. https://www.mayerbrown.com/en/insights/publications/2024/05/us-ftc-continues-aggressive-scrutiny-of-pharmaceutical-patents-listed-in-the-orange-book
Polsinelli. (2025, January). Court Ruling Alters the Calculus for Orange Book Patent Listings. Life Science Leader. https://www.lifescienceleader.com/doc/court-ruling-alters-the-calculus-for-orange-book-patent-listings-0001
Eckert Seamans. (2025, March). To Be Listable in the FDA’s Orange Book, Patents Must Recite the API in Claims. https://www.eckertseamans.com/legal-updates/to-be-listable-in-the-fdas-orange-book-patents-must-recite-the-api-in-claims
ScienceDirect / Research Policy. (2023). Settled: Patent characteristics and litigation outcomes in the pharmaceutical industry. https://www.sciencedirect.com/science/article/abs/pii/S0144818823000479
DrugPatentWatch. (2025, March). Drug Patent Litigation Costs: The $5M Playbook Pharma Executives Actually Use. https://www.drugpatentwatch.com/blog/managing-drug-patent-litigation-costs/
DrugPatentWatch. (2026, March). Pharma Profitability After Drug Patents Expire: The Complete Strategy Guide. https://www.drugpatentwatch.com/blog/top-strategies-for-pharma-profitability-after-drug-patents-expire/
DrugPatentWatch. (2026, March). Generic Drug Development Timelines: The Definitive Playbook for Faster ANDA Approval. https://www.drugpatentwatch.com/blog/how-to-manage-generic-drug-development-timelines-strategies-for-successv/