Biotech IPOs are uniquely dangerous investments, and not for the reasons most investors spend time worrying about.
Clinical failure risk gets the headlines. A Phase III trial reads out negative, the stock drops 70 percent overnight, and the story writes itself. Investors understand that risk intellectually, even if they do not always price it correctly. What they understand far less — and what the investment banks structuring biotech IPOs have very little incentive to make transparent — is that a substantial proportion of biotech IPO value rests on a patent foundation that has never been independently examined by anyone in the investment chain.
The company’s lawyers reviewed the patents. The underwriters asked general questions about IP ownership. The S-1 prospectus contains risk factor disclosures that are largely standardized boilerplate, legally drafted to satisfy disclosure requirements without actually communicating specific patent vulnerabilities. And then the stock starts trading.
Between 2018 and 2023, more than 400 biotech companies completed IPOs on U.S. exchanges, raising over $95 billion in aggregate proceeds [1]. A meaningful subset of those companies have subsequently disclosed patent ownership disputes, received inter partes review (IPR) petitions challenging their core technology patents, or discovered that a blocking third-party patent stands between their lead compound and commercialization. In several high-profile cases, these patent problems were discoverable from public records before the IPO closed. Nobody looked.
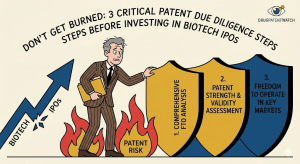
This article is for investors, fund managers, and analysts who want to look. It covers three due diligence steps that should precede any substantial biotech IPO investment: mapping the complete patent estate, stress-testing the patent timeline against the clinical development schedule, and evaluating litigation exposure and third-party blocking risk. Each step draws on publicly accessible records and, for pharmaceutical products, structured databases like DrugPatentWatch that aggregate patent, regulatory exclusivity, and litigation data in formats that make systematic pre-investment review practical.
The three-step framework will not eliminate investment risk. Clinical development remains uncertain regardless of patent strength. But it will identify the specific subset of IPOs where the patent foundation is weak, contested, or structurally mismatched with the company’s commercial timeline — and where investors are pricing in exclusivity they are unlikely to receive.
Why Biotech IPO Valuations Are Built on Patent Sand
The standard justification for biotech pre-revenue valuations runs roughly as follows: the company has identified a promising drug target, it has generated early clinical data suggesting efficacy, it holds a patent position covering the compound or technology, and the discounted value of future cash flows from a successfully commercialized product justifies a current valuation of X. The patent position is structural to this logic. Without it, the company is one successful imitator away from having no durable competitive advantage.
The problem is that “holding a patent position” covers an enormous range of actual IP strength. At one extreme, a company might hold a granted U.S. patent with broad independent claims covering a novel chemical genus, no pending prior art challenges, foreign counterparts granted and validated in the top revenue markets, and a term that extends well beyond the expected commercialization date. At the other extreme, a company might hold a single U.S. patent with narrow claims that cover only a specific synthesis route, a PTAB petition pending that has already been instituted, no foreign counterparts, and a term that will expire before Phase III trials complete.
Both of these companies, described in a biotech S-1, would say they “hold patents covering their lead compound.” The valuations that flow from these two positions are radically different. The disclosures that appear in IPO prospectuses are almost never specific enough to distinguish between them.
The Structural Information Asymmetry
The company going public knows exactly what its patent position looks like. Its patent counsel has reviewed the prosecution history, mapped the claims against the commercial product, identified the most relevant prior art, and formed a view about invalidity risk. That analysis is almost never disclosed to public investors.
SEC disclosure requirements for biotech companies mandate disclosure of material risks, including those related to intellectual property. But the standard is materiality, not transparency, and the legal advice companies receive on what is “material” creates disclosures that are simultaneously technically accurate and substantively uninformative.
The typical biotech S-1 patent risk factor disclosure includes language stating that patents may be challenged, that the company cannot guarantee patent validity, that competitors may design around existing patents, and that the company may need to obtain licenses from third parties. Every single one of these statements is true for essentially every biotech company. They convey no information about whether the specific patents in question are strong or weak, broad or narrow, challenged or unchallengeable.
Investors who read these disclosures and conclude “patents are fine because the risk factors are standard boilerplate” are making a systematic error. The boilerplate is designed to satisfy disclosure requirements. It is not designed to communicate actual patent quality.
The University License Chain Problem
A significant proportion of biotech IPOs are based on technology licensed from academic institutions. The Bayh-Dole Act of 1980 [2] gave universities the right to commercialize federally funded research, creating a generation of technology transfer offices that license early-stage discoveries to startup companies in exchange for equity, royalties, and milestone payments.
This structure introduces a layer of complexity that rarely appears in adequate detail in IPO disclosures. The biotech company going public may not own its foundational patents at all — it may hold an exclusive license from MIT, Stanford, the University of California system, or another research institution. The scope of that license, its geographic coverage, the sublicensing restrictions it imposes, and the conditions under which it could be terminated are all commercially material variables that affect the actual value of the company’s IP position.
University licenses for pharmaceutical applications typically contain:
Diligence milestones — requirements that the licensee achieve specific development benchmarks on defined timelines, with license termination as the remedy for failure.
Field-of-use restrictions — limitations on which therapeutic indications or product categories the license covers, leaving adjacent applications available for the university to license to competitors.
Revenue sharing obligations — royalty rates and milestone payments that reduce the net economic value of commercialization, sometimes to an extent that makes specific revenue targets economically marginal.
March-in rights — the federal government’s right under the Bayh-Dole Act to require the licensing of federally funded patents to third parties if the technology is not being commercialized adequately or if action is needed to address health or safety needs [3].
March-in rights have been the subject of significant policy debate, particularly regarding their potential application to high-priced pharmaceuticals. Though no march-in petition has yet succeeded in forcing a compulsory license, the Biden Administration’s 2023 Framework on Use of March-In Authority signaled an intent to use the mechanism more aggressively [4], creating a new category of policy risk for biotech IPOs built on federally funded university technology.
Investors evaluating a biotech IPO built on licensed technology need to understand the complete license terms — not just the fact of the license — before committing capital. This information is often partially or wholly omitted from S-1 disclosures, even though it is material to valuation.
Step 1: Map the Complete Patent Estate Before the Prospectus Closes
The first step in biotech IPO patent due diligence is constructing an accurate, complete map of what patents and patent applications the company actually holds or controls, and what those patents actually cover.
This sounds obvious. It is routinely skipped.
Reading the S-1 Patent Section Properly
Every biotech S-1 includes a section describing the company’s intellectual property. It will list the approximate number of patents and patent applications owned or licensed, describe the general subject matter of the patents in broad terms, and state the general expiration dates of key patents.
Read these disclosures as a starting point, not a conclusion. The specific variables that matter — claim breadth, prosecution history, priority date, continuation filing status, geographic counterpart existence — almost never appear in the S-1 itself. What the S-1 gives you is the minimum information needed to begin an independent search.
The S-1 typically identifies the company’s patent portfolio by either patent numbers or by description. Where patent numbers appear in the filing, each one is publicly accessible through the USPTO’s Patent Full-Text Database, which is freely available and searchable at patents.google.com or through the official USPTO search portal. Where descriptions appear without numbers, the company name is sufficient to run an assignee search that will surface granted patents and published applications.
For biotech companies built on licensed university technology, the S-1 will typically identify the licensing institution and the general subject matter. With that information, the relevant issued patents and applications can be found by searching the university as assignee in the USPTO database, then filtering for the identified inventor names and technology area.
The Patent Family Structure Audit
A single drug compound is typically protected by multiple related patents that form a family. The family originates from a single earliest-priority application and branches into continuations, divisionals, continuation-in-part applications, and international counterparts. Each family member has a distinct set of claims, a distinct prosecution history, and a distinct remaining term.
The family structure analysis for a biotech IPO examines three specific questions that determine how robust the IP foundation actually is:
First, does the earliest priority application contain adequate written description support for the commercial embodiment? The written description requirement under 35 U.S.C. § 112 [5] requires that the specification disclose the claimed invention with sufficient detail that a person skilled in the art could make and use it. In biotech, this requirement has been actively enforced against overly broad claims not supported by the disclosure. The Federal Circuit’s decision in Idenix Pharmaceuticals LLC v. Gilead Sciences Inc. [6] invalidated compound claims in nucleoside patents for lack of written description, illustrating the specific risk that early-stage biotech patents with expansive original claims face when their specification was written before the chemistry was fully worked out.
Second, are there pending continuation applications that can be amended to more squarely cover the commercial embodiment as development progresses? A patent family with multiple pending applications provides strategic flexibility. If the commercial embodiment drifts from the claims of issued patents during development — as often happens in pharmaceutical development as formulation and dosing are refined — pending continuations can be prosecuted to specifically cover the commercialized form. A company with no pending applications is working from a fixed patent position that may not align with its commercial product by the time it reaches market.
Third, do the granted foreign counterparts cover the markets that justify the projected revenue? For a drug intended for U.S. and European commercialization, the minimum adequate geographic coverage includes a U.S. patent, a granted European patent validated in the major EU markets, and pending or granted applications in Japan and China. For orphan disease drugs where global commercialization is central to the economic thesis, coverage gaps in specific markets can represent material unprotected revenue.
The European Patent Office’s public register, accessible at epo.org, shows the filing, prosecution, and opposition status of European patent applications and granted patents. The Japan Patent Office’s J-PlatPat database provides equivalent information for Japanese filings. China’s CNIPA database covers Chinese applications and grants. None of these require subscription fees or special access — they are public infrastructure that investors can use directly.
Freedom-to-Operate: The Question the S-1 Will Never Answer
Owning a patent does not mean you have the right to make, use, or sell the patented product. That right is the province of freedom-to-operate (FTO) analysis, which asks whether making, using, or selling a specific product would infringe any valid, unexpired patent held by a third party.
FTO analysis is legally and technically demanding, but the basic screening version is accessible to any sophisticated investor who is willing to spend time with patent databases.
The starting point is identifying the relevant chemical or biological target and compound class. For small molecule drugs, this typically means searching the USPTO database for patents claiming the specific compound (its composition of matter), related structural analogs, and the mechanism of action or target binding activity. For biologics, it means searching for patents claiming the biological target, the antibody binding region, and the production or manufacturing platform.
The critical question is whether any third-party patent in this landscape contains claims that would be infringed by the company’s product as currently being developed. Infringement is assessed on a claim-by-claim basis: every element of at least one patent claim must be present in the accused product for that claim to be infringed. A product infringes a patent if it meets every limitation of a single claim; it does not infringe if it is missing any one limitation.
For pre-investment FTO screening purposes, investors do not need a full legal opinion — they need to identify whether the patent landscape contains obvious blocking candidates worth investigating further with counsel. Red flags include:
Granted patents held by well-resourced competitors with claims covering the general compound class or mechanism of action, filed before the biotech’s priority date.
Patents held by non-practicing entities (patent assertion entities) in the relevant technology space, which signal that the space has been identified as commercially significant and that licensing demands are probable.
University patents in the relevant technology area that are licensed non-exclusively or unlicensed, which could create a blocking position if a competitor in-licenses the university patent. <blockquote> “According to analysis of USPTO records by the National Academies of Sciences, Engineering, and Medicine, the average pharmaceutical compound reaching commercialization is covered by 14 distinct third-party patents in relevant technology areas, excluding the developer’s own portfolio — any of which could, in principle, create an infringement position requiring licensing.” [7] </blockquote>
The FTO screening process for a biotech IPO investment should be completed before the lock-up period expires, not after. The single most common investor mistake in biotech IPO due diligence is treating FTO as a post-investment concern — something the company’s lawyers will figure out during commercialization. By that point, the leverage for negotiating a favorable license has evaporated, and the cost of a blocking patent has become the cost of either a compulsory license on the licensor’s terms or a redesigned compound that requires new clinical trials.
Blocking Patents and Design-Around Economics
When a pre-investment FTO screen identifies a potential blocking patent, the analytical question shifts to design-around economics: what would it cost the company to redesign its product to avoid the blocking claims, and how would that redesign affect the clinical development timeline?
Design-around economics vary enormously by product type and blocking claim scope. A blocking patent on a specific synthesis route for a small molecule drug may present a relatively low design-around cost if an alternative synthesis route is available — additional chemistry work and perhaps a CMC amendment to the IND or NDA, but no change to the drug itself. A blocking patent on the binding epitope of a therapeutic antibody, however, may require developing an entirely different antibody targeting a different epitope, potentially abandoning years of prior clinical work.
Investors evaluating a biotech IPO with potential blocking patent exposure should quantify design-around economics in terms of: additional R&D cost to implement the design-around, additional time to clinical milestones that the design-around would require, and probability that the design-around product would have equivalent efficacy and safety to the original compound (relevant where the blocking claim covers a structurally important feature).
Where design-around is impractical or prohibitively expensive, the alternative is licensing, and the leverage in that negotiation depends almost entirely on when the licensing conversation begins. A company approaching a blocking patent holder before it has committed $200 million in clinical development to the blocked compound has real alternatives. The same company approaching after a Phase III investment has none.
The Freedom-to-Operate Opinion Letter Standard
In the context of a biotech IPO, serious institutional investors sometimes request that the company provide a freedom-to-operate opinion letter from independent patent counsel addressing specific third-party patents identified in the FTO screening. These letters are not infallible — patent opinions can be wrong, and willful infringement requires only that the infringer knew of the patent — but they represent a higher standard of diligence than the company’s own assessment.
An FTO opinion letter from independent outside counsel, specifically addressing the most significant potential blocking patents identified in the landscape, is a positive quality signal in a biotech IPO. Its absence, where the patent landscape contains obvious blocking candidates, is a negative signal that warrants either deeper investigation or a commensurate discount to the investment thesis.
Companies that have obtained FTO opinions but declined to disclose them — a common situation where counsel advice is treated as privileged — should be asked directly whether opinions exist and what scope they cover. The refusal to confirm the existence of any FTO opinion, combined with a crowded patent landscape, is a specific red flag.
Step 2: Stress Test the Patent Timeline Against the Clinical Development Schedule
The second critical due diligence step addresses one of the most underappreciated structural risks in biotech investing: the possibility that a company’s core patents will expire before its drug reaches commercialization.
This risk is entirely visible from public records. It is routinely ignored.
The Fundamental Mismatch Problem
The U.S. patent system grants a 20-year term measured from the earliest effective filing date of the patent application [8]. Biotech companies typically file their foundational patents early in the research process — often when a compound class is first identified, long before clinical development begins. The priority date of a biotechnology patent on a drug compound is frequently 10 to 15 years before the drug could realistically reach market.
A patent filed in 2010 on a compound that entered Phase I in 2018, completed Phase III in 2022, and received FDA approval in 2024 expires in 2030 — leaving six years of market exclusivity. That six-year runway is meaningful, but it is not the multi-decade exclusivity that blockbuster drug economics require.
Now adjust for the biotech IPO context. A company files patents on a discovery in 2012. It spends five years in early research and IND-enabling studies. It files for IPO in 2018 with Phase I data, at which point its foundational patent term is already half-consumed. If Phase II and Phase III trials take the seven years that is roughly average for oncology indications [9], the drug reaches market in 2025 with a compound patent expiring in 2032 — seven years of protection, likely extendable to twelve with a Patent Term Extension.
That twelve-year runway sounds adequate. But twelve years from approval is not the right unit of analysis for biotech IPO valuation. The right unit is the number of years of patent-protected revenue that can actually be modeled with reasonable confidence, discounted to the date of the IPO investment. At a biotech IPO valuation of $500 million for a company whose compound patent will expire seven years post-approval, and assuming three years to approval from the IPO date, investors are paying today for ten years of future exclusivity. The probability-weighted present value of those ten years of exclusivity needs to exceed the IPO price for the investment to make financial sense on IP terms alone.
Patent Term Calculation for Biotech Assets
Before stress testing the timeline, investors need to calculate the actual patent term remaining for the company’s core patents, accounting for all applicable adjustments.
Patent Term Adjustment compensates patent holders for USPTO examination delays under 35 U.S.C. § 154(b) [10]. PTA is calculated using a complex formula that accounts for periods when the USPTO failed to meet its own examination deadlines, reduced by periods of applicant delay. For biotechnology patents, which frequently involve complex technical subject matter and lengthy prosecution histories, PTA of one to four years is common.
PTA is granted automatically by the USPTO and is printed on the face of issued patents, but its calculation can be contested. Generic manufacturers and IPR petitioners have successfully challenged PTA calculations in district court proceedings, and the resulting term reductions have been commercially significant. For pre-investment analysis, investors should verify that the PTA printed on key patents was correctly calculated — the USPTO’s Patent Term Calculator tool (available through the agency’s website) provides an independent check.
Patent Term Extension under 35 U.S.C. § 156 compensates pharmaceutical patent holders for time lost to FDA regulatory review [11]. The maximum PTE is five years, capped to leave no more than 14 years of patent term post-approval. For a biotech company at IPO with a drug still in clinical trials, PTE is a future entitlement rather than a current fact — but it should be factored into the patent timeline projection as a positive modifier.
One critical limitation: only one patent per drug product is eligible for PTE. The strategy of which patent to extend — compound, formulation, method of treatment — can significantly affect the total protected revenue period, and that choice is not made until after FDA approval. In a pre-IPO analysis, investors should map which patent would be the optimal candidate for PTE and calculate the extended term accordingly.
Priority Date Verification
The effective priority date of a patent claim determines its term and its entitlement to its earliest filing date as the reference point for prior art. In biotech, priority date questions are frequently the technical battleground of invalidity disputes, and priority date disputes have collapsed IPO investment theses in ways that were entirely foreseeable from public records.
The CRISPR patent dispute between the University of California (UC Berkeley) and the Broad Institute of MIT and Harvard is the most extensively documented recent example. The foundational CRISPR-Cas9 patents filed by Jennifer Doudna and Emmanuelle Charpentier at UC Berkeley, and the competing patents filed by Feng Zhang at the Broad Institute, were the subject of protracted interference and derivation proceedings before the USPTO and multiple Federal Circuit appeals [12].
Multiple biotech companies that went public based on licensing from one side or the other of this dispute carried significant unpriced patent risk during the period when priority was genuinely uncertain. Companies with UC Berkeley licenses faced the risk that Broad Institute patents might be established as prior with broader claims. Companies with Broad Institute licenses faced the inverse risk. In both cases, the priority dispute was a matter of public PTAB record — documented in interference petitions, trial briefs, and PTAB decisions that were publicly accessible throughout the dispute — but rarely surfaced in investor analyses.
For pre-investment due diligence, investors should verify that the company’s key patents have clear, uncontested priority dates by checking:
Whether any interference or derivation proceedings have been filed in the USPTO’s PTAB system involving the relevant patents or their predecessors.
Whether the S-1 identifies any priority date disputes in the risk factors section.
Whether the scientific literature contains publications by competing research groups describing similar discoveries prior to the company’s filing date, which could support prior art arguments or priority challenges.
The USPTO’s PTAB interface maintains a searchable public database of all interference, derivation, IPR, and PGR proceedings. Searching by assignee name or patent number for any company whose IP is being evaluated takes less than ten minutes and will surface any active or past proceedings, including any that were settled or terminated before a final decision.
The Regulatory Exclusivity Overlay
Beyond patent term, pharmaceutical biotech products can obtain regulatory exclusivity from the FDA that prevents competing applications from being approved for defined periods, independent of patent status. These exclusivity periods can extend effective market protection well beyond what patent term alone would provide, and they are commercially material inputs to IPO valuation models.
For a biotech IPO investor, the relevant exclusivity types and their likely applicability depend on the drug category:
New Chemical Entity exclusivity protects small molecule drugs approved for the first time with a previously unapproved active moiety. It runs five years from approval and prevents ANDA submission during that period, with a four-year submission right for Paragraph IV filers [13]. For a small molecule biotech drug, NCE exclusivity effectively adds five years of market protection post-approval regardless of patent term status.
Biologic exclusivity under the Biologics Price Competition and Innovation Act provides 12 years of exclusivity from the date of first approval for reference biological products, plus a four-year exclusivity period preventing biosimilar application submission [14]. For a biotech company developing a novel biological entity, this 12-year exclusivity is frequently more valuable than the compound patent, which may have substantial term remaining when biosimilar competition could otherwise arrive.
Orphan Drug Designation exclusivity provides seven years of market exclusivity after approval for drugs treating diseases affecting fewer than 200,000 persons in the United States [15]. For biotech companies pursuing rare disease indications — which represents a majority of current biotech pipeline strategy — Orphan Drug Designation exclusivity is a central pillar of the IP defense strategy. It requires active monitoring because the FDA can revoke orphan exclusivity under specific circumstances, and the designation can be challenged by competitors who contest the patient population estimates underlying the qualifying disease prevalence claim.
Orphan Drug Designation as a Valuation Modifier
In biotech IPO models, Orphan Drug Designation is frequently cited as a value-positive factor without adequate scrutiny of whether the designation is actually protected. The specific risks to ODD exclusivity that investors should assess include:
Whether the disease indication qualifies legitimately as affecting fewer than 200,000 U.S. patients — FDA has revoked ODD in cases where the prevalence estimate was subsequently found to be overstated.
Whether the ODD covers the specific indication being developed, or a broader class of diseases that does not correspond precisely to the clinical development program.
Whether a competitor has already received ODD for the same indication with the same active moiety — because the FDA’s orphan exclusivity provision protects only the first approved orphan product, and a competing ODD holder who wins the FDA approval race bars the second applicant from relying on their own ODD.
For pharmaceutical biotech products, DrugPatentWatch tracks Orphan Drug Designation grants and the associated FDA exclusivity periods, enabling investors to verify ODD status and identify competing designations in the same indication without manually searching the FDA’s orphan products database.
Breakthrough Therapy Designation and Exclusivity Timing
Breakthrough Therapy Designation (BTD) does not itself confer exclusivity, but it has a significant indirect effect on the patent term/exclusivity equation: it substantially accelerates FDA review, which means the drug reaches market sooner and patent term consumption during review is reduced [16].
A biotech IPO company with BTD for its lead compound has, in effect, a shorter regulatory review period to model. This improves both the PTE calculation (less time consumed in review means less PTE needed to reach 14 post-approval years of protection) and the cash flow projection (earlier revenue onset). Investors should verify BTD status in the FDA’s public database and understand which specific indication and clinical development stage the designation covers, since BTD is indication-specific and does not transfer automatically to label expansions.
Step 3: Evaluate Litigation Exposure and Enforceability Risk
The third due diligence step examines the probability that the company’s key patents will be challenged after IPO and what the outcomes of those challenges are likely to be.
This step is particularly critical for biotech IPOs because patent challenges arrive on a different timeline than clinical development milestones. A company can complete Phase III trials successfully and file an NDA with entirely valid patent protection, and then face a well-resourced IPR petition the day after the NDA is approved — beginning a PTAB proceeding that may take 12 to 18 months to resolve, during which the commercial position of the approved drug faces uncertainty.
IPR Petition Probability Assessment
Since the America Invents Act of 2011 established inter partes review, pharmaceutical and biotech patents have faced IPR petitions at higher rates than most other technology sectors [17]. The petitioners are typically generic manufacturers for pharmaceutical compound patents, or technology competitors for platform technology patents in diagnostics and biological manufacturing.
For a biotech IPO investment, the question is: what is the probability that the company’s key patents face an IPR petition within the next three to five years?
The answer is not unknowable. IPR petition probability is substantially elevated when:
The patent covers a commercially important compound or technology in a field with multiple well-funded competitors who have economic incentives to destabilize the IP position.
The patent has broad independent claims that, if valid, would block competitors from entering the relevant market.
The patent has a prosecution history with close prior art references that the examiner distinguished but that might be reargued before the PTAB.
The patent was filed with priority to a specific country and then nationalized in the U.S. under the Paris Convention or as a PCT national phase entry, which can create priority date vulnerabilities if the national phase application claims differ from the original filing.
Conversely, IPR petition probability is lower when the patent covers a narrow or specialized technology with few well-resourced competitors, when the claims were carefully written around the known prior art, and when the prosecution history contains no close calls that a petitioner could reargue credibly.
Investors can estimate IPR petition probability by examining the patent landscape for comparable technologies and the prior petition history of likely petitioners. A generic pharmaceutical company that has filed IPR petitions against ten different compound patents in a therapeutic class over five years is a highly probable petitioner against any new compound patent in the same class. PTAB’s public docket, searchable by petitioner name, makes this pattern analysis straightforward.
Analyzing PTAB Institution Rates and Outcome Distributions
Once an IPR petition is filed, institution is granted when the petition demonstrates a “reasonable likelihood” that the petitioner would prevail on at least one challenged claim [18]. As of 2023, the PTAB institution rate for pharmaceutical and biotech patents is approximately 58 percent, meaning that roughly six out of ten petitions filed pass the threshold for full trial [19].
Of petitions that are instituted, the PTAB’s track record in pharmaceutical and biotech cases shows:
Complete cancellation of all challenged claims in roughly 30 percent of final written decisions.
Cancellation of some but not all challenged claims in approximately 20 percent of cases.
Confirmation of all challenged claims in approximately 35 percent of cases.
The remaining roughly 15 percent of instituted proceedings are settled or terminated before final written decision, typically through licensing agreements whose terms are not publicly disclosed [20].
These statistics calibrate the invalidity risk associated with a biotech company’s patent position. If a company’s primary patent faces a plausible IPR petition, and the petition presents close prior art, investors should model a substantial probability that the patent is invalidated or narrowed — not as a worst case, but as a realistic scenario for sensitivity analysis.
For pre-IPO pharmaceutical biotech companies with licensed patents, DrugPatentWatch provides data on whether the licensed patents have previously faced IPR challenges, whether any claims were cancelled in prior proceedings, and what prior art the PTAB considered. This historical challenge data is materially relevant to the forward-looking IPR risk assessment for the licensed assets.
Third-Party Patent Landscaping: Finding the Blockers
The most underperformed diligence step in biotech IPO analysis is the systematic search for third-party patents that could block commercialization. This is not a search for published prior art — it is a search for currently active, unexpired patents with claims that would be infringed by the company’s product if commercialized.
A third-party blocking patent is different from invalidating prior art. Prior art, if publicly disclosed before the priority date, can be used to invalidate the company’s patents. A blocking patent does not affect the validity of the company’s patents — it independently prevents the company from commercializing without either a license or a court ruling of non-infringement.
The landscape search process for pre-IPO diligence focuses on:
The molecular target or mechanism of action: Are there granted, unexpired patents covering the specific protein, receptor, ion channel, or genetic target that the company’s drug is designed to modulate? Platform patents covering a biological target can be remarkably broad, particularly if filed when the target was first characterized and the claiming strategy was accordingly expansive.
The compound class or structural scaffold: Are there granted, unexpired patents covering the specific structural class (e.g., a specific kinase inhibitor scaffold, a specific antibody framework, a specific nucleoside analog backbone) that the company’s compound falls within?
The manufacturing or production platform: For biologics, are there granted patents covering the specific cell line, bioreactor system, or purification method that the company intends to use in manufacturing? Platform technology patents from companies like Lonza, WuXi Biologics, or Samsung Biologics cover specific manufacturing approaches that drug developers may rely on through CDMO relationships.
The results of this landscape search should be evaluated by experienced patent counsel, but the initial screening is accessible to analytically sophisticated investors. Google Patents provides free, searchable access to the full text of USPTO patents and applications, and its landscape and assignment mapping tools allow visualization of how patents in a specific area relate to each other over time.
University Licensing Chains and Their Complications
For biotech companies whose technology originates from academic institutions — which covers a majority of currently active early-stage biotech — the patent landscape includes not just the company’s owned and licensed patents but the upstream institutional IP from which those patents derive.
The complications that arise from university license chains are numerous and specific:
License scope limitations: A university license may cover only specific fields of use, leaving adjacent therapeutic applications available for competitors to license separately. A company licensed to develop a technology for oncology applications, for example, may find that the same underlying university patent is licensed to a competitor for autoimmune applications — and that the competitor’s clinical experience in adjacent indications could inform competitive entry once the compound class is validated.
Sub-licensing and co-development restrictions: University licenses frequently restrict sub-licensing without the licensor’s consent. This limitation affects the company’s ability to enter into co-development agreements, licensing deals with larger pharmaceutical companies, or collaboration arrangements that involve transferring IP rights. For a biotech company whose IPO strategy anticipates a licensing partnership as the primary revenue event, hidden sub-licensing restrictions represent a material risk.
Diligence milestones and their clinical development alignment: University licenses include diligence milestones requiring the licensee to achieve specified development benchmarks — IND filing, first-in-human dosing, Phase II commencement, NDA submission — by specified dates. These milestones are negotiated based on expected timelines, but clinical development is notoriously uncertain. A company that falls behind its clinical timeline by 24 months due to clinical hold, enrollment difficulties, or regulatory questions may find its license at risk of termination for milestone failure, a risk that is rarely disclosed in adequate detail in biotech S-1 filings.
Investors should request that the company confirm the specific milestone dates and their alignment with the clinical development timeline projected in the IPO. Where the projected timeline is tight relative to the license milestones, this represents a material license termination risk that should be factored into the investment analysis.
March-In Rights Under Bayh-Dole
The federal government’s march-in rights under the Bayh-Dole Act are a background risk for any biotech company whose technology derives from federally funded research — which includes most technology originating from U.S. universities.
March-in rights allow the National Institutes of Health or other funding agencies to require the patent holder or exclusive licensee to grant licenses to the invention to responsible applicants, on reasonable terms, under defined circumstances including failure to achieve practical application of the invention, action required to alleviate health or safety needs, or preference for U.S. manufacturing [21].
The Biden Administration’s 2023 Framework on Use of March-In Rights explicitly stated that “unreasonable pricing” of a drug could trigger consideration of march-in authority — a significant expansion of the historically narrow interpretation of the march-in criteria [22]. This framework has not yet been applied to force a compulsory license, but it creates a specific category of policy risk for biotech IPO companies developing high-priced specialty drugs based on federally funded technology.
For pre-investment analysis, investors should identify whether the company’s core technology originated from federally funded research and whether the resulting patents are subject to Bayh-Dole obligations. This information is available from the company’s issued patents, which must acknowledge federal funding in the government rights statement that appears on the face of the patent, and from the NIH’s iEdison database, which tracks reporting of federally funded inventions [23].
Sublicensing Restrictions and Revenue Sharing
Where a biotech company’s patent position rests on a university license, the financial terms of that license affect the net economic value of commercialization and should be explicitly factored into pre-IPO modeling.
University license royalty rates for pharmaceutical applications typically range from 2 to 5 percent of net product sales, with additional milestone payments at specified development events [24]. For a drug with projected peak revenues of $500 million, a 3 percent royalty rate reduces annual net patent-period revenue by $15 million — enough to be material in a discounted cash flow model but small enough to be easily overlooked.
The more significant financial complication arises where the university license requires royalty stacking — payments on the same revenue stream to multiple licensors whose patents all contribute to the commercialized product. In biotech, where complex biological products may require technology from multiple foundational patent holders, royalty stacking can accumulate to rates that substantially erode commercial margins.
Investors should map all license obligations bearing on the company’s lead product and calculate the total royalty burden as a percentage of projected net revenues. Where the S-1 does not disclose sufficient license terms to complete this calculation, the company should be asked directly about the aggregate royalty burden, and refusal to answer should be treated as a negative signal.
What the S-1 Patent Risk Disclosures Actually Say vs. What They Mean
Having outlined the three due diligence steps, it is useful to examine how they interact with the actual disclosure language investors receive in biotech S-1 filings. The translation from legal boilerplate to investment-relevant information is not automatic.
Decoding Standard Risk Factor Language
The following are real categories of risk factor language that appear in virtually every biotech S-1, accompanied by the investment-relevant interpretation that due diligence can produce.
“We may not be able to obtain patent protection for our product candidates or our competitors may successfully challenge the validity or enforceability of our patents.” This is true of every biotech company and conveys no information about whether this specific company’s patents are likely to be challenged. Meaningful diligence replaces this general statement with a specific assessment of whether likely challengers have the prior art and economic incentive to file.
“Our intellectual property rights may not provide meaningful protection of our product candidates, and we may not be able to develop novel products or technologies without infringing the proprietary rights of others.” This statement describes FTO risk in general terms. It does not confirm or deny that a specific FTO analysis has been conducted, what it found, or whether specific blocking patents have been identified and addressed. Ask directly: “Has the company obtained a freedom-to-operate opinion? What patents did the opinion address? Is the opinion current with respect to the latest compound structure being taken into the clinic?”
“If we are unable to obtain and maintain patent protection for our product candidates, or if the scope of the patent protection is not sufficiently broad, our competitors may develop and commercialize products similar or identical to ours.” This is a generic commercial competition risk statement that does not address the specific facts of the patent position. Meaningful diligence examines the actual claim scope of the key patents and assesses whether that scope is broad enough to prevent competitive products.
“We may become a party to patent litigation or other proceedings.” This describes the universe of possible IP disputes. The relevant specific question is: are any proceedings currently pending? Have any demands, cease-and-desist letters, or licensing requests been received from third parties? The S-1 is required to disclose material pending legal proceedings, but threshold questions about pre-litigation communications are not always captured.
Identifying Material Omissions
Beyond the affirmative disclosures, the most important analytical step in S-1 review is identifying what is not disclosed. Material omissions in biotech S-1 patent disclosures include:
The specific claim scope of key patents, compared to the commercial product as currently specified.
The existence and status of PTAB petitions filed after the priority date of key patents but before the IPO date. These should appear in PTAB’s public docket and, if material, should be disclosed as risk factors. Their absence from the S-1 combined with their presence in the PTAB docket is a significant red flag.
The specific diligence milestones and termination provisions of university licenses, where the license covers the primary commercial asset.
The existence of third-party demand letters or licensing requests related to the product technology, even if the company has concluded they are without merit.
The aggregate royalty burden from all licenses bearing on the lead product’s commercialization.
Reading the Underwriters’ Legal Opinion
Every biotech IPO prospectus includes opinions from underwriters’ counsel confirming that specific disclosure requirements have been satisfied. These opinions are not patent validity opinions and should not be read as such. Underwriters’ counsel does not assess whether the company’s claims are broad, whether the prosecution history is clean, or whether a viable blocking patent exists in the field. Their mandate is securities disclosure compliance, not IP quality assessment.
Investors sometimes make the error of treating the absence of a negative disclosure in a legally reviewed IPO prospectus as a positive signal about patent quality. The correct reading is more limited: the S-1 says what the company’s lawyers concluded was required to be disclosed under securities law. Everything else requires independent investigation.
The specific elements of patent disclosure that underwriters’ counsel does scrutinize — whether any material pending legal proceedings have been identified, whether the company believes it has the rights necessary to operate its business — are described at the level of the company’s own belief, not at the level of independent verification. “The company believes it holds sufficient IP rights to conduct its business as currently conducted” is a representation of management’s belief, not a legal confirmation that no blocking patent exists.
Comparing Prospectus Claims to Scientific Literature
One underused but powerful technique for pre-investment patent assessment is comparing the patent claims to the contemporaneous scientific literature published by the company’s researchers. Academic papers documenting drug discovery results are almost always published after, or concurrent with, patent filings on the same subject matter. Reading the papers alongside the patents reveals two things:
Whether the patent claims are actually aligned with the scientific advance that the papers describe. Discrepancies — where the patents claim broad genus coverage but the papers describe results for specific compounds — signal either deliberate overreaching in the patent claims or a disconnect between the discovery team’s scientific understanding and the patent strategy.
Whether competing research groups published similar results around the same time, which can create prior art risks or priority disputes that were not reflected in the S-1 disclosure.
PubMed and Google Scholar provide free access to the scientific literature, and cross-referencing the publication dates and results against the patent priority dates is a meaningful additional diligence step for technology-intensive biotech IPOs.
The 10-K vs. S-1 Patent Disclosure Gap
For investors evaluating biotech companies that completed their IPO in a prior period and are now reviewing a secondary offering or a lock-up expiration purchase decision, there is an often-underappreciated disclosure gap between the original S-1 and subsequent annual reports. The Form 10-K that public biotech companies file annually is subject to the same materiality standard for IP disclosure as the S-1, but it also contains information that was not available at IPO — including any PTAB petitions filed since the offering, any Paragraph IV certifications received, and any licensing disputes that arose post-offering.
Reading the three most recent 10-K filings from a biotech company alongside the original S-1 provides a longitudinal view of how the patent situation has evolved and whether risks that were described in vague terms at IPO have crystallized into specific proceedings or threats. Comparing the IP risk factor language between filings for changes in specificity — new disclosures of specific patents being challenged, new acknowledgments of third-party licenses that may be required — is a practical technique for identifying material patent developments that occurred between annual filings.
Case Study: Moderna’s Patent Disputes With the NIH
The Moderna mRNA technology dispute illustrates precisely the kind of patent complexity that sophisticated biotech IPO due diligence should surface — and that standard S-1 disclosures almost never adequately address.
Moderna completed its IPO in December 2018, raising approximately $604 million [25]. The company’s valuation rested substantially on its proprietary mRNA platform technology, protected by a portfolio of patents on mRNA modification chemistry, lipid nanoparticle delivery systems, and manufacturing processes.
What the IPO-era disclosures did not make fully transparent was the contested ownership question involving the NIH. Three NIH researchers — Barney Graham, Kizzmekia Corbett, and John Cobb — contributed to the specific mRNA sequence design underlying the COVID-19 vaccine (mRNA-1273) that became Moderna’s most commercially significant product. In November 2021, the NIH filed a formal inventorship dispute, asserting that its researchers were co-inventors of a key patent application covering the spike protein stabilization technology [26].
The inventorship dispute was commercially material because:
If the NIH researchers were found to be co-inventors, the NIH would have co-ownership rights to the patent under 35 U.S.C. § 262, including the right to license the technology independently — potentially to Moderna’s competitors.
The dispute highlighted the broader question of Moderna’s obligations under the Bayh-Dole Act and government license rights that apply to federally funded research conducted in collaboration with NIH.
The specific patent application at issue (U.S. Application No. 16/344,774) was a matter of public record from its filing date, and the NIH researchers’ contribution to the mRNA-1273 design was documented in scientific publications that also predated the patent filing. A sophisticated pre-IPO review of the company’s mRNA platform patents, cross-referenced against the published scientific literature on NIH-Moderna collaboration, would have identified the factual basis for the subsequent inventorship dispute years before it became a publicly disclosed litigation risk.
This case does not indict Moderna’s business, which produced a genuinely important medical advance and has generated extraordinary returns for investors. It illustrates that patent complexity in platform biotechnology companies is frequently greater than S-1 disclosures convey, and that the factual basis for future disputes is often visible in public records before those disputes are formally initiated.
Case Study: The CRISPR Patent Wars and Their Effect on Licensed Biotech Companies
The CRISPR-Cas9 patent dispute between the University of California, Berkeley (UC) and the Broad Institute of MIT and Harvard is the most consequential patent dispute in modern biotechnology history, both for the technical and commercial stakes and for its effect on biotech companies that licensed from one side or the other before the dispute was resolved.
The core dispute concerned priority — who first invented the application of CRISPR-Cas9 for genome editing in eukaryotic cells (the cells of plants and animals, as distinct from bacteria). UC’s Doudna-Charpentier team published the foundational CRISPR-Cas9 paper in Science in June 2012 [27], with a provisional patent application filed weeks before publication. The Broad Institute’s Zhang team filed a patent application claiming CRISPR-Cas9 in eukaryotes in December 2012, but paid for expedited examination and received U.S. Patent 8,697,359 in April 2014 — before UC’s application had been examined.
The dispute entered the PTAB’s interference proceedings and subsequently the Federal Circuit, with the central legal question being whether Broad’s eukaryotic application was obvious in light of UC’s earlier prokaryotic work — and therefore whether Broad’s patents had priority — or whether eukaryotic application was a non-obvious extension that deserved its own separate priority date [28].
Multiple biotech companies went public during this dispute with licenses from either UC or Broad, including Editas Medicine (Broad licensee), Intellia Therapeutics (UC licensee), and CRISPR Therapeutics (UC licensee). Each of these companies disclosed the dispute in their S-1 filings, but the disclosures appropriately noted that the outcome was uncertain. What the standard investment analysis of the time frequently failed to adequately price was the scenario in which the winning party’s patent scope would be narrowed by the other party’s surviving patents, creating a situation where both sides held overlapping claims to different aspects of the same technology — which is precisely what happened.
The resulting patent landscape is one where both UC and Broad hold foundational patents, companies licensed from either may need licenses from both for comprehensive freedom-to-operate, and the sublicensing economics of building a commercial CRISPR product are more complex than they appeared when these companies went public.
For investors evaluating biotech IPOs in any field where foundational patents are contested or where multiple institutions have claimed priority to related inventions, the CRISPR history provides the following lessons:
Priority disputes take longer to resolve than company timelines assume. The CRISPR dispute began in 2012 and produced major litigation through 2022, spanning the IPO filing dates of multiple public companies.
The disclosure that “we believe our license covers the relevant technology” is not equivalent to having independently verified that conclusion against all competing patent claims.
Licensing strategies built on a single institutional licensor are vulnerable to competitive entry by companies licensed from the other side of a priority dispute.
The financial modeling implications of royalty stacking — paying both UC and Broad for comprehensive CRISPR freedom-to-operate — should be explicitly accounted for in IPO-stage valuations.
Case Study: Platform Technology Patents and the Royalty Stacking Trap in RNA Therapeutics
Beyond CRISPR, the RNA therapeutics space illustrates the royalty stacking risk that accumulates when multiple independently developed platform technologies combine in a single commercial product.
A lipid nanoparticle (LNP) delivery system for an mRNA drug, for example, involves:
LNP manufacturing process patents (microfluidic mixing technology, quality control specifications).
For any company commercializing an LNP-formulated mRNA drug, each of these patent layers involves potential licensing obligations to different patent holders. Alnylam Pharmaceuticals, Moderna, Acuitas Therapeutics, Arbutus Biopharma, Genevant Sciences, and the NIH all hold significant patent positions in LNP delivery technology, and the relationships between these positions have been extensively litigated.
Arbutus Biopharma’s litigation with Moderna over LNP patents, for example, involved claims that Moderna’s COVID-19 vaccine infringed Arbutus LNP patents — and resulted in a PTAB finding that some, but not all, of the asserted Arbutus claims were invalid [29]. The surviving claims remained potentially infringed, and the litigation continued after the PTAB proceedings.
For a biotech company at IPO that plans to use LNP delivery for its RNA therapeutic, pre-investment diligence should map the entire LNP patent landscape, identify which patent holders have asserted rights in the space, determine which patents the company has licensed or believes it does not need to license, and calculate the aggregate royalty burden from all required licenses. This calculation is not simple, but the foundational data — the identities of LNP patent holders, the scope of their claims, and the litigation record — is entirely available from public sources.
Building the Pre-Investment Patent Checklist
Translating the three-step framework into a practical investment workflow requires a structured checklist. The following represents the minimum viable diligence protocol for a biotech IPO investment:
Patent Estate Mapping
Identify all patents and patent applications owned or licensed by the company through the USPTO assignee search and the S-1 disclosure.
Construct the patent family structure showing parent applications, continuations, divisionals, and international counterparts for each key asset.
Verify geographic counterpart coverage in all major revenue markets (U.S., EU major markets, Japan, China, and any indication-specific high-revenue markets).
Identify any pending continuation applications and assess their strategic value for covering the commercial embodiment.
Conduct FTO screening for the lead product against the relevant patent landscape, and flag any potential blocking patents for further analysis.
Patent Timeline Stress Test
Calculate the adjusted patent term for all key patents, including PTA verification and PTE projection.
Map regulatory exclusivity entitlements (NCE, biologic, orphan drug) and their interaction with patent term.
Construct a protection timeline showing the dates on which each layer of patent and exclusivity protection expires and the revenue window each protects.
Compare the protection timeline against the projected clinical development and regulatory timeline to identify any gap between expected commercialization and available protection.
Litigation Exposure Assessment
Search the PTAB database for any IPR or PGR petitions involving the company’s key patents or related family members.
Search for Paragraph IV certifications in the FDA’s Orange Book if the company’s licensed patents cover an approved drug (relevant for companies that have also licensed marketed products alongside pipeline assets).
Assess the prior art landscape for the company’s key patents using non-patent literature and patent databases to identify references that a petitioner might assert.
For university-licensed technology, verify the specific license terms including diligence milestones, field restrictions, sublicensing limitations, revenue sharing obligations, and march-in risk exposure.
Verify inventor assignment completeness for all material patents by checking USPTO assignment records.
Tools and Data Sources for Pre-IPO Patent Analysis
Executing the three-step diligence framework requires access to patent data from multiple sources. The following are the primary data resources, all of which are publicly accessible without subscription:
USPTO Patent Full-Text Database: Searchable by assignee, inventor, patent number, and keyword. Provides full text of issued patents and published applications, including prosecution history through the Patent Center portal.
Google Patents: Provides free access to USPTO, EPO, and patent office records from over 100 countries, with integrated forward and backward citation analysis and patent family mapping.
PTAB e-FOIA Portal: Searchable database of all IPR, PGR, and derivation proceedings with complete trial records, petitions, patent owner responses, and final written decisions.
FDA Orange Book: The searchable database of pharmaceutical patents listed under the Hatch-Waxman Act, with expiration dates, exclusivity periods, and Paragraph IV certification history.
NIH iEdison Database: Tracks reporting of federally funded inventions under the Bayh-Dole Act, enabling identification of government rights in university-licensed technology.
EPO Global Patent Index (Espacenet): Provides international patent family data, EPO prosecution history, and opposition proceeding records for European patents.
For pharmaceutical biotech companies with products at or approaching commercialization, DrugPatentWatch provides integrated analysis that combines FDA Orange Book patent data, exclusivity period tracking, ANDA filing records, Paragraph IV litigation history, and patent term information in a pharmaceutical-specific structure. The intelligence value for pre-investment analysis comes from the integration: seeing on a single product page which patents cover a drug, when each expires, which generic or biosimilar applicants have targeted the drug, and what the litigation history looks like. This is the kind of structured, cross-referenced view that would take days to assemble manually from raw FDA and USPTO sources.
Practical Workflow for the First-Time Patent Reviewer
For investors who have not previously conducted patent due diligence and are approaching this process for the first time, a practical step-by-step workflow helps organize what can initially feel like an overwhelming volume of public information.
Begin with a Google Patents search using the biotech company’s name in the assignee field. Review the resulting list of published applications and granted patents, filtering for those whose titles and abstracts most closely relate to the lead compound or technology. For each relevant result, note the patent number (for granted patents), the application number, the filing date, the priority date, and the primary inventor names.
For university-licensed technology, repeat the same search using the licensing institution’s name as assignee, filtered by the inventor names that appear in the company’s scientific publications or S-1 acknowledgments. The resulting patents are the foundational licensed IP.
Open the top two to three patents in the USPTO Patent Center and read the claims section — beginning with the independent claims, identified by those that do not begin with “the [noun] of claim X.” Read each independent claim slowly, paying attention to whether it describes the compound by a specific structure (narrow) or by a functional property like binding affinity or biological activity (potentially broader but also potentially harder to enforce without adequate experimental support).
Check the prosecution history by clicking “Image File Wrapper” in the USPTO Patent Center. The most important documents are the office actions issued by the examiner (which identify prior art the examiner considered relevant) and the applicant’s responses (which explain how the applicant distinguished the prior art and which may contain prosecution disclaimers). Look specifically for office actions citing close prior art references and for any claim amendments that narrowed the original claim language.
Run the top prior art references cited in the office actions through Google Scholar to understand how close they are to the claimed invention. References that the examiner found to be very close — those cited in the primary rejection — deserve the closest attention as the most likely basis for future IPR petitions.
Finally, search the PTAB portal for the patent numbers identified in the first step, to confirm whether any IPR or PGR petitions have been filed. This search takes less than five minutes and provides definitive confirmation of whether any formal validity challenge is pending.
This five-step process does not replace patent counsel, but it provides a substantive baseline that identifies the most important questions to ask management and, where warranted, the specific issues to bring to outside counsel for formal analysis.
Financial Model Integration: Putting Patent Metrics into the DCF
The output of the three-step diligence framework needs to translate into financial model inputs to affect the investment decision. The following describes how each diligence finding affects a standard biotech IPO DCF model.
Adjusting the Revenue Projection Period
The most direct financial impact of patent timeline analysis is the adjustment of the revenue projection period used in the DCF. If the compound patent expires in 2032, but the drug is not expected to reach market until 2028, the base case DCF has a four-year protected revenue window before generic or biosimilar competition begins.
The effective commercial protection period is longer than four years if:
PTE is available and adds up to five years post-approval.
FDA regulatory exclusivity (NCE, orphan, biologic) extends market protection beyond the patent term.
Secondary patents on the commercial formulation or a key dosage regimen provide additional exclusivity in the 2-4 year range post-primary-compound-patent-expiration.
The effective protection period is shorter than the nominal patent term if:
The FTO analysis identified a blocking third-party patent that the company has not licensed, requiring redesign that delays the commercialization date.
An IPR petition has been filed or is highly probable, with a material probability of claim cancellation.
A university license diligence milestone has been or is at risk of being missed, threatening the license foundation.
The adjusted protection period — accounting for these upside and downside modifiers — should replace the nominal patent expiration date as the revenue projection endpoint in the DCF model.
Probability-Weighting the Revenue Scenarios
A single-case DCF model is insufficient for any biotech investment with material patent uncertainty. The appropriate approach is a probability-weighted scenario model with at minimum four cases:
The base case: The patent position holds as currently understood, the drug reaches market on the projected timeline, and generic or biosimilar competition begins at the adjusted patent expiration date.
The patent invalidation case: A key patent is cancelled through IPR or district court litigation, generic competition begins at the nominal patent expiration date with no PTE benefit, and revenues erode at the rate historically observed post-generic-entry for drugs in the same therapeutic class.
The blocking patent case: An unresolved third-party blocking patent requires the company to take a license on unfavorable terms, reducing net margins by the royalty rate for the patent-protected period, or requires a compound redesign that delays commercialization by 24 to 36 months.
The license termination case: A university license milestone is missed, the license is terminated, and the company must either renegotiate on the licensor’s terms or abandon the asset — a near-total value impairment for the licensed asset.
Assigning probabilities to each scenario requires judgment calibrated against the specific findings of the three-step diligence framework. Where the FTO analysis found no obvious blocking patents, the blocking patent case probability is low. Where the PTAB docket shows a pending IPR petition on the primary compound patent, the invalidation case probability may be 30 to 40 percent based on empirical institution and invalidation rate data.
The probability-weighted average of the four scenarios is the patent-risk-adjusted value of the drug asset. Comparing this adjusted value to the implied asset value in the IPO pricing reveals whether the market is adequately pricing patent risk.
The “Patent Cliff” Discount for Biotech IPOs
Academic research on pharmaceutical patent expiration has documented with consistency that the revenue impact of generic or biosimilar entry is rapid and substantial. For small molecule oral drugs, the standard finding is that branded revenue falls by 80 to 90 percent within 24 months of first generic entry, primarily through volume erosion (patients switching to generics) rather than price reduction of the branded product [30].
For biologics, the erosion profile is different — slower, driven more by price competition among biosimilar entrants than by immediate volume transfer, and varying substantially by therapeutic area and payer mix. Research on the first generation of U.S. biosimilar launches (filgrastim, infliximab, adalimumab) showed a range from 20 percent to 80 percent market share erosion over 36 months depending on the therapeutic class, physician prescribing behavior, and payer contracting [31].
The “patent cliff discount” in a biotech IPO model should reflect the empirically calibrated revenue erosion curve appropriate to the product category, applied from the adjusted patent expiration date. A model that assumes gradual, linear revenue decline from the patent expiration date overstates the protected revenue period and the terminal value in a way that systematic patent cliff data consistently refutes.
Sensitivity Analysis: The Variables That Move the Model Most
In a probability-weighted biotech patent valuation, sensitivity analysis reveals which input assumptions are driving the output most heavily, and therefore where additional diligence effort has the highest return on time invested.
In typical pharmaceutical patent valuations, the two variables that move the output most are: the probability that the primary compound patent survives an IPR challenge (which shifts the effective revenue window by the remaining patent term), and the year of commercial launch (which, given the discount rate, substantially affects the present value of all future cash flows).
A one-year delay in commercial launch caused by clinical hold, FDA review issues, or patent-related compound redesign reduces the present value of a ten-year revenue stream by approximately 8 to 10 percent at a 10 percent discount rate — more than the impact of a one-percentage-point royalty rate increase in most models. Investors who identify specific patent risks that could cause commercialization delay (a blocking patent requiring redesign, an unresolved priority dispute delaying FDA acceptance) and who translate those risks into commercialization timeline probabilities are running a more accurate model than those who hold timeline constant while adjusting only royalty rates.
Similarly, the probability of compound patent invalidation is a binary variable in the model’s structure but a continuous variable in the real world. A 30 percent probability of invalidation does not mean the drug will generate 70 percent of base-case revenues — it means there is a 30 percent probability the drug generates close to zero patent-period revenues (because generics would enter immediately upon compound patent invalidation) and a 70 percent probability it generates base-case revenues. The expected value calculation must reflect this binary structure, not a linear scaling of base-case revenues.
Building the sensitivity table with these variables explicitly quantified — what is the investment value at 10%, 30%, and 50% compound patent invalidation probability, and what is it at 2026, 2028, and 2030 commercialization dates — reveals the key assumptions that drive whether the investment thesis is viable. If the investment generates an adequate return only when the invalidation probability is below 20% and the commercialization date is 2027 or earlier, then the due diligence effort should focus laser-sharp on the specific evidence for and against those two assumptions.
Sector-Specific Risks: Oncology, Rare Disease, and Platform Technology Biotech
The three-step diligence framework applies across biotech sectors, but specific sectors carry distinct patent risk profiles that investors should understand before applying the general framework.
Oncology Biotech IPOs
Oncology remains the largest biotech IPO sector by deal count, and oncology biotech patent positions carry specific risks:
The use of combination therapy — where the company’s drug is tested in combination with a companion therapy from another manufacturer — creates FTO complexity for the combination regimen. A patent on the combination may be infringed by the partner drug manufacturer, creating licensing complexity for any commercial combination labeling.
Companion diagnostic patents, where a biomarker test is required to identify eligible patients, create additional IP layers outside the drug patent itself. If the companion diagnostic is patented by a third party, the commercial economics of the drug’s patient selection strategy may include diagnostic licensing costs not captured in standard drug revenue models.
Resistance mechanism patents, where competitors file patents covering known resistance mutations in the drug target, can limit the commercial life of targeted therapies by providing competitors with IP positions on the next-generation treatment approach.
The oncology patent landscape also contains a specific risk category related to tumor microenvironment and immune checkpoint biology. The checkpoint inhibitor field — covering PD-1, PD-L1, CTLA-4, and related immune targets — is one of the most patent-dense areas in pharmaceutical IP. Companies developing combination immunotherapy regimens face a landscape in which key checkpoint pathway patents are held by multiple large pharmaceutical companies including Bristol-Myers Squibb, Merck, AstraZeneca, and Roche, and where the overlapping claim scopes of these competing portfolios create a complex web of potential licensing obligations for smaller biotech IPO companies seeking to combine their asset with an approved checkpoint inhibitor.
Pre-investment FTO screening for oncology biotech IPOs specifically should map the company’s product against the checkpoint inhibitor patent landscape, even if the company’s current clinical program uses its own compound as monotherapy — because combination indications are the commercial standard in oncology, and the combination FTO will be negotiated well before the company reaches that clinical stage.
Rare Disease and Orphan Drug Biotech
Rare disease biotech IPOs present distinct structural features that affect the patent diligence approach:
The small patient populations that qualify drugs for orphan drug designation also mean that the revenue concentration per patient is extremely high, and the loss of orphan exclusivity to a competitor who challenges the qualifying population estimate can be commercially devastating.
Natural history studies and biomarker identification studies, which are standard components of rare disease drug development, generate data that can support patent applications on diagnostic methods. The competitive patent landscape in rare diseases frequently involves patents on patient selection methods that must be worked around or licensed.
Gene therapy and cell therapy products, which are disproportionately represented in rare disease biotech IPOs, carry manufacturing platform patent risks associated with viral vector production (AAV serotype patents held by multiple institutions), ex vivo cell modification (CRISPR and other gene editing patents), and specific manufacturing processes (clean-room bioreactor systems, cryopreservation methods).
The AAV gene therapy patent landscape merits specific mention as a cautionary case. The adeno-associated viral vector serotypes used in approved gene therapy products (including the serotypes used by Spark Therapeutics in Luxturna and by AveXis/Novartis in Zolgensma) are covered by patents held by the University of Pennsylvania, University of Florida, Children’s Hospital of Philadelphia, and other academic institutions, as well as by commercial companies including Spark Therapeutics itself. A biotech company going public with an AAV gene therapy program that has not mapped its AAV serotype and production process against this landscape is carrying material unpriced FTO risk. The AAV patent pool administered through the Nationwide Children’s Hospital (now Andelyn Biosciences) provides one licensing pathway, but it does not cover all relevant patents in the field.
For investors evaluating rare disease biotech IPOs, DrugPatentWatch’s Orphan Drug Designation tracking provides confirmation of ODD grant status and the associated FDA exclusivity periods, enabling quick verification of the exclusivity claims embedded in the IPO valuation model without requiring manual FDA database searches.
Platform Technology Biotech
Companies that IPO on the strength of a technology platform — rather than a specific drug candidate — present a distinctive patent analysis challenge. The value proposition is the breadth and exclusivity of the platform, and the patent analysis must assess whether the platform claims are genuinely broad enough to cover all the applications the company projects.
Platform technology companies (RNA medicine platforms, protein degradation platforms, epigenetic editing platforms) frequently have patent portfolios consisting of early-filed broad claims that were novel when written but that face prior art challenges as the field matures and competing foundational patents emerge. The key diligence question is: at what point does the platform’s exclusivity erode as the foundational claims become challengeable or as competing approaches achieve equivalent results by design-around?
For investors in platform biotech IPOs, the specific question to answer through patent diligence is: does the platform’s patent position cover the commercially meaningful applications broadly enough that competitors cannot achieve equivalent therapeutic results without infringing? A platform patent that covers only a narrow implementation of a widely-applicable technology is a product patent in disguise — not the durable platform monopoly its valuation implies.
An illustrative case is the protein degradation (PROTAC) technology platform. Companies including Arvinas and C4 Therapeutics went public based on their positions in the heterobifunctional degrader space, a technology for directing cellular protein degradation machinery toward specific disease-relevant proteins. The foundational PROTAC patents filed by Craig Crews at Yale and Kathleen Sakamoto cover the general approach to heterobifunctional degraders, and both Arvinas and C4 hold licenses. But the specific degrader molecule patents — those covering the E3 ligase recruiting moiety, the linker chemistry, and the target-binding warhead for each specific drug — are where the actual commercial protection for each program resides. Investors evaluating these IPOs needed to assess not just whether the platform license was secure, but whether the specific compound patents for the lead programs were strong and whether the broader degrader space was already being designed around by competitors using alternative E3 ligase binders or linker chemistries that fell outside the licensed foundational patents.
Platform technology investments require analyzing two separate patent dimensions simultaneously: the durability and breadth of the foundational platform claims that create the general exclusivity moat, and the strength and commercial coverage of the specific program-level patents that actually prevent generic or biosimilar competition in the final commercial products. Both layers matter, and collapsing them into a single “we have a patent platform” assessment misses the distinction.
The Role of Experienced Patent Counsel in Investment Diligence
The three-step framework described in this article is designed to be accessible to sophisticated investors without requiring full patent counsel involvement for every potential investment. But there are specific circumstances where engaging experienced patent counsel before an investment is warranted:
When the investment is large (generally, positions above $5 million in a single biotech company, where the cost of counsel is proportionate to the investment size).
When the pre-investment screening identified specific red flags — a pending PTAB petition, a potential blocking patent, a contested priority date, or an ambiguous university license structure.
When the company’s lead compound sits in a particularly contested patent landscape where multiple foundational patent holders have active enforcement records.
The counsel engaged for pre-investment patent review should be experienced in both patent validity analysis and pharmaceutical/biotech sector knowledge. General intellectual property counsel without pharmaceutical sector background will miss the FDA regulatory exclusivity interactions that affect the effective commercial protection period. Patent counsel without litigation experience will underestimate the probability of IPR petition filing by competitors with established petitioning histories.
The cost of a focused pre-investment patent analysis from experienced biotech patent counsel — covering claim scope assessment for two to three key patents, FTO screening, and litigation risk assessment — runs approximately $15,000 to $30,000 for a well-scoped engagement. For a $5 million investment in a biotech IPO, this cost represents 0.3 to 0.6 percent of the investment amount. The historic incidence of material patent problems that were discoverable pre-investment and contributed to significant post-IPO value loss is large enough that this cost is easily justified.
Post-IPO Patent Monitoring: Protecting the Investment After Closing
The three-step due diligence framework does not end at the investment date. Biotech patent situations evolve — new PTAB petitions arrive, new Paragraph IV certifications are filed, additional continuation patents issue, university licenses are renegotiated, and scientific publications create new prior art. Ongoing monitoring of the patent position is part of managing the investment.
The minimum viable monitoring protocol for a biotech holding covers:
PTAB petition alerts: The PTAB’s e-mail notification system allows subscribers to receive notifications when new petitions are filed naming specific patents. Setting these alerts for the key patents in a biotech holding is free, takes minutes to configure, and provides immediate notification of the most material patent risk event.
FDA Orange Book update monitoring: DrugPatentWatch and similar services provide notification when the Orange Book is updated to include new patent listings, ANDA filings, or Paragraph IV certifications for a tracked product. For biotech companies whose drugs are approaching approval, these notifications provide early warning of competitive challenges before they are formally disclosed.
USPTO assignment record monitoring: New patent assignments affecting the company’s key patents or its university licensor’s related patents can signal strategic shifts — a competitor acquiring a blocking patent, a university licensing a key platform to an additional party, or the company itself acquiring additional IP through licensing or purchase.
Continuation application prosecution tracking: Monitoring the USPTO’s public patent application file allows investors to track the prosecution of pending continuation applications, identify when the USPTO issues office actions raising new invalidity arguments, and assess whether the company is successfully prosecuting the continuation strategy that the pre-investment analysis identified as strategically significant.
Patent Due Diligence for Secondary Offerings and SPAC Mergers
The three-step framework applies with equal force to secondary equity offerings by biotech companies, secondary market purchases at lock-up expiration, and SPAC merger transactions where a private biotech becomes public through a reverse merger.
SPAC mergers are particularly susceptible to patent diligence gaps because the transaction timeline is frequently compressed, the SPAC sponsor’s incentive structure rewards deal closing speed rather than diligence depth, and the disclosure documents (proxy statement or S-4) are subject to somewhat different standards than a traditional IPO S-1. The private biotech company entering a SPAC merger has also not been subject to the underwriting process that, even at its most superficial, imposes some baseline disclosure discipline.
Several high-profile SPAC biotech transactions between 2020 and 2022 involved companies whose patent positions were materially weaker than their investor presentations implied, and whose post-merger stock performance was substantially influenced by patent risk events that were discoverable from public records before the merger closed. The specific pattern — high valuation based on a novel drug mechanism protected by early-stage broad patents, followed by competitor entry through design-around or IPR petition shortly after the company’s drug entered Phase II or Phase III — is consistent with inadequate pre-merger patent diligence.
For secondary offering investments in biotech companies, the key additional diligence question relative to the original IPO is: what has changed in the patent landscape since the IPO? Specifically, have any PTAB petitions been filed against the company’s key patents since the IPO date (searchable in the PTAB docket), have any Paragraph IV certifications arrived (searchable in the FDA Orange Book and announced in SEC filings), and have any scientific publications appeared in the interim that could be used as prior art in invalidity proceedings?
The gap between IPO and secondary offering is frequently the period during which the competitive patent landscape heats up. As a drug’s clinical promise becomes more visible, competitors invest more in IP strategy and prior art searches, and the probability of a formal patent challenge increases. Secondary investors who conduct the same level of patent diligence as IPO investors are already behind the analysis curve; those who conduct more rigorous analysis specifically focused on developments since the IPO are in the most informed position.
What Separates Investors Who Get Burned From Those Who Do Not
The pattern that appears consistently across high-profile biotech IPO patent failures is not complicated: investors who lost money on patent problems almost universally skipped the three steps described in this article. They accepted the S-1’s generic boilerplate as substantive disclosure. They valued regulatory exclusivity without verifying its dimensions. They modeled revenue projections against nominal patent expiration dates rather than stress-tested effective protection periods. They did not search the PTAB docket or the FDA Orange Book for signals that sophisticated counterparties had already concluded the IP was vulnerable.
The investors who avoided these specific losses did the opposite. They treated the S-1 as a starting point, not a conclusion. They verified patent claims against marketed or clinical-stage products. They calculated effective protection periods. They found, before investing, the prior art that IPR petitioners later used successfully.
None of this requires specialized legal training as a prerequisite. It requires intellectual discipline and willingness to spend time in patent databases that are freely available to anyone. The analytical judgment required to assess what the prior art means, whether the claim scope is genuinely broad, and whether a specific prosecution history disclaimer is legally binding — those judgments benefit from experienced patent counsel’s input. But the identification of whether the specific risks exist at all is accessible to any investor who knows where to look.
The pharmaceutical and biotech sectors will continue producing large volumes of IPO activity. Clinical-stage companies will continue going public at substantial pre-revenue valuations justified primarily by IP positions. A small fraction of those IP positions are as strong as the S-1 implies. Identifying which ones belong to that fraction is the work that pre-investment patent due diligence performs.
Patent due diligence is not a commodity service conducted by underwriting counsel. It is a specific analytical process that requires reading claims, mapping prosecution history, searching prior art, and stress-testing timelines — none of which standard IPO disclosure processes accomplish.
The S-1’s patent risk factor disclosures are legally designed to satisfy disclosure standards, not to communicate specific patent quality. The standard boilerplate tells sophisticated investors almost nothing about whether the specific patents supporting the specific investment thesis are strong or weak.
Freedom-to-operate analysis is the single most financially consequential pre-investment step that investors routinely skip. A blocking third-party patent discovered post-investment cannot be resolved at the pre-investment negotiating position that existed before capital was committed.
Patent term remaining must be calculated with PTA and PTE adjustments, stacked against all applicable regulatory exclusivity periods, and then compared directly against the clinical development and regulatory approval timeline to determine whether the available protection window actually justifies the revenue projections embedded in the IPO pricing.
University license chains introduce structural complexities — diligence milestones, field-of-use restrictions, sublicensing limitations, royalty stacking, and Bayh-Dole march-in risk — that are almost never disclosed in adequate detail in biotech S-1 filings and that require direct investigation.
IPR petition probability is not unknowable. The combination of claim scope, prosecution history quality, prior art density, and the identities of likely petitioners makes IPR risk assessable before it materializes. Empirical PTAB data provides calibration for probability estimates.
Priority date disputes in competitive research areas — CRISPR, RNA medicine, gene therapy, and other rapidly developing fields — have a documented history of being visible in public PTAB records before they are formally disclosed as investment risks.
The royalty stacking risk in platform technology biotech, where multiple independent patent holders own overlapping rights in a single commercial product’s technology, is consistently underweighted in IPO-stage financial models and consistently overpriced in IPO valuations.
Biotech IPO patent risk should translate into financial model adjustments — specifically, a reduced revenue projection period, a probability-weighted scenario structure, and a patent cliff discount calibrated against empirical generic or biosimilar entry revenue erosion data.
Post-IPO patent monitoring through PTAB alert systems, Orange Book monitoring tools, and continuation prosecution tracking transforms the pre-investment diligence exercise into an ongoing risk management process that can provide early warning of material patent risk events before they are formally disclosed.
FAQ
Q1: How do I identify which of a biotech company’s patents actually matter for the investment thesis, given that some companies disclose portfolios of hundreds of patents?
A1: The portfolio size number in the S-1 is close to irrelevant for investment analysis. What matters is identifying the specific patents that would prevent generic or biosimilar competitors from entering the market for the lead commercial product. Start by identifying the compound or biological entity that the lead product consists of, then search for granted U.S. patents in the company’s name (or its licensor’s name) with claims covering that specific entity. A granted patent with independent claims covering the specific compound, salt form, or biological sequence of the lead product is what controls the competitive entry timeline. Everything else in the portfolio — manufacturing patents, method-of-treatment patents, formulation patents — has conditional value that depends on the compound patent’s survival. In most early-stage biotech companies, two to five patents do the commercially critical work. Identifying those specifically, and then applying deep analysis to those, is more valuable than reviewing the full portfolio at lower depth.
Q2: What should investors do when a biotech IPO company refuses to provide specific answers about patent term calculations or license terms during the roadshow?
A2: Non-disclosure of specific patent terms and license details should be treated as information, not silence. Company management has legitimate reasons not to disclose proprietary license financial terms in public roadshow settings, but they should be able to confirm: whether the core patents have been independently analyzed for validity; whether a freedom-to-operate analysis has been conducted; whether any third-party claims or demands have been received related to the product technology; and whether license diligence milestones are aligned with the projected clinical timeline. Refusal to answer these specific questions without claiming privilege or confidentiality as the reason is a negative signal. Investors who are not receiving answers at the roadshow stage should request the information through their prime broker or underwriter relationship, or treat the information gap as a risk discount in the investment decision.
Q3: How does the PTAB’s “serial petitioner” practice affect biotech patent risk, and which companies should investors be most concerned about?
A3: The “serial petitioner” concern refers to the practice of filing multiple IPR petitions against the same patent — either by the same petitioner on different grounds after an institution denial, or by multiple related entities filing separate petitions to effectively harass the patent holder with sequential proceedings. The USPTO adopted the “Fintiv” framework [32] as a discretionary denial mechanism intended to reduce serial petitioning, but its application has been inconsistent, and serial petitioning remains a tactical tool used by well-resourced generic pharmaceutical manufacturers. The biotech companies most exposed to serial petitioner risk are those whose lead compound patents would, if valid, block a large commercial opportunity for a sophisticated generic manufacturer or biosimilar developer — because these are exactly the targets for whom the economics of repeated petitioning make sense. Investors should specifically flag biotech companies with small molecule drugs in large therapeutic markets (oncology, immunology, diabetes, cardiovascular) approaching regulatory approval, since the 505(b)(2) and ANDA pathways make these targets for generic challenger investment before FDA approval.
Q4: How should investors analyze biotech companies that are built on licensed platform technology from a company that has itself been involved in patent disputes?
A4: When a biotech company’s platform is licensed from an entity that has been involved in patent disputes — whether as plaintiff or defendant — the relevant analysis tracks two risk layers. The first is whether the original dispute affected the validity or scope of the specific patents now licensed to the biotech. PTAB decisions that cancelled claims in a patent also cancelled those claims in all licenses of that patent, regardless of when the license was executed. The second is whether the dispute history reveals the license grantor’s enforcement posture, litigation appetite, and the strength of their position relative to competing patent holders. A licensor who has successfully enforced platform patents against multiple defendants signals both that the technology is commercially significant and that the licensor has tested the patents in adversarial proceedings — a quality signal for licensees. A licensor who has lost platform patent validity challenges across multiple proceedings signals that the licensed technology’s IP foundation is weaker than the S-1 disclosure of “exclusive platform license” might suggest.
Q5: What is the realistic timeline for patent due diligence on a biotech IPO, and how do investors work within the compressed roadshow schedule?
A5: A comprehensive three-step patent diligence review for a single biotech company requires approximately five to ten business days of focused work, assuming access to all relevant public databases and the ability to engage patent counsel for the legal interpretation components. The practical constraint is that biotech IPO roadshows typically run two to three weeks from S-1 effectiveness to pricing, and the S-1 itself is often publicly available only a few weeks before the roadshow begins. The triage-based approach to pre-investment diligence allocates analysis time efficiently by starting with the patent estate mapping and timeline stress test, which can be conducted primarily from public databases in two to three days, and then commissioning focused patent counsel review only for the specific high-priority patents identified by the initial screening. This staged approach allows investors to complete a meaningful pre-investment patent analysis within the practical time constraints of the IPO process. The alternative — committing capital without completing the analysis and starting the diligence post-lock-up expiration — is the behavior that creates the “don’t get burned” scenario the title names.
Sources
[1] KPMG LLP. (2024). Biotech IPO trends report 2018-2023: Capital markets analysis. KPMG Life Sciences Practice.
[2] Bayh-Dole Act, Pub. L. No. 96-517, 94 Stat. 3015 (1980) (codified at 35 U.S.C. §§ 200-212).
[3] 35 U.S.C. § 203. (2024). March-in rights. United States Code.
[4] National Institute of Standards and Technology. (2023). Draft interagency guidance framework for considering the exercise of march-in rights. U.S. Department of Commerce.
[5] 35 U.S.C. § 112(a). (2024). Specification: Written description requirement. United States Code.
[7] National Academies of Sciences, Engineering, and Medicine. (2020). The role of international patent filings in maintaining U.S. competitiveness. The National Academies Press. https://doi.org/10.17226/25570
[8] 35 U.S.C. § 154(a)(2). (2024). Contents and term of patent: Term. United States Code.
[9] Wong, C. H., Siah, K. W., & Lo, A. W. (2019). Estimation of clinical trial success rates and related parameters. Biostatistics, 20(2), 273-286. https://doi.org/10.1093/biostatistics/kxx069
[10] 35 U.S.C. § 154(b). (2024). Patent term adjustment. United States Code.
[11] 35 U.S.C. § 156. (2024). Extension of patent term. United States Code.
[12] The Regents of the University of California v. Broad Institute, Inc., 903 F.3d 1286 (Fed. Cir. 2018).
[13] 21 U.S.C. § 355(j)(5)(F)(ii). (2024). New chemical entity exclusivity. United States Code.
[14] 42 U.S.C. § 262(k)(7)(A). (2024). Biologic exclusivity: 12-year exclusivity period. United States Code.
[15] 21 U.S.C. § 360cc. (2024). Orphan drug exclusivity. United States Code.
[16] Food and Drug Administration Safety and Innovation Act, Pub. L. No. 112-144, § 902, 126 Stat. 993 (2012) (establishing breakthrough therapy designation).
[17] United States Patent and Trademark Office. (2023). PTAB trial statistics: IPR, PGR, CBM — fiscal year 2023 end of year statistics. USPTO Patent Trial and Appeal Board.
[18] 35 U.S.C. § 314(a). (2024). Institution of inter partes review: Threshold. United States Code.
[20] Patent Trial and Appeal Board. (2023). FY2023 PTAB statistics. U.S. Patent and Trademark Office. https://www.uspto.gov/patents/ptab/statistics
[21] 35 U.S.C. § 203(a). (2024). March-in rights: Conditions. United States Code.
[22] National Institute of Standards and Technology. (2023, December). NIST framework for march-in rights. Federal Register, 88(239), 85264.
[23] National Institutes of Health. (2024). iEdison: Invention reporting system. U.S. Department of Health and Human Services. https://www.iedison.gov
[24] Pressman, D., & Tuytschaevers, T. (2017). Patent it yourself: Your step-by-step guide to filing at the U.S. Patent Office (17th ed.). Nolo Press.
[25] Moderna, Inc. (2018). Prospectus supplement: Initial public offering (Form 424B4). U.S. Securities and Exchange Commission.
[26] National Institutes of Health. (2021, November). NIH statement on efforts to make COVID-19 vaccines available. U.S. Department of Health and Human Services.
[27] Jinek, M., Chylinski, K., Fonfara, I., Hauer, M., Doudna, J. A., & Charpentier, E. (2012). A programmable dual-RNA-guided DNA endonuclease in adaptive bacterial immunity. Science, 337(6096), 816-821. https://doi.org/10.1126/science.1225829
[28] Broad Institute, Inc. v. The Regents of the University of California, IPR2017-01055 (P.T.A.B. 2017).
[29] Arbutus Biopharma Corp. v. ModernaTX, Inc., IPR2018-01451 (P.T.A.B. 2020).
[30] Grabowski, H., Long, G., Mortimer, R., & Boyo, A. (2016). Updated trends in U.S. brand-name and generic drug competition. Journal of Medical Economics, 19(9), 836-844. https://doi.org/10.1080/13696998.2016.1176578
[31] Avalere Health. (2022). Biosimilar market dynamics: Revenue erosion curves across therapeutic categories. Avalere Health LLC.
[32] Apple Inc. v. Fintiv, Inc., IPR2020-00019 (P.T.A.B. 2020) (precedential).