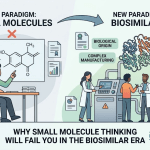
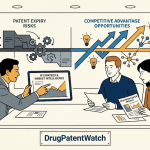
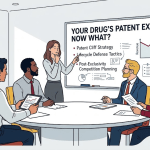
The patent cliff is not a metaphor. When Humira’s U.S. composition-of-matter patent finally cracked open in 2023, AbbVie had already erected 132 granted patents around the molecule over two decades, forcing every biosimilar entrant into a negotiated settlement rather than an at-risk launch. When Lipitor lost exclusivity in 2011, Ranbaxy captured roughly 80% of the atorvastatin market within weeks. These two events, more than any regulatory guidance document, define what the transition from brand to generic actually looks like in practice: part forensic science, part patent warfare, part regulatory marathon, and entirely a high-stakes capital allocation decision.
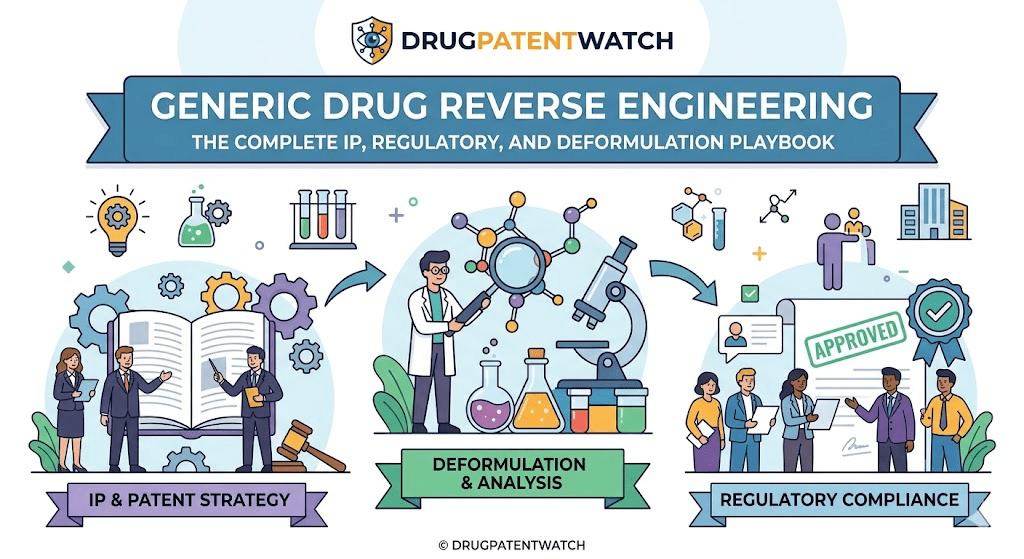
This piece covers the full stack. It starts where most analysis starts, with the economics and IP landscape that determine whether a target is worth pursuing at all. It moves through the U.S. and European regulatory pathways, then goes deep into the analytical chemistry of deformulation: how scientists reverse engineer a tablet, a parenteral, an inhaler, or a biologic from physical evidence alone. It closes on the computational turn reshaping all of it, from physiologically based pharmacokinetic (PBPK) models replacing clinical bioequivalence studies to machine learning optimizing formulation design before a single batch is manufactured.
The target reader is an IP strategist mapping a Paragraph IV challenge, a portfolio manager stress-testing revenue assumptions against a loss-of-exclusivity date, an R&D lead scoping a complex generic program, or an institutional investor trying to understand why a biosimilar launch priced at a 30% discount failed to move formulary share.
Section I: The Economic and IP Battlefield
1.1 The Patent Cliff: Scale, Timing, and What It Actually Means for Capital
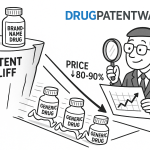
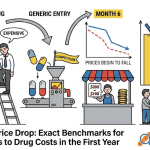
The patent cliff is the revenue collapse that follows loss of exclusivity (LOE) for a branded drug. The collapse is fast: sales of the reference listed drug (RLD) typically fall 80-90% within the first 12 to 18 months of generic entry for oral solid dosage forms. For biologics, the decline is slower and shallower, typically 20-40% over two to four years, for reasons this piece addresses at length.
The 2025-2030 window is projected to be the most concentrated LOE period on record. Approximately $200-300 billion in annual branded revenues face generic or biosimilar competition by 2030, across roughly 190 molecules, 69 of which qualify as blockbusters by standard revenue thresholds. The global generic market is forecast to reach $728-926 billion by 2034, depending on the analyst source, driven by aging demographics in the U.S., Europe, and Japan alongside sustained demand for affordable medicines in emerging markets.
The societal math is straightforward: in 2023, generics and biosimilars represented 90% of U.S. prescriptions filled but only 13.1% of total prescription drug spending, saving the healthcare system an estimated $445 billion in that year alone. That ratio the mechanism by which the patent system transfers monopoly rents into public savings over a predictable, legislated timeline.
For investors, the practical implication is that an LOE event is one of the few genuinely foreseeable disruptions in pharma. Patent expiration dates are public record. The question is never whether a cliff exists but rather how steep it will be, how many generics will enter simultaneously, and whether the innovator has deployed legal or structural tools to soften the drop. Those tools are the subject of the next section.
Key Takeaways
The $200-300 billion LOE wave through 2030 creates one of the largest recurring transfer-of-value opportunities in capital markets. For generic companies, the question is not whether to pursue these molecules but which to pursue, how early to file, and how much litigation budget to commit. For investors in branded pharma, every blockbuster with a sub-five-year patent runway needs a secondary defense assessment, not just a sales forecast.
Investment Strategy
Analysts modeling LOE impact should disaggregate timing by dosage form complexity. Simple oral solid generics face 80%+ erosion within 18 months. Complex generics (modified-release, inhalation, topical) erode more slowly due to higher development barriers. Biologics face the slowest erosion, but that picture is changing as interchangeability designations accumulate and payer formulary leverage grows. Apply a tiered erosion curve, not a binary LOE switch.
1.2 Target Selection: The Patent Intelligence Layer
Generic companies do not chase every expiring patent. The selection of a development candidate is a capital allocation decision framed by market size, competitive density, IP complexity, formulation difficulty, and the probability of first-to-file status. Databases like DrugPatentWatch synthesize this data across more than 130 countries, tracking expiration dates, litigation history, competitor ANDA pipelines, Orange Book listings, and formulation disclosures buried in the patent record.
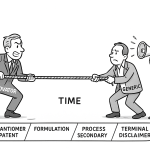
The IP map for any given molecule is rarely simple. A drug’s effective market exclusivity is not determined by one patent. It is the later of the last relevant patent or the last applicable regulatory exclusivity period, and those two timelines can diverge substantially. The primary composition-of-matter patent, covering the active molecule itself, runs 20 years from the filing date. But the effective patent life is shorter after accounting for the years consumed by development and regulatory review. The FDA’s Patent Term Extension mechanism, created by Hatch-Waxman, partially compensates for this, extending the patent term by up to five years, subject to a cap of 14 years of post-approval exclusivity.
Stacked on top of the patent timeline are regulatory exclusivities that operate independently:
New Chemical Entity (NCE) exclusivity grants five years of data protection for drugs containing a new active ingredient. The FDA cannot accept an ANDA for the first four years of that period. New Clinical Investigation exclusivity grants three years for drugs that required new clinical studies for approval of a new indication, dosage form, or route of administration, even if the molecule itself is not new. Orphan Drug Exclusivity (ODE) provides seven years of market exclusivity for approved rare disease treatments. Pediatric exclusivity adds six months to all existing patents and exclusivities as an incentive for conducting pediatric studies. Biologic exclusivity under the Biologics Price Competition and Innovation Act (BPCIA) provides 12 years of market exclusivity from the date of first licensure for new reference biologic products.
A generic strategist must map all of these timelines simultaneously. The first legal opportunity for ANDA submission is determined by whichever barrier expires last, and a single overlooked exclusivity can invalidate a development plan built on the wrong date.
The financial model that drives the final go/no-go decision weighs multiple variables: the brand drug’s annual U.S. net sales (the primary revenue proxy), the projected number of ANDA filers likely to receive approval before or around the same time, the estimated development cost given the dosage form’s complexity, and critically, the probability of achieving first-to-file status on a Paragraph IV challenge, which carries the 180-day market exclusivity prize described in Section 1.4.
Key Takeaways
Target selection is an exercise in competitive intelligence as much as science. The gap between a drug’s nominal patent expiration and its actual first-legal-entry date can span years when regulatory exclusivities are factored in. Companies that build this analysis with granular data at the molecule level, rather than relying on Orange Book summaries alone, consistently find earlier entry windows and better-positioned ANDA timing.
1.3 The Innovator’s Defense: Evergreening, Patent Thickets, and IP Valuation as a Core Asset
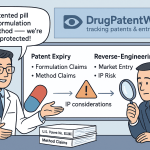
Evergreening is the practice of extending a drug’s effective monopoly by securing secondary patents on variations of the original invention. These secondary patents do not protect new molecules. They cover alternative formulations (controlled-release, abuse-deterrent, orally disintegrating), new dosage strengths, new delivery systems, different routes of administration, new therapeutic uses, and distinct crystalline forms (polymorphs) of the same API. Each additional patent extends the legal uncertainty around generic entry and raises the cost of challenge.
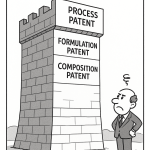
Patent thickets are the cumulative result of aggressive evergreening. A thicket is a dense, overlapping web of patents where the strategic objective is not to win any single infringement case but to make the totality of the challenge so expensive, time-consuming, and uncertain that potential generic filers are deterred from trying. From an IP valuation standpoint, a patent thicket is a real asset: it generates measurable, time-bounded cash flows by suppressing competition beyond what the original composition-of-matter patent would have permitted.
AbbVie/Humira: The Canonical Patent Thicket
Humira (adalimumab) is the most studied example of a patent thicket in the biologic era. AbbVie filed over 247 patent applications in the U.S. after the drug’s initial 2002 approval, ultimately securing more than 132 granted patents. Research by the Initiative for Medicines, Access & Knowledge (I-MAK) found that 89% of those patent applications were filed after Humira was already on the market, with nearly half filed more than a decade post-launch. Approximately 80% of the patents in the estate are characterized as duplicative.
The IP valuation consequence was substantial. In Europe, where patent systems impose stricter requirements on the inventiveness of secondary claims, biosimilar versions launched in 2018. In the U.S., the thicket held until 2023, a five-year lag that cost the American healthcare system an estimated $14.4 billion in excess spending. Every biosimilar entrant, including Amgen’s Amjevita, Sandoz’s Hyrimoz, and Boehringer Ingelheim’s Cyltezo, resolved their challenges through settlement agreements with AbbVie that specified controlled, delayed launch dates rather than at-risk entry. This outcome was not an accident of litigation; it was the designed result of a patent portfolio constructed explicitly to foreclose at-risk competition.
From a portfolio valuation standpoint, Humira’s patent estate generated roughly $100+ billion in U.S. net revenues between 2018 and 2023 that would have faced immediate biosimilar pressure under the European timeline. That is the measurable cash value of a patent thicket.
Purdue Pharma/OxyContin: Reformulation as Evergreening
OxyContin (extended-release oxycodone) illustrates a different evergreening pathway: product reformulation driven by a genuine safety rationale that simultaneously resets the patent clock. Faced with catastrophic abuse of the original formulation, Purdue developed an abuse-deterrent formulation (ADF) incorporating a polymer matrix that made the tablet resistant to crushing and dissolution for injection. Purdue secured a new suite of patents covering the ADF technology.
In 2013, the FDA approved OxyContin’s abuse-deterrent labeling and simultaneously withdrew approval for the original non-ADF formulation, citing that the generic version no longer had a reference listed drug to reference since the original had been pulled from the market. The ruling was later clarified, but the practical effect was that any generic entrant would need to demonstrate bioequivalence to the ADF version, not the original, confronting an entirely new patent set. Multiple generic applicants, including Endo Pharmaceuticals and Mylan (now Viatris), pursued Paragraph IV challenges against the ADF patents. The Federal Circuit’s December 2024 opinion in Purdue Pharma v. Accord Healthcare addressed the scope of those claims, illustrating that ADF litigation remains active. Purdue’s petition for certiorari to the Supreme Court was filed in April 2025, indicating the matter is not fully resolved.
The OxyContin case is instructive for IP teams and investors because it shows how a legitimate product improvement, when timed with FDA market withdrawal of the original, can function as an evergreening reset even under heightened regulatory scrutiny.
IP Valuation Framework for Secondary Patents
For analysts building discounted cash flow models around branded pharma assets, secondary patents deserve individual valuation rather than blanket inclusion. The key variables are enforceability probability (how likely is the patent to survive an IPR or Paragraph IV challenge on its merits?), remaining term, scope of coverage (does it cover the specific formulation the generic would target?), and the cost asymmetry it imposes on challengers. A patent with low enforceability probability but high litigation cost to challenge still has real option value, because it deters entry even if it would lose at trial.
Key Takeaways
Patent thickets are quantifiable assets, not just legal defenses. For innovator IP teams, the Humira model demonstrates the value of post-launch filing activity, particularly for biologics with 12-year BPCIA exclusivity windows, where secondary patents can extend effective exclusivity well past the regulatory period. For generic strategists, thicket density is a screening variable: a molecule with 50+ Orange Book patents requires a fundamentally different litigation budget and timeline than one with a single expiring composition claim.
1.4 Paragraph IV Litigation: Economics, Odds, and the 180-Day Prize
The Hatch-Waxman Act’s Paragraph IV certification mechanism is the legal trigger for the entire U.S. generic challenge system. When an ANDA applicant files a Paragraph IV certification, it declares that one or more of the innovator’s listed patents are either invalid, unenforceable, or will not be infringed by the generic product. Filing that certification is an act of intentional patent infringement under 35 U.S.C. 271(e)(2), which automatically gives the innovator the right to sue and, upon suing within 45 days, to impose a 30-month stay on FDA approval of the ANDA.
The economics of this litigation are well-documented. For cases where more than $25 million is at risk, median total litigation costs through trial and appeal reach $4 million. At the $10-25 million tier, median total costs run $2.7 million. These are median figures; complex multi-patent cases involving biologics or advanced drug delivery systems routinely exceed these benchmarks. The 30-month stay itself has economic value for the innovator: even if the innovator ultimately loses, it has purchased time during which no generic competition exists.
The 180-day market exclusivity period for the first-to-file Paragraph IV applicant is the central economic incentive organizing the entire system. During those six months, the FDA cannot approve any subsequent ANDA for the same drug. The result is a temporary duopoly: the first generic and the brand compete, with the generic typically entering at a 20-30% discount to the brand price, capturing substantial volume while still earning margins far above what would exist with five or ten generic competitors. For a drug with $2 billion in annual U.S. sales, the 180-day exclusivity window can generate $150-300 million in generic revenue for the first filer, depending on market share capture and pricing.
The empirical litigation record offers useful benchmarks. Generic companies win patent trials outright approximately 48% of the time. The broader ‘success rate’ including favorable settlements, dropped suits, and consent judgments where the brand company licenses generic entry is approximately 76%. This reflects the dominant resolution mechanism: negotiated settlements. These settlements most commonly involve the generic company agreeing to a specific licensed entry date in exchange for ceasing litigation and, in some cases, a payment or other commercial arrangement from the innovator, which has faced antitrust scrutiny under the Federal Trade Commission’s ‘pay-for-delay’ doctrine.
Key Takeaways
The 180-day exclusivity prize turns Paragraph IV litigation into a race, but the race has entry fees. The effective minimum budget for a meaningful patent challenge against a blockbuster is $4-8 million in direct litigation costs, before accounting for the cost of the ANDA preparation, the BE program, and the manufacturing scale-up required to actually launch. Generic companies without the balance sheet to sustain a multi-year litigation campaign against a well-capitalized innovator are effectively excluded from the first-to-file competition, leaving the field to larger players like Teva, Sandoz, Viatris, and Dr. Reddy’s.
Investment Strategy
For investors in generic pharma companies, a Paragraph IV filing is a positive event signal but not a binary value trigger. Assess: How many other filers are listed? (If this company is one of 10 Paragraph IV filers, the 180-day exclusivity prize may be shared or lost entirely.) What is the patent’s litigation track record in related cases? Does the company have manufacturing capacity and approval-ready facilities to actually launch on day one of exclusivity? The gap between filing a Paragraph IV certification and being positioned to launch on the first eligible day is where most of the value is won or lost.
Section II: The Regulatory Gauntlet — U.S. and EU Approval Pathways
2.1 The U.S. ANDA: Structure, Cost, and the QbR Framework
The Abbreviated New Drug Application is the regulatory vehicle for all small-molecule generic approvals in the United States. Created by the Hatch-Waxman Act in 1984, the ANDA allows a generic manufacturer to rely on the safety and efficacy data from the innovator’s original NDA rather than repeating the preclinical and clinical trial program. The generic’s job is to demonstrate that its product is pharmaceutically equivalent (same active ingredient, dosage form, route, and strength) and bioequivalent to the Reference Listed Drug (RLD).
The ANDA dossier is submitted to FDA’s Center for Drug Evaluation and Research (CDER) in electronic Common Technical Document (eCTD) format. The core components are: a complete chemistry, manufacturing, and controls (CMC) package covering the drug substance (API), drug product formulation, manufacturing process, and quality control specifications; bioequivalence data; proposed labeling identical to the RLD except for any carve-outs of patented indications; and Paragraph IV certifications for each relevant Orange Book-listed patent.
The FDA evaluates the CMC section using a Question-Based Review (QbR) framework, a science- and risk-based approach that organizes the review around specific technical questions about formulation design, manufacturing control, and product performance. The QbR framework pushes applicants to articulate the scientific rationale for their formulation choices rather than simply submitting data tables, which has the practical effect of raising the floor on the quality of ANDA submissions.
ANDA fees under the Generic Drug User Fee Amendments (GDUFA) are a material cost center. For fiscal year 2025, the initial ANDA filing fee is $321,920. Annual program fees and facility fees can push total annual GDUFA obligations for a medium-to-large generic company well above $1 million. These fees fund the FDA’s generic drug review capacity; GDUFA targets have progressively reduced average review times from a historical backlog of several years to a current target of roughly 10 months for original ANDAs submitted on or after October 1, 2017.
Key Takeaways
GDUFA fee structure creates a fixed overhead burden that disadvantages small generic companies pursuing low-volume drug targets. The economics of ANDA development have pushed the industry toward blockbuster targets, because the fixed costs of filing, litigation, and manufacturing qualification must be recovered against projected revenues. For niche or low-revenue drugs, the ANDA pathway is often economically non-viable without specialized market incentives.
2.2 The EU Framework: Marketing Authorisation, the 8+2+1 Rule, and Decentralised Strategy
The European generic approval landscape is structurally more complex than the centralized U.S. system. A Marketing Authorisation Application (MAA) for a generic medicine can follow several routes, each with distinct strategic implications.
The Centralised Procedure, overseen by the EMA, produces a single marketing authorization valid across all EU member states. It is mandatory for generics of drugs originally approved via the Centralised route and optional for others where there is a clinical or scientific justification for EU-wide authorization. The Decentralised Procedure (DCP) and Mutual Recognition Procedure (MRP) are the most common routes for generic drug approvals, allowing simultaneous registration across multiple selected member states with one state serving as Reference Member State (RMS) for the technical assessment. A purely national application covers a single member state.
The core scientific requirement is identical across all routes: the generic must have the same qualitative and quantitative composition of active substances and the same pharmaceutical form as the reference medicinal product, and must demonstrate bioequivalence through appropriate studies. The dossier is compiled in CTD format, creating alignment with U.S. submission structure that facilitates global regulatory programs.
The EU’s exclusivity framework operates under the ‘8+2+1’ rule. The generic MAA cannot be submitted during the first 8 years after the reference product’s initial EU authorization (data exclusivity). Even if approved, the generic cannot be placed on the market until 10 years have elapsed (market protection). This 10-year period extends to 11 years if the innovator obtains approval for a new therapeutic indication with significant clinical benefit during the first 8 years.
A critical strategic difference between the U.S. and EU systems: the EU has no direct equivalent to the 180-day first-filer market exclusivity. Generic entry timing in the EU is determined by the fixed 8+2+1 clock, not by the race-to-file dynamic that characterizes U.S. generic development. This makes EU generic strategy less litigation-intensive and more focused on efficient multi-country registration, selecting the right RMS, and ensuring early submission readiness as the data exclusivity period approaches its end.
The absence of a 180-day prize in the EU does not mean the EU market is less competitive. With 27 member states of varying size and price sensitivity, the EU generic market is large but fragmented. Companies that can achieve pan-European approval quickly through the DCP or Centralised Procedure and maintain manufacturing consistency across markets build durable market share advantages.
Key Takeaways
Global generic companies must maintain parallel regulatory strategies for the U.S. and EU that are essentially independent in their timing logic. U.S. strategy is driven by litigation milestones, Paragraph IV race dynamics, and 30-month stays. EU strategy is driven by the 8+2+1 clock and multi-country registration efficiency. Resource allocation across these two tracks is a strategic choice: companies that concentrate development spend on U.S. 180-day targets may underinvest in EU market readiness, and vice versa.
2.3 Bioequivalence: The Scientific Foundation and Its Limits
Bioequivalence is the regulatory shortcut that makes generic drug economics possible. By demonstrating that the generic drug delivers the same amount of active ingredient to systemic circulation at the same rate as the brand, regulators infer therapeutic equivalence without requiring new clinical trials. The standard pharmacokinetic parameters are Cmax (maximum plasma concentration, a measure of absorption rate) and AUC (area under the plasma concentration-time curve, a measure of total drug exposure).
The acceptance criterion is the 90% Confidence Interval (CI) for the geometric mean ratio of the test product to the reference product falling entirely within 80.00% to 125.00% for both parameters. This criterion is derived from a clinical equivalence argument: within this range, differences in bioavailability are unlikely to produce clinically meaningful differences in efficacy or safety for most drugs.
The standard study design is a two-period, two-sequence, crossover trial in 24-36 healthy adult volunteers, with a washout period between the two treatment periods long enough to eliminate the first dose before administering the second. Crossover designs are statistically efficient because each subject serves as their own control, controlling for inter-subject variability. Drugs with long half-lives that make a crossover impractical may use a parallel design.
The bioequivalence model has well-defined boundaries. It works well for systemically absorbed drugs where plasma concentration is a reliable surrogate for the drug’s effect at its pharmacological target. The model becomes unreliable or inapplicable for:
Locally acting drugs, including topical dermatologics, inhaled corticosteroids, ophthalmic solutions, and gastrointestinal agents where the intended site of action is not the systemic circulation. For these products, plasma levels are not a meaningful index of performance. Regulators require alternative evidence, including in vitro release tests (IVRT), in vitro permeation tests (IVPT), pharmacodynamic endpoint studies, or comparative clinical endpoint studies.
Highly variable drugs (HVDs), defined as APIs with intra-subject coefficient of variation (CV) greater than 30% for Cmax or AUC. Standard BE criteria may be inappropriately restrictive for HVDs, leading to BE study failures that are statistical artifacts rather than true formulation differences. The FDA accepts Reference-Scaled Average Bioequivalence (RSABE) for HVDs, widening the acceptance interval in proportion to the reference product’s own variability.
Narrow therapeutic index (NTI) drugs, where small differences in drug exposure can have clinically significant consequences. For these drugs, including warfarin, levothyroxine, and cyclosporine, the FDA applies tighter BE criteria (90% CI within 90.00% to 111.11%) and may require additional evidence.
Biowaivers exempt qualifying products from in vivo BE studies. They are available for parenteral solutions (where formulation effects on absorption do not apply), for BCS Class I drugs (high solubility, high permeability) with rapid dissolution characteristics, and often for additional strengths of a drug when the lowest or another strength has been demonstrated bioequivalent and certain formulation proportionality criteria are met. For complex products like topicals and inhalation drugs, biowaivers are available only when the applicant demonstrates Q1/Q2/Q3 sameness to the RLD.
Key Takeaways
The 80-125% BE window is a regulatory standard, not a scientific guarantee. For drugs with steep dose-response curves, narrow therapeutic windows, or local rather than systemic mechanisms of action, the standard BE paradigm requires modification or replacement. Generic developers targeting complex dosage forms must build their study designs around the regulatory pathway specific to the product category, not the default PK BE template.
Section III: Deformulation — The Analytical Science of Reverse Engineering
3.1 The Q1/Q2/Q3 Framework: What ‘Sameness’ Actually Requires
Deformulation is the analytical process of reverse engineering a finished drug product to determine its complete composition and the physicochemical properties of that composition. The objective is to decode not just the ingredient list but the full formulation blueprint well enough to reproduce the product’s performance. For complex generics, this blueprint must be decoded from physical evidence alone, since the innovator’s formulation and process details are trade secrets.
The FDA’s regulatory framework for what ‘sameness’ requires is captured in three levels:
Q1 (qualitative sameness) requires the generic to contain the same excipients as the RLD. Q2 (quantitative sameness) requires the amounts of each excipient to match the RLD within a narrow margin, typically ±5%. Q3 (physicochemical sameness) requires the generic’s microstructure, including the polymorphic form of the API, particle size distribution, morphology, and drug release mechanism, to match the RLD’s.
Q1 and Q2 are essentially ingredient verification exercises, technically demanding but conceptually straightforward. Q3 is the hard problem. Matching the RLD’s microstructure requires understanding how the innovator manufactured the product, because the manufacturing process determines the microstructure. This process deduction, conducted entirely from analysis of the finished product without access to the innovator’s process documentation, is the genuine intellectual challenge of pharmaceutical reverse engineering.
Achieving Q1/Q2/Q3 sameness matters economically because it is a prerequisite for certain regulatory shortcuts. For topical and ophthalmic complex generics, Q1/Q2/Q3 sameness is required to access a biowaiver and avoid expensive clinical endpoint studies. For injectable solutions, Q1/Q2/Q3 sameness can reduce or eliminate the clinical study package. These shortcuts can shave 12-24 months from development timelines and tens of millions from development costs.
3.2 API Characterization: Beyond Chemical Identity
The regulatory requirement that the generic API be ‘the same’ as the RLD’s API encompasses far more than molecular structure. It covers the API’s solid-state form, particle size distribution, surface area, and impurity profile, all of which can materially affect bioavailability, stability, and manufacturability.
Structural identity and purity are confirmed through a standard analytical panel. High-Performance Liquid Chromatography (HPLC) quantifies the API and resolves process-related impurities. Gas Chromatography (GC) measures residual solvents from the synthesis or purification process. Nuclear Magnetic Resonance (NMR) spectroscopy maps atomic connectivity and confirms the molecule’s three-dimensional structure. Mass Spectrometry (MS) provides precise molecular weight and, when coupled with LC (LC-MS/MS), enables identification of unknown impurity structures at trace levels. Fourier-Transform Infrared (FTIR) spectroscopy generates a vibrational fingerprint confirming chemical identity.
Solid-state characterization is where most of the scientifically and legally consequential work happens. Polymorphism refers to the ability of a molecule to crystallize in more than one distinct arrangement of atoms in the solid state. Each polymorph has the same chemical formula but different crystal packing, which produces measurable differences in melting point, solubility, dissolution rate, and stability. For a BCS Class II drug (low solubility, high permeability) like rivaroxaban, the polymorphic form directly controls the dissolution rate, which controls bioavailability. Formulating with the wrong polymorph can cause a bioequivalence failure that has nothing to do with the formulation design.
X-ray Powder Diffraction (XRPD) is the gold standard for polymorph identification. Each crystalline form produces a unique diffraction pattern that functions as a structural fingerprint. Differential Scanning Calorimetry (DSC) measures thermal events (melting, desolvation, phase transitions) that provide corroborating evidence for polymorph identity and can detect the presence of hydrates or solvates. Thermogravimetric Analysis (TGA) quantifies mass loss during heating, distinguishing surface moisture from stoichiometric hydrate water. Dynamic Vapor Sorption (DVS) characterizes the API’s hygroscopicity, relevant to both stability and manufacturing conditions.
Particle size analysis using laser diffraction is required for drugs where particle size affects dissolution or aerodynamic performance. For inhalation APIs, particle size determination by cascade impaction is required. For BCS Class II APIs with dissolution-rate-limited absorption, reducing particle size through micronization can substantially increase surface area and dissolution rate, but micronization also increases surface energy, raising the risk of agglomeration and stability issues.
The solid-state analysis of the RLD’s API sits at the intersection of science and law. Polymorphism is a primary evergreening tool: innovators patent multiple polymorphs, and the generic developer must replicate the specific form in the RLD. If that form is patented, the generic either develops a non-infringing polymorph (which may have different bioavailability) or challenges the polymorph patent, adding to the litigation burden.
Key Takeaways
API ‘sameness’ is a multi-dimensional characterization problem, not a chemical identity check. The solid-state form, particle size, and impurity profile must all be matched with specificity. Generic developers should conduct solid-state characterization of the RLD early in the development timeline, before committing to an API source, to ensure the API supplier’s material matches the RLD’s polymorphic form and particle size specifications.
3.3 Excipient Decoding: Function, Identification, and Process Inference
Excipients are the functional architecture of a drug product. They are not inert. In a modified-release tablet, the rate-controlling polymer controls the drug’s dissolution profile directly. In an emulsion injectable, the lipid excipient determines the drug’s physical stability and in vivo release behavior. In a dry powder inhaler, the lactose carrier particle size and morphology control how the API separates during inhalation and where it deposits in the lungs. Replicating these functional roles requires identifying not just which excipients are present but which grades, which molecular weight distributions, and which physical forms.
Identification uses orthogonal analytical methods to cross-validate assignments. HPLC and HPLC-MS separate and identify organic excipients including polymer binders (e.g., hydroxypropyl methylcellulose, polyvinylpyrrolidone), surfactants (e.g., polysorbate 80, sodium lauryl sulfate), and preservatives. FTIR and Raman spectroscopy identify functional groups across the full excipient matrix, often using library matching against reference spectra. Raman microscopy can map excipient distribution within tablet cross-sections at the micron scale, revealing spatial arrangement without destroying the sample. Gel Permeation Chromatography (GPC) characterizes the molecular weight distribution of polymeric excipients, which governs their viscosity and release-controlling function. Ion Chromatography detects inorganic excipients like mineral acids, bases, and buffer salts.
Process inference from the finished product is the most analytically demanding part of deformulation. The goal is to deduce the innovator’s manufacturing method from physical evidence alone. Scanning Electron Microscopy (SEM) imaging of a crushed tablet core reveals the granule structure. Distinct, well-formed granules with smooth surfaces indicate a granulation process rather than direct compression of a powder blend. The internal structure of those granules, visible in cross-sectional SEM, provides further clues: dense, porous-free granules suggest high-shear wet granulation; more open, irregular granules suggest fluid-bed granulation or dry granulation (roller compaction).
GC-MS analysis of volatile residues in the tablet provides chemical evidence for the manufacturing process. Trace quantities of a specific solvent (ethanol, acetone, water) confirm that a wet granulation process was used and identify the binder vehicle. The combination of SEM morphology and residual solvent analysis can, in favorable cases, uniquely identify the granulation process type. Tablet hardness measurements on granules recovered from the crushed RLD can provide additional data on granule compressibility, which varies with granulation method. Disintegration behavior of isolated granules in dissolution media gives functional evidence about the granule’s contribution to the overall dissolution mechanism.
This process deduction matters because Q3 sameness, matching the RLD’s microstructure, typically requires replicating the manufacturing process. A tablet produced by direct compression will not have the same internal microstructure as one produced by wet granulation, even if the ingredients are identical. The dissolution profile will differ. That difference may or may not cause a bioequivalence failure, but for complex modified-release systems where the release mechanism depends on the granule’s internal architecture, process replication is usually necessary to achieve dissolution profile matching.
Technique
Primary Analytical Role
Information Yielded
HPLC
API and excipient quantification
Purity, concentration, impurity profile
GC-MS
Volatile compound identification
Residual solvents, process solvent evidence
LC-MS/MS
Trace impurity identification
Unknown impurity structures, molecular weight
NMR
Structural elucidation
Atomic connectivity, three-dimensional structure
FTIR
Chemical identification by vibrational fingerprint
API and excipient identity, interactions
Raman Microscopy
Spatially resolved chemical mapping
Excipient distribution within tablet microstructure
XRPD
Polymorph identification
Crystalline form, degree of crystallinity
DSC
Thermal event characterization
Melting point, polymorphs, hydrates, API-excipient interactions
Granule morphology, clues to manufacturing process
GPC
Polymer molecular weight characterization
Molecular weight distribution of polymeric excipients
Laser Diffraction
Particle size measurement
Particle size distribution of API and excipients
Key Takeaways
Excipient deformulation requires a panel of orthogonal techniques, not a single analytical method. The grade and molecular weight of polymeric excipients, not just their identity, determines their functional contribution and must be matched. Process inference from physical evidence is the analytical bridge between Q1/Q2 ingredient matching and Q3 microstructure matching, and it requires an integrated reading of multiple data streams from SEM imaging, residual solvent analysis, granule mechanical testing, and dissolution behavior.
3.4 Deformulation in Practice: Rivaroxaban (Xarelto) Extended-Release Tablets
Rivaroxaban, marketed by Bayer and Janssen as Xarelto, is a Factor Xa inhibitor used for anticoagulation. It is a BCS Class II molecule (low aqueous solubility, high permeability), which means its oral bioavailability depends critically on dissolution rate. The approved tablet is an immediate-release formulation, but achieving consistent absorption across the 10 mg and 20 mg doses requires careful particle size control and formulation design. The dose-dependent food effect of rivaroxaban (the 20 mg dose must be taken with food to achieve adequate bioavailability) reflects the drug’s dissolution-rate-limited absorption.
Step one in deformulation is complete characterization of the RLD: weight, dimensions, hardness, friability, and disintegration time across multiple commercial lots from different manufacturing dates. A full dissolution profile is generated in four or more biorelevant media (simulated gastric fluid without pepsin, simulated intestinal fluid, buffer at pH 4.5, and buffer at pH 6.8) to map the dissolution behavior across the gastrointestinal pH range. This profile is the performance benchmark.
Step two addresses the film coating, which is removed by controlled abrasion and analyzed separately by HPLC-MS and FTIR to identify and quantify the coating polymer, plasticizer, pigment, and any functional coating agents. The core tablet is then crushed and submitted to a systematic solvent extraction sequence designed to fractionate API and excipients by polarity. HPLC-MS identifies and quantifies rivaroxaban and soluble organic excipients including binder polymers and surfactants. Insoluble residues are analyzed by FTIR and Raman spectroscopy to identify fillers, binders, and disintegrants. GPC characterizes the molecular weight distribution of any polymeric binders identified.
Step three addresses Q3: manufacturing process deduction. SEM imaging of cross-sections of the crushed tablet core reveals whether granules are present and characterizes their morphology. In the case of Xarelto, the tablet is known to incorporate a co-precipitation approach where rivaroxaban is combined with microcrystalline cellulose in a specific processing step to overcome the drug’s poor solubility. GC-MS analysis of volatile residues provides supporting evidence for the solvents used in any wet processing step.
Step four is formulation prototyping. The development team formulates prototype batches using the decoded Q1/Q2 composition and the inferred Q3 process parameters. Dissolution profiles of prototypes are compared directly to the RLD benchmark. The gap between the prototype and the benchmark is the optimization target: process parameters (granulation endpoint, binder addition rate, drying temperature, compaction force) are systematically varied across a Design of Experiments (DoE) framework until the prototype’s dissolution profile overlaps with the RLD’s within pre-specified limits. This dissolution match gives high confidence that the formulation will pass the in vivo bioequivalence study.
The IP dimension of this work is inseparable from the science. Janssen holds a substantial Orange Book patent estate for Xarelto covering the tablet formulation, the specific particle size of rivaroxaban, and co-precipitation manufacturing methods. A generic developer who successfully decodes the formulation and process must simultaneously assess whether their chosen approach reads on any of these patents. Developing a formulation that is both dissolution-equivalent and non-infringing sometimes requires deliberate formulation departure from the Q3 blueprint, which then must be reconciled with the dissolution matching requirement. This is where pharmaceutical science and IP strategy merge into a single problem.
Section IV: Complex Generics and Biologics — The High-Barrier Frontier
4.1 Complex Dosage Forms: Why Standard ANDA Logic Fails
The term ‘complex generic’ encompasses products where the standard ANDA framework, built around oral solid immediate-release doses with standard PK bioequivalence, does not apply cleanly. The FDA’s Office of Generic Drugs has produced a growing library of product-specific guidance documents (PSGs) for complex generics, and these PSGs are where the practical regulatory requirements live. The existence of a PSG for a product does not mean the regulatory pathway is simple; in many cases, the PSGs specify study requirements that approach the complexity of an NDA.
Parenteral formulations (injectables, infusions, suspensions) are sterile products that enter the body directly. The manufacturing challenge is establishing and validating the aseptic processing capability required to ensure sterility and the absence of bacterial endotoxins. Aseptic manufacturing requires purpose-built cleanroom facilities with rigorous environmental monitoring programs, validated sterilization processes (autoclaving, filtration, aseptic fill-finish), and container-closure integrity testing. The capital cost of a compliant aseptic manufacturing facility is measured in hundreds of millions of dollars, creating a physical infrastructure barrier independent of the scientific complexity of the formulation.
Topical and transdermal products act locally on the skin. Standard PK BE studies are irrelevant because the drug is not intended to reach systemic circulation in meaningful amounts. For semi-solid topicals (creams, ointments, gels), the FDA’s approach requires Q1/Q2/Q3 sameness, supplemented by in vitro release testing (IVRT) and, for some molecules, in vitro permeation testing (IVPT) through human cadaver skin or artificial membranes. For reference products with complex microstructures (emulsions, liposomal creams), demonstrating Q3 microstructural sameness requires extensive physicochemical characterization including dynamic light scattering, laser diffraction, rheology, and microscopy.
Inhalation products are drug-device combinations where the aerosol performance of the device is as important as the drug formulation. A metered-dose inhaler (MDI) or dry powder inhaler (DPI) must deliver the correct dose with an aerosol particle size distribution that deposits the drug in the target airways rather than impacting in the oropharynx. Aerodynamic particle size distribution is measured by cascade impaction (Andersen Cascade Impactor or Next Generation Impactor). The generic device must produce an aerosol characterizable as the same as the reference device across the full range of aerodynamic parameters: fine particle fraction, mass median aerodynamic diameter (MMAD), and geometric standard deviation (GSD). Achieving device equivalence may require reverse engineering not just the formulation but the inhaler’s internal geometry, valve mechanics, and actuator design, which carry their own device patents.
Key Takeaways
Complex generic development costs and timelines are nonlinear with dosage form complexity. A topical cream program may cost $10-25 million and take 4-6 years. An inhalation product program may cost $50-100 million and take 6-10 years, approaching biosimilar development expense. The key risk management tool is early engagement with the relevant FDA product-specific guidance and, where no PSG exists, early pre-ANDA meetings with CDER to align on the regulatory package required.
4.2 Biologics and Biosimilars: Where Process Is Product
Biologics are large-molecule drugs produced by or derived from living organisms. The commercially dominant class is monoclonal antibodies (mAbs), with additional categories including fusion proteins, cytokines, hormones, enzymes, and cell and gene therapy products. The defining characteristic of a biologic is structural complexity that cannot be fully characterized by a single analytical method and cannot be replicated by copying a synthesis protocol.
A monoclonal antibody like adalimumab has a molecular weight of approximately 148,000 daltons, compared to roughly 300-600 daltons for a typical small-molecule drug. Its primary structure (amino acid sequence) is defined by the genetic construct in the production cell line. Its higher-order structure (secondary, tertiary, quaternary folding) is determined by the three-dimensional arrangement of that sequence. Its post-translational modifications (PTMs) including N-linked and O-linked glycosylation, deamidation, oxidation, and disulfide bond patterns are determined by the cell culture conditions in the bioreactor. These PTMs are not genetically encoded; they are a product of the manufacturing process. They vary across cell lines, across bioreactor scales, across growth media formulations, and across purification process designs.
Because PTMs affect both the drug’s biological function (glycosylation patterns influence Fc receptor binding, complement activation, and half-life) and its immunogenicity risk (aberrant glycoforms or aggregates can trigger anti-drug antibody responses), the specific PTM profile of a biologic is a critical quality attribute (CQA). A biosimilar manufacturer cannot copy those PTMs by copying the product; they must reverse-engineer a manufacturing process that produces an acceptably similar PTM profile using their own cell line and bioprocess.
This is the foundational reason why biosimilar development costs $100-200 million compared to $2-5 million for a small-molecule generic, and why development timelines run 7-9 years compared to 2-4 years. The biosimilar developer must establish and optimize their own production cell line (typically derived from Chinese Hamster Ovary or CHO cells), develop and characterize upstream bioprocess conditions (seed train, bioreactor process parameters, feeding strategy), design a purification process (typically protein A capture, followed by ion exchange and hydrophobic interaction chromatography steps), and demonstrate that this entirely proprietary manufacturing process produces a molecule that is analytically highly similar to the innovator’s reference product.
Characteristic
Small-Molecule Generic
Biosimilar
Molecular weight
~300-600 Da
~100,000-200,000+ Da
Manufacturing route
Chemical synthesis
Living cell culture
Replicate standard
Identical chemical entity
Highly similar but not identical
Key similarity proof
Bioequivalence (PK)
Totality-of-the-evidence
Development cost
~$2-5 million
~$100-200 million
Development timeline
2-4 years
7-9 years
Typical launch discount
80-90%
15-40%
Key analytical challenge
Polymorph, dissolution
Higher-order structure, PTM profile
Investment Strategy
The smaller price discount for biosimilars relative to small-molecule generics is not solely a function of development cost. Market structure matters equally. The Humira market, for example, reached $22 billion in U.S. net sales at peak before biosimilar entry. With seven biosimilars approved by 2023, AbbVie retained formulary position through aggressive rebate contracting even as biosimilar market share grew. Portfolio managers modeling biosimilar revenue should account for both the direct discount from launch price and the market share trajectory, which depends heavily on pharmacy benefit manager formulary decisions, interchangeability designation status, and the innovator’s rebating strategy.
4.3 Biosimilar Analytical Similarity: The Totality-of-the-Evidence Standard in Detail
The FDA’s totality-of-the-evidence framework for biosimilar approval is operationally a hierarchical evidence pyramid. The more complete and robust the analytical characterization at the base of the pyramid, the less clinical data is needed at the apex. This risk-based structure has significant development cost implications: a biosimilar program with a very strong analytical package may be able to reduce the scope of its comparative clinical trial or, in limited cases, rely on PK/PD studies alone without a separate efficacy trial.
The analytical characterization package is the foundation. It encompasses:
Primary structure confirmation: Peptide mapping with liquid chromatography-mass spectrometry (LC-MS) to confirm identical amino acid sequence and detect any sequence variants. Complete sequence verification by multi-dimensional MS.
Higher-order structure (HOS) characterization: Multiple orthogonal biophysical methods must be used because no single technique resolves all aspects of protein conformation. Circular Dichroism (CD) spectroscopy measures secondary structural content (alpha-helix, beta-sheet fractions). FTIR spectroscopy provides complementary secondary structure information. Fluorescence spectroscopy probes the tertiary structure environment of aromatic amino acids. Hydrogen-Deuterium Exchange Mass Spectrometry (HDX-MS) characterizes conformational dynamics and solvent accessibility across the molecule. For mAbs, crystallography or cryo-electron microscopy may provide direct structural comparison, though these are research-grade tools rather than routine lot release methods.
Post-translational modifications: Advanced glycan analysis is particularly critical. Released glycan profiling by HPLC or capillary electrophoresis, site-specific glycosylation by LC-MS/MS peptide mapping, and monosaccharide composition analysis together characterize the glycan structures at each glycosylation site. Differences in glycan composition, particularly in fucosylation levels (which affects ADCC activity) and sialylation (which affects half-life and anti-inflammatory activity for IgG Fc glycans), can have clinical relevance and will receive intense regulatory scrutiny. Additional PTMs surveyed include deamidation (asparagine and glutamine), oxidation (methionine, tryptophan), pyroglutamate formation at N-terminal glutamine residues, and disulfide bond assignments.
Biological function: In vitro binding assays confirm that the biosimilar binds its target antigen and effector ligands (e.g., FcRn, FcgRIIIa, C1q) with equivalent affinity and kinetics, measured by SPR or ELISA. Cell-based potency assays confirm that binding translates to equivalent biological activity: for a TNF inhibitor like adalimumab, this means demonstrated TNF-alpha neutralization in a cell-based reporter assay.
Purity and impurity profile: Size-Exclusion Chromatography (SEC-HPLC) quantifies high-molecular-weight species (aggregates) and low-molecular-weight species (fragments). Ion-Exchange Chromatography (IEX-HPLC) resolves charge variants from deamidation, sialylation, and other modifications. Imaging Capillary Isoelectric Focusing (iCIEF) provides high-resolution charge variant profiling. Aggregate content receives particular regulatory attention because of its association with immunogenicity risk.
The EMA’s biosimilar guideline framework, in place since 2006 and continuously revised, takes a similar tiered approach. The EMA has approved more than 90 biosimilars as of 2025, giving it the longest track record of any regulatory authority with the framework. One area of ongoing regulatory divergence: the FDA’s interchangeability designation, which allows pharmacists to substitute a biosimilar for the reference product without prescriber intervention, has no direct EU equivalent. In the EU, interchangeability decisions are made at the national level, creating a fragmented landscape where a biosimilar may be substitutable in France but not Germany for the same indication.
Key Takeaways
The analytical similarity package for a biosimilar submission is not a formality. It is the primary evidence base for the regulatory approval decision and typically runs to thousands of pages of characterization data covering multiple commercial-scale manufacturing lots. The investment required to build this package, including the cost of acquiring and characterizing reference product from global markets across multiple years of the development program, is one of the major structural cost components of biosimilar development.
Section V: The Computational Turn — Virtual Bioequivalence and AI-Driven Formulation
5.1 Physiologically Based Pharmacokinetic Modeling and Virtual Bioequivalence
The traditional BE study costs $500,000 to $2 million per study, takes 6-18 months to plan and execute, and requires dosing human subjects. For complex generics where multiple BE studies may be needed to optimize the formulation before reaching a pivotal study, the cumulative cost and time can rival the analytical phase. Physiologically Based Pharmacokinetic (PBPK) modeling offers a computational alternative that can reduce the number of human studies required, optimize formulation design before manufacturing physical batches, and in some cases support a biowaiver application.
PBPK models represent the human body as a system of interconnected physiological compartments: gut lumen, intestinal epithelium, portal vein, liver, systemic circulation, and peripheral tissues. Each compartment has physiologically realistic volume, perfusion, and enzyme expression parameters. Drug input is modeled as a function of the formulation’s dissolution characteristics and the drug’s physicochemical properties (solubility, permeability, lipophilicity, ionization). The model simulates the drug’s full ADME trajectory from oral ingestion through elimination, producing a predicted plasma concentration-time profile.
Certara’s Simcyp simulator and Simulations Plus’s GastroPlus are the leading commercial PBPK platforms used in regulatory submissions. Both platforms incorporate virtual population libraries that represent the pharmacokinetic variability of diverse patient populations, enabling statistical comparisons of simulated PK parameters between test and reference formulations. The FDA has accepted PBPK models as supporting evidence for biowaivers for specific products and dissolution specifications since at least 2017, and the regulatory acceptance has expanded as the scientific literature and model validation data have grown.
Virtual Bioequivalence (VBE) uses PBPK simulation to conduct a BE study computationally, testing hundreds of virtual formulation variants against the RLD’s simulated PK profile to identify the formulation parameters most likely to yield clinical bioequivalence. This capability is most powerful for BCS Class II drugs where the dissolution rate is the primary driver of absorption: the PBPK model makes the relationship between in vitro dissolution and in vivo PK explicit, allowing in vitro dissolution specifications to be validated against simulated human PK.
The first FDA approval of a complex topical generic using a PBPK-supported biowaiver in place of a traditional clinical endpoint study established regulatory precedent. The FDA’s 2021 guidance on PBPK analysis for pediatric studies and its 2022 guidance on leveraging real-world data for drug development both reflect the agency’s broadening acceptance of model-informed drug development. The EMA has published similar guidance supporting PBPK use in marketing authorization applications.
Key Takeaways
PBPK modeling is not a substitute for all in vivo studies. Its regulatory acceptance is currently highest for BCS Class I/III drugs (biowaivers), for supporting dissolution specification setting, for predicting drug-drug interactions, and for some pediatric dose extrapolations. For BCS Class II generics with complex formulation designs, PBPK-informed VBE can reduce the number of clinical BE studies required from four or five optimization rounds to one or two, with significant cost and timeline implications.
Investment Strategy
Generic companies with established PBPK modeling capabilities, including validated virtual population libraries and regulatory submission experience with PBPK-supported biowaivers, have a structural development cost advantage for BCS Class II complex generics. This capability is increasingly a competitive differentiator as the generic pipeline shifts toward more difficult dosage forms where traditional BE optimization cycles are expensive. Analysts evaluating generic company R&D efficiency should ask whether the company uses PBPK routinely in formulation development or only episodically.
5.2 Machine Learning in Formulation Development and Regulatory Automation
Machine learning models applied to pharmaceutical formulation development operate primarily in two modes: predictive modeling using historical formulation datasets to predict outcomes (dissolution, stability, processability) for new formulations, and generative modeling to propose novel formulation designs meeting specified performance criteria. Both modes require training data, which is the primary constraint in pharmaceutical applications because experimental datasets are small compared to the feature space of possible formulations.
In practice, ML formulation models are most useful for:
Excipient compatibility prediction: Models trained on literature and experimental data predict the probability of physicochemical incompatibility between a given API and candidate excipients, based on molecular descriptors and known interaction mechanisms. This narrows the excipient selection space before any wet chemistry is performed.
Dissolution model optimization: Given a target dissolution profile matching the RLD, ML models can propose formulation parameters (excipient concentrations, particle sizes, process conditions) predicted to achieve that profile, supplemented by Gaussian Process models that quantify prediction uncertainty. These predictions are then tested experimentally, with the results fed back into the model to improve subsequent predictions. This active learning loop can substantially reduce the number of experimental batches needed to achieve the dissolution target.
Stability accelerated testing extrapolation: ML models trained on ICH degradation pathway data for structurally similar compounds can predict degradation kinetics and identify likely degradation products under accelerated stability conditions, allowing more targeted analytical monitoring during stability studies.
Regulatory affairs automation is a separate and increasingly productive application area. The ANDA and MAA dossiers are large, structured documents with defined section types, table formats, and data requirements. Natural Language Processing (NLP) models can be trained to automate the generation of routine sections (e.g., batch analysis summaries, method validation tables, reference product characterization narratives) from raw analytical data. These models do not replace regulatory writers; they automate the mechanical tasks that consume the bulk of a regulatory writer’s time, redirecting human effort toward the strategic content, argumentation, and agency communication that require expert judgment.
Predictive information request (IR) modeling uses ML trained on historical FDA review correspondence to predict the questions most likely to be raised during the ANDA review. A model trained on thousands of complete-response letters and information requests can identify which sections of a specific ANDA are highest-risk for reviewer queries and suggest proactive additions to the submission that address those questions before they are asked. Reducing the number of IR cycles in the review process directly reduces time to approval: each IR cycle typically adds 3-6 months to the review timeline.
The FDA’s internal posture on AI/ML in regulatory submissions has shifted from cautious to actively engaged. The agency’s CDER AI Council coordinates regulatory science around AI-enabled development. The January 2025 draft guidance on AI in regulatory decision-making establishes a risk-proportionate framework: AI tools that inform (but do not replace) human review decisions are subject to less stringent validation requirements than AI tools that make autonomous determinations. The FDA’s February 2025 action plan for AI in CDER commits to publishing additional guidance documents on specific AI applications in drug development through 2026.
Key Takeaways
The generic industry’s largest operational cost driver is not development science but the end-to-end regulatory process: ANDA preparation, review cycles, facility inspections, and approval management. AI-driven automation of routine regulatory tasks does not reduce the science required, but it reduces the labor cost and timeline of converting scientific data into an approvable dossier. Companies that build internal AI capabilities for regulatory automation gain a structural throughput advantage that compounds across a large ANDA portfolio.
5.3 Industry Outlook: Structural Tailwinds, Persistent Barriers, and What Separates Winners
The generic and biosimilar industry’s structural growth case is straightforward: the patent cliff through 2030 unlocks $200-300 billion in annual branded drug revenues; global healthcare systems are under sustained cost pressure; aging populations in high-income countries drive volume; and access demand in middle-income markets is growing. The generic drug market is projected to reach $728-926 billion by 2034 across analyst forecasts, with biosimilars representing the fastest-growing segment.
Against these tailwinds sit structural barriers that have not diminished and in some cases have intensified.
Patent thicket complexity is increasing as innovators become more sophisticated in post-launch filing strategy, particularly for biologics. The average number of Orange Book-listed patents per new molecular entity has grown steadily over the past two decades. For biologics with 12-year BPCIA exclusivity and a biologics-specific patent dance procedure requiring sequential patent disclosure and negotiation before litigation, the legal pathway to market is more complex than the small-molecule equivalent.
Biosimilar market uptake in the U.S. has been slower than structural conditions alone would predict. The Humira biosimilar market provides the clearest data point: despite seven approved biosimilars by 2023 priced at 5-85% discounts to the reference product, AbbVie maintained dominant market share through aggressive rebate contracting with pharmacy benefit managers. The rebate system creates an incentive misalignment where PBMs earn larger rebates from higher-priced branded biologics, reducing their financial motivation to drive formulary substitution to lower-cost biosimilars. Interchangeability designations partially address this by enabling automatic substitution at the pharmacy, but they require additional clinical switching studies and are not available for all biosimilar products.
Supply chain resilience is an escalating operational requirement. The API manufacturing base for most small-molecule generics is concentrated in India and China. U.S. regulatory and legislative attention to supply chain diversification, driven by drug shortage events and national security concerns, is creating new compliance obligations and potential cost pressures for generic manufacturers with concentrated API sourcing. Companies investing in API manufacturing diversification or vertical integration will carry higher near-term costs but lower supply disruption risk.
Manufacturing complexity for complex generics and biosimilars requires capital investment at a scale that constrains competitive entry. A compliant aseptic injectable facility costs $300-500 million to build and validate. A biologics manufacturing facility capable of clinical and commercial-scale mAb production costs $400 million to over $1 billion. These capital requirements limit the field of credible competitors for complex generic and biosimilar targets to a small set of well-capitalized companies, which moderates competitive intensity and sustains margins even after multiple market entrants.
The firms that will lead the next decade of generic and biosimilar development share a recognizable profile: deep analytical science capability across both small-molecule and large-molecule platforms, computational modeling integration across formulation development and regulatory affairs, established litigation infrastructure for Paragraph IV challenges, aseptic manufacturing capacity, and global regulatory expertise across the U.S., EU, and at least two additional major markets. These are not scale advantages alone. They are capability advantages that take years to build and cannot be acquired simply by increasing the development budget.
Key Takeaways
The generic industry’s growth case is real, but the value capture within that growth is highly concentrated. Commoditized oral solid generics with five or more approved ANDAs produce thin margins. Complex generics, first-to-file 180-day exclusivity positions, and biosimilars with interchangeability designations produce substantially higher returns. The commercial imperative for generic companies is to move up the complexity curve and build the scientific, legal, and manufacturing capabilities that sustain a position in those higher-margin segments.
Investment Strategy
Screen generic and biosimilar companies against four capability dimensions: Paragraph IV pipeline activity and litigation track record (measuring legal sophistication and risk appetite); complex generic and biosimilar product share as a percentage of revenue (measuring portfolio positioning); PBPK and AI adoption in development workflows (measuring development efficiency); and aseptic/biologic manufacturing capacity as a percentage of total manufacturing footprint (measuring structural readiness for the highest-barrier products). Companies scoring well across all four dimensions are positioned to compound value through the 2025-2030 LOE wave. Companies concentrated in commoditized oral solids face sustained margin compression.
This analysis draws on publicly available regulatory guidance from the FDA and EMA, published litigation records, peer-reviewed pharmaceutical science literature, and industry market data. It is intended for informational purposes for pharmaceutical industry professionals and does not constitute legal, regulatory, or investment advice.