In the first half of 2026, biopharma buyers closed roughly $130 billion to $196 billion in M&A across more than 30 billion-dollar transactions, the strongest opening half for the sector since before the pandemic [1][2]. None of those deals were the $40 billion megamergers that defined 2019 or 2023. The largest, Boston Scientific’s acquisition of Penumbra, closed at $14.5 billion. Sun Pharma paid $11.75 billion for Organon. AbbVie paid $10.9 billion for Apogee Therapeutics. GSK paid $10.6 billion for Nuvalent [3][4].
This is not a slowdown. It is a change in shape. Big Pharma is still racing against a patent cliff that puts an estimated $170 billion to $305 billion of branded revenue at risk of loss of exclusivity (LOE) through 2030-2032, depending on the analyst’s scope and time horizon [5][6][7]. What has changed is how that capital gets deployed, and what a “correct” valuation now has to account for. A model built for the 2019-2023 environment, when the question was whether to spend $40 billion or $80 billion on a platform, is the wrong tool for a market where the median deal is a $1 billion to $15 billion bolt-on for a single de-risked asset.
This article builds on the established core methodology for pharma and biotech valuation, the discounted and risk-adjusted cash flow framework built around probability of success, discount rate, and effective exclusivity, and updates it with what has actually happened in 2025 and 2026: a record bolt-on wave, an executive order and pending legislation aimed at rewriting the Inflation Reduction Act’s small-molecule penalty, and a patent cliff that is now naming names (Keytruda, Opdivo, Eliquis, Prevnar 13) rather than remaining an abstract statistic.
The Patent Cliff, By the Numbers
Analysts do not agree on a single figure for the coming cliff, because they disagree on scope and time horizon, but the direction and magnitude are consistent across every major bank and consultancy tracking it.
Source
Revenue at risk
Time horizon
Basis
IQVIA (January 2026 outlook)
$230 billion+
Through 2030
Up to 65% of some large-cap pharma’s current sales exposed to LOE [5]
Mondaq / law-firm M&A trend analysis (2026)
$305 billion
Next 6-7 years
Cited catalyst for H1 2026 dealmaking surge [2]
PitchBook, cited by CNBC (January 2026)
$170 billion
Near-term cliff
Framed as one of the best biotech buying windows in decades [7]
Foley & Lardner (2025)
Hundreds of billions
2026-2030 “super-cliff”
Named exposures: Keytruda, Opdivo, Eliquis, Prevnar 13 [6]
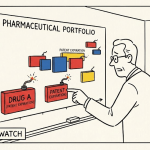
What this means: whichever number an analyst uses, it dwarfs any single acquisition. Merck alone faces a Keytruda exposure that reportedly represents close to half its total revenue once biosimilar-style competitors and follow-on immuno-oncology combinations erode its share after loss of exclusivity later this decade. No single $10-15 billion bolt-on closes a gap that size. That mismatch, gap in the tens of billions, deals in the low tens of billions, is the central fact governing 2026 valuation work: acquirers are not trying to replace one patent cliff with one deal. They are running a portfolio-construction exercise across a dozen or more assets simultaneously, which changes how each individual asset should be priced.
The 2026 Bolt-On Wave: What the Data Shows
The clearest empirical break from the prior cycle is deal size. Comparing named transactions from the first seven months of 2026 against the era-defining megadeals of 2011-2023 shows the shift plainly.
Deal
Value
Announced
Category
Boston Scientific – Penumbra
$14.5 billion
January 2026
Medical device / thrombectomy
Sun Pharma – Organon
$11.75 billion
April 2026
Women’s health and specialty generics
AbbVie – Apogee Therapeutics
$10.9 billion
June 2026
Inflammatory and immunological disease biologics
GSK – Nuvalent
$10.6 billion
June 2026
Oncology, non-small-cell lung cancer
Vertex – Crinetics
$10 billion
2026
Endocrine disease
Danaher – Masimo (patient monitoring)
$9.9 billion
February 2026
Diagnostics / life sciences tools
Merck – Terns Pharmaceuticals
~$6.7 billion
March 2026
Clinical-stage oncology
Biogen – Apellis Pharmaceuticals
$5.6 billion
May 2026
Kidney and complement-mediated disease
Source: compiled from company disclosures reported in trade press [3][4][8][9]. For comparison (historical, not part of the 2026 dataset): Pfizer’s 2023 acquisition of Seagen was $43 billion and Gilead’s 2011 acquisition of Pharmasset was $11 billion [10].
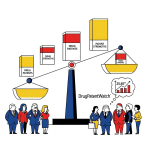
As original analysis: the eight 2026 deals listed above average approximately $10 billion each, versus a single $43 billion outlay for Seagen in 2023. That is a portfolio strategy, not a bet-the-company strategy. Eli Lilly alone reportedly closed more than $25 billion across five separate acquisitions in the same window, spreading its patent-cliff hedge across cell and gene therapy platforms (Orna Therapeutics, Kelonia Therapeutics) rather than concentrating it in one asset [4]. For a valuation team, the implication is direct: comparable-transaction analysis built on 2019-2023 “megadeal” precedents will systematically overstate what a single 2026-era target should command, because the buyer’s alternative is not “do this deal or do nothing,” it is “do this deal or do three smaller ones instead.”
Why the Standard Valuation Toolkit Still Applies, With One New Constraint
The underlying mechanics of pharma valuation have not changed: cost-based valuation remains close to useless for pipeline assets, market comparables serve as a sanity check, and risk-adjusted net present value (rNPV) remains the workhorse for anything without approved-product cash flows. The formula is unchanged:
rNPV = Σ [(Expected Cash Flow in Year t × Probability of Success) / (1 + r)^t]
Two of the three inputs, phase-based probability of success and stage-adjusted discount rate, are documented in industry literature and worth restating as a reference table, because they are the numbers most frequently misapplied in negotiations.
Development phase
Cumulative probability of success to approval
Typical discount rate (WACC)
Preclinical
~8%-10%
~17.7%
Phase I
~11.8%
13.3%-13.6%
Phase II
~20%
13.3%-13.6%
Phase III
~56%
13.3%-13.6%
NDA/BLA submission
~90%
~8.7%
Approved / marketed
100%
~8.7%
Figures reflect industry-standard estimates compiled in prior biotech-asset valuation literature [11][12]; treat these as reference starting points, not universal constants, since actual success rates vary meaningfully by therapeutic area and modality.
The most common technical error remains applying both a low phase-specific probability of success and a high, VC-style hurdle rate on top of it. Probability of success already prices the scientific, diversifiable risk that a trial fails; the discount rate should price only the systematic, non-diversifiable market risk. Combining a sub-12% probability of success with a 30%-50% discount rate double-counts risk and produces valuations that are defensibly too low, which is one reason startups and their prospective acquirers frequently arrive at very different numbers for the same asset.
The new constraint layered on top of this in 2026 is capital discipline. With roughly $196 billion already spent in six months against a $305 billion cliff, buyers are visibly rationing bolt-on capacity across therapeutic areas rather than paying up for any single asset regardless of comparables. A target’s rNPV can be scientifically sound and still fail to close a deal if it does not fit an acquirer’s stated 2026-2027 portfolio slots (oncology ADCs, obesity/metabolic, immunology, cell and gene therapy platforms all show up repeatedly across named 2026 transactions [4][9]).
Modeling the Exclusivity Clock: Patents, Litigation, and the Orange Book
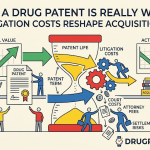
The single most sensitive input in any rNPV model is t, the number of years of protected cash flow. That protection comes from two independent sources: a 20-year, litigation-contestable patent term from the USPTO, and a statutory, date-certain regulatory exclusivity period from the FDA that runs on its own clock regardless of patent status.
Litigation outcomes materially discount the “face value” of a patent term. In ANDA (generic) litigation, brand-side win rates have historically run around 25%; in Patent Trial and Appeal Board proceedings specifically challenging Orange Book patents, the patent owner has historically prevailed closer to 61% of the time. A defensible rNPV model treats the tail years of a patent term as probability-weighted rather than guaranteed.
Regulatory exclusivity is often the more reliable protection, precisely because it cannot be invalidated in court the way a patent can:
New Chemical Entity exclusivity: 5 years for a novel small molecule
Orphan Drug Exclusivity: 7 years for a designated rare-disease indication
Pediatric exclusivity: an additional 6 months tacked onto existing protections if requested pediatric studies are completed
The practical valuation insight is that a 7-year Orphan Drug Exclusivity period is frequently worth more per year than the back half of a 20-year composition-of-matter patent, because the cash flows behind it are more certain and should carry a lower discount rate.
The Orange Book listing itself now carries its own political risk. In 2023 and 2024 the Federal Trade Commission challenged more than 400 patent listings it characterized as improperly covering devices or packaging rather than the underlying molecule, each triggering an automatic 30-month stay against generic entry. A portfolio built on device or formulation patents rather than composition-of-matter patents now carries a materially higher de-listing and LOE-acceleration risk than it did five years ago, and due diligence in 2026 has to price that risk explicitly rather than assume every Orange Book listing is equally durable.
The 2026 Policy Shock: Rewriting the IRA’s “Pill Penalty”
This is the single largest change to the valuation landscape since the Inflation Reduction Act itself passed in 2022, and it did not exist when the prior version of this analysis was written.
Under the IRA as enacted, small-molecule drugs became eligible for Medicare price negotiation 7 years after FDA approval, with negotiated prices taking effect at year 9. Biologics received a longer runway: negotiation eligibility at 11 years, price effect at year 13. Industry labeled this gap the “pill penalty,” arguing it systematically redirected R&D investment toward biologics and away from small molecules [13][14].
On April 15, 2025, President Trump signed Executive Order 14273, “Lowering Drug Prices by Once Again Putting Americans First,” directing the HHS Secretary to work with Congress to align small-molecule and biologic treatment under the negotiation program and “end the distortion that undermines relative investment in small molecule prescription drugs” [15][16]. Because the underlying timelines are set in statute, the order itself could not change them; it directed policy development and a legislative push. That push now has a specific vehicle: the bipartisan, bicameral Ensuring Pathways to Innovative Cures (EPIC) Act, reintroduced in the House as H.R. 1492, which would equalize the negotiation-eligibility clock for both drug classes at 11 years post-approval [17][18].
Current law (as enacted, 2022 IRA)
Proposed under the EPIC Act
Small molecule: negotiation eligibility
7 years post-approval
11 years post-approval
Small molecule: price effect
9 years post-approval
13 years post-approval
Biologic: negotiation eligibility
11 years post-approval
11 years post-approval (unchanged)
Biologic: price effect
13 years post-approval
13 years post-approval (unchanged)
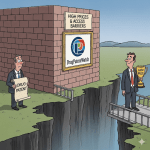
The valuation implication cuts directly against the framing used during 2022-2025, when the correct move was to price a structural, multi-billion-dollar M&A premium into biologics and orphan-designated assets specifically because they carried a longer pre-negotiation runway. As of this writing, EO 14273 is a directive rather than a law, and H.R. 1492 has not been enacted, so the 9-year small-molecule price-effect date remains current law. A valuation model built today has to carry two scenarios rather than one: current law (small-molecule cash flows compressed at year 9), and a plausible legislative outcome (both classes compressed at year 13). Given that half the drugs selected for the first rounds of negotiation reportedly would not have qualified under a 13-year small-molecule standard, the fiscal and political incentives to actually pass a fix are real, but so is the legislative uncertainty; treating the small-molecule discount as a settled, permanent feature of every 2026 model is now a live source of valuation error in either direction.
Modality Premiums Revisited
The relative attractiveness of small molecules, biologics, and cell and gene therapies in a valuation model depends on three variables moving together: probability of success, cost of goods sold, and the IRA-driven discount described above.
Modality
Relative PoS
Typical COGS as % of revenue
IRA negotiation runway (current law)
Small molecule
Baseline
5%-15%
9 years to price effect
Biologic
Generally higher than small molecule at comparable phase
15%-25%
13 years to price effect
Cell / gene therapy (e.g., autologous CAR-T)
Varies; manufacturing complexity is the dominant risk, not clinical PoS alone
30%-50%+
13 years (treated as biologic)
The 2026 M&A data supports the modality thesis directly: named cell and gene therapy acquisitions this year (Lilly-Orna, Lilly-Kelonia, AbbVie’s broader immunology build-out) sit alongside the largest single therapeutic focus across all 2026 deals, antibody-drug conjugates, which reportedly now represent close to 40% of all antibody-related transaction volume, up sharply from a niche share only a few years earlier [9]. That concentration is consistent with acquirers pricing in exactly the combination this table describes: higher near-term COGS, offset by a longer IRA runway and, in oncology specifically, frequent access to the FDA’s Accelerated Approval pathway, which can meaningfully improve NPV by shortening time-to-first-revenue even though it introduces its own contingent-withdrawal risk if the required confirmatory trial fails.
Case Study: The Discipline Behind a $10-15 Billion Bolt-On
AbbVie’s June 2026 acquisition of Apogee Therapeutics for $10.9 billion is a useful test of the current pricing discipline. AbbVie has spent the years since Humira’s 2023 biosimilar-driven loss of exclusivity systematically rebuilding its immunology franchise around Skyrizi and Rinvoq rather than chasing a single Humira-scale replacement. Apogee’s lead assets target the same inflammatory and immunological disease space AbbVie already dominates commercially, which is the opposite of a platform bet like Pfizer’s $43 billion Seagen acquisition three years earlier. Where Seagen was priced on the option value of an entire antibody-drug-conjugate manufacturing platform applied to many future indications, a same-quarter bolt-on like Apogee is priced closer to a straightforward rNPV of a specific, commercially adjacent asset set, with limited real-options premium attached, because AbbVie is buying a fit into an existing commercial infrastructure rather than a new platform.
The broader pattern across GSK-Nuvalent, Vertex-Crinetics, and Sun Pharma-Organon is the same: strategic fit to an existing therapeutic footprint and commercial infrastructure, not platform optionality, is what is being paid for in the sub-$15 billion tier that now defines the majority of 2026 dealmaking. A valuation team benchmarking a bolt-on target against Seagen or Pharmasset-era comparables, both real-options, platform-scale acquisitions, will anchor too high; the more defensible comparable set for a 2026 asset in this size range is the cohort of same-year, same-size deals listed above.
A Practitioner’s Checklist for 2026-2027 Valuation Work
Separate probability of success (scientific, diversifiable risk) from the discount rate (systematic, market risk); never apply a hurdle rate on top of an already risk-adjusted cash flow.
Model the effective loss-of-exclusivity date as a probability distribution informed by patent litigation win rates and Orange Book listing quality, not as a single calendar date.
Run both a current-law and a plausible-EPIC-Act scenario for any small-molecule asset whose commercial life extends into the IRA’s negotiation window; do not treat the small-molecule discount as permanent.
Benchmark bolt-on targets ($1 billion-$15 billion) against 2025-2026 same-size comparables, not against 2019-2023 platform megadeals.
For platform or multi-indication assets, layer a real options analysis on top of rNPV rather than relying on rNPV alone.
Price geopolitical and CDMO-concentration risk explicitly in the discount rate for any asset dependent on single-source, non-U.S./EU manufacturing.
Model a visible, funded life cycle management plan as a distinct “fat tail” cash flow stream rather than assuming revenue drops to zero at LOE.
Key Takeaways
Biopharma M&A hit roughly $130-196 billion in the first half of 2026 alone, its strongest opening half since before the pandemic, but the market has shifted decisively toward $1-15 billion bolt-ons rather than $40 billion-plus megadeals.
Estimates of revenue at risk from loss of exclusivity through 2030-2032 range from $170 billion to $305 billion depending on scope, with named exposures including Keytruda, Opdivo, Eliquis, and Prevnar 13.
Executive Order 14273 (April 15, 2025) directed HHS and Congress to close the IRA’s small-molecule “pill penalty,” and the EPIC Act (H.R. 1492) would equalize negotiation timelines at 11 years for both drug classes; neither has taken legal effect as of this writing, so valuation models should carry both current-law and reformed-law scenarios.
The rNPV framework and its core inputs, probability of success, discount rate, and effective exclusivity, remain the industry standard, but 2026 comparable-transaction analysis should be benchmarked against same-year, same-size deals rather than prior-cycle megadeals.
Orange Book listing quality is now a distinct, quantifiable risk factor given continued FTC scrutiny of device- and packaging-based patent listings.
Frequently Asked Questions
1. Why did biopharma M&A shift from megadeals to bolt-ons in 2026? The patent cliff facing large pharma ($170-305 billion in estimated revenue at risk through 2030-2032) is too large for any single acquisition to close, so acquirers are spreading capital across multiple $1-15 billion targets that each fit a specific therapeutic-area gap, rather than betting on one platform-scale deal [2][5][6][7].
2. Has the IRA’s “pill penalty” actually been fixed? Not yet. Executive Order 14273 (April 15, 2025) directed HHS and Congress to pursue a fix, and the EPIC Act (H.R. 1492) proposes equalizing the negotiation-eligibility timeline at 11 years for both small molecules and biologics, but as of this analysis the underlying statutory timelines (7/9 years for small molecules, 11/13 years for biologics) remain current law [15][17][18].
3. Should a valuation model still favor biologics over small molecules because of the IRA? Under current law, yes, the longer runway before price-setting still supports a relative premium for biologics and orphan-designated assets. Given active legislative movement toward equalizing the timelines, that premium should be modeled as a probability-weighted range rather than a fixed assumption.
4. What is the most common technical mistake in pharma asset valuation? Double-counting risk: applying a low, phase-specific probability of success to future cash flows and then also discounting those already-risked cash flows with a high, VC-style hurdle rate instead of a market-risk-only WACC.
5. Is a 20-year patent or a 7-year Orphan Drug Exclusivity more valuable? Often the Orphan Drug Exclusivity, because it is a date-certain statutory bar on FDA approval of competing applications, whereas a patent term is contestable in litigation, where brand owners historically win only about 25% of ANDA challenges.
6. How much did biopharma M&A total in the first half of 2026? Estimates range from roughly $130 billion (30-plus billion-dollar transactions) to $196 billion depending on the tracking methodology and deal-inclusion threshold used by the analyst [1][2][3].
7. Which therapeutic areas are commanding the largest valuation premiums in 2026? Antibody-drug conjugates in oncology, obesity and metabolic disease (GLP-1 successors), immunology, and cell and gene therapy platforms account for the majority of named 2026 transaction value.
8. Does the FTC’s Orange Book enforcement actually change asset valuation? Yes. A patent portfolio weighted toward device, formulation, or packaging patents rather than composition-of-matter patents now carries a higher risk of FTC challenge and delisting, which should be reflected as a shorter, probability-weighted effective exclusivity period.
9. How should Real Options Analysis be used differently from rNPV in 2026 dealmaking? Real Options Analysis remains the right tool for platform-scale assets with option value across multiple future indications or programs (the Seagen model). For the sub-$15 billion bolt-ons that now dominate deal volume, rNPV on the specific asset, adjusted for strategic and commercial-infrastructure fit, is typically the more defensible primary method, with real options playing a smaller supporting role.
10. What is Life Cycle Management and why does it matter for valuation? Life Cycle Management is the practice of extending an asset’s commercial value beyond its original loss-of-exclusivity date through follow-on formulations, new indications, or authorized generics. A valuation model with a visible, funded LCM plan should treat post-LOE revenue as a step-down to a sustained lower level rather than an assumption of zero.
This analysis draws on current public M&A tracking, government regulatory records, and prior industry valuation literature. Figures for deal counts and totals vary by source depending on inclusion thresholds and reporting dates; where sources disagreed, the range is presented rather than a single figure. This is not investment, legal, or financial advice.
Works cited
DeciBio, “Healthcare Investment: Mid-Year Roundup 2026,” August 11, 2026. https://decibio.com/insights/healthcare-investment-mid-year-roundup-2026
Mondaq, “Trends In 2026 M&A Dealmaking,” 2026. https://www.mondaq.com/unitedstates/finance/1847132/trends-in-2026-ma-dealmaking
Healthcare Brew, “2026’s biggest healthcare deals so far,” 2026. https://www.healthcare-brew.com/stories/2026-biggest-healthcare-deals-so-far
PharmaNow, “Pharma Mergers & Acquisitions: The Top 11 of 2026,” 2026. https://www.pharmanow.live/knowledge-hub/market-trends/pharma-mergers-acquisitions
IQVIA, “Biopharma M&A: Outlook for 2026,” January 2026. https://www.iqvia.com/locations/emea/blogs/2026/01/biopharma-m-and-a-outlook-for-2026
Foley & Lardner, “Will the Next Patent Cliff Further Spur M&A Activity,” 2025. https://www.foley.com/insights/publications/2025/09/patent-cliff-ma-activity-for-companies-right-now/
CNBC, “Big Pharma race to snap up biotech assets as $170 billion patent cliff looms,” January 12, 2026. https://www.cnbc.com/2026/01/07/big-pharma-race-to-snap-up-biotech-assets-as-170-billion-patent-cliff-looms.html
BioWorld, “July defies summer slowdown as biopharma M&A hits year’s highest month,” September 1, 2026. https://www.bioworld.com/articles/topic/214,86
Labiotech, “Top biotech deals in June 2026.” https://www.labiotech.eu/trends-news/top-biotech-deals-in-june-2026/
DrugPatentWatch, “Valuation of Pharmaceutical Companies: A Comprehensive Analysis of Key Considerations,” updated January 22, 2026. https://www.drugpatentwatch.com/blog/valuation-of-pharma-companies-5-key-considerations/
Alacrita, “Valuing Pharmaceutical Assets: When to Use NPV vs rNPV.” https://www.alacrita.com/whitepapers/valuing-pharmaceutical-assets-when-to-use-npv-vs-rnpv
Center for American Health Care (CAHC), “Rotten to the Core: The Inflation Reduction Act Pill Penalty,” March 4, 2025. https://cahc.net/rotten-to-the-core-the-inflation-reduction-act-pill-penalty/
DLA Piper, “President Trump signs Executive Order to lower prescription drug costs,” April 21, 2025. https://www.dlapiper.com/insights/publications/2025/04/president-trump-signs-executive-order-to-lower-prescription-drug-costs
Administration of Donald J. Trump, Executive Order 14273, “Lowering Drug Prices by Once Again Putting Americans First,” April 15, 2025. https://www.govinfo.gov/content/pkg/DCPD-202500483/html/DCPD-202500483.htm
Congressman Greg Murphy, “Murphy Introduces Legislation to Eliminate IRA ‘Pill Penalty,'” 2025. https://murphy.house.gov/media/press-releases/murphy-introduces-legislation-eliminate-ira-pill-penalty-and-improve-small
European Pharmaceutical Review, “US legislation to benefit small molecule drug innovation,” April 17, 2026. https://www.europeanpharmaceuticalreview.com/news/us-legislation-to-benefit-small-molecule-drug-innovation/205235.article