On November 30, 2011, Lipitor lost its U.S. patent protection. Within 90 days, the price of a 30-day supply of atorvastatin had fallen by more than 80 percent at retail pharmacies. Within twelve months, Pfizer’s Lipitor franchise had lost approximately $9.5 billion in annual revenue, and the cholesterol-lowering drug that once generated $13 billion a year for a single company was selling in some pharmacy discount programs for $4 a month [1].
That trajectory — steep initial drop, accelerating erosion through the first year, eventual price floor — is not unique to Lipitor. It is the repeating pattern of generic entry in the U.S. pharmaceutical market, and it plays out with enough regularity that analysts, payers, hospital procurement officers, and anyone on either side of a pharmaceutical transaction can use it as a predictive model.
The question most people cannot answer precisely is: how fast, how far, and under what conditions? The generic price drop is widely understood to exist. The specific benchmarks — what price erosion looks like at 30 days, 90 days, six months, and twelve months after first generic entry — are far less well understood outside specialist circles. The variance across drug categories, formulation complexity, number of generic entrants, payer dynamics, and regulatory circumstances is large enough that applying a single rule of thumb produces serious analytical errors.
This article maps the price drop timeline with precision. It draws on FDA economic analyses, academic research in health economics, government accountability studies, and documented market outcomes for specific drug classes. It examines where the standard narrative breaks down — why some drugs see minimal price erosion for months before collapsing, why complex generics can maintain near-brand pricing for years, and why biosimilar entry produces dramatically different economics than small-molecule generic entry. Tools like DrugPatentWatch, which tracks the full timeline of generic approvals, patent expirations, and first-filer exclusivity status, provide the patent landscape context that drives competitive entry timing.
The intended audience is anyone whose financial model, negotiating position, or procurement strategy depends on knowing what drug costs will actually look like at specific points after patent expiration. That includes pharmaceutical executives managing the brand side of generic transitions, pharmacy benefit managers structuring formulary changes, hospital systems renegotiating procurement contracts, investors modeling generic manufacturer revenue, and policy analysts evaluating whether the Hatch-Waxman framework is delivering competitive savings at the expected pace.
How Generic Entry Actually Works: The Regulatory Architecture
Understanding price timelines requires understanding the regulatory sequence that governs when generic manufacturers can actually enter the market. The mechanics are not simply “patent expires, generic launches.” The sequence is considerably more structured, and each stage of the structure affects competitive timing.
The Hatch-Waxman Framework and Its First-Filer Advantage
The Drug Price Competition and Patent Term Restoration Act of 1984, universally known as Hatch-Waxman, created the regulatory pathway through which generic drugs reach the market [2]. Before Hatch-Waxman, generic manufacturers had to conduct full clinical trials to demonstrate safety and efficacy — essentially reproducing the brand manufacturer’s development program. Hatch-Waxman replaced that requirement with an abbreviated new drug application (ANDA) process that allows generics to demonstrate bioequivalence to the reference listed drug, relying on the brand’s clinical data.
The critical economic incentive embedded in Hatch-Waxman is the 180-day marketing exclusivity period awarded to the first ANDA filer that challenges a patent through a Paragraph IV certification — the legal assertion that the brand’s patents are either invalid or will not be infringed by the generic product. This 180-day period is commercially valuable enough that it has driven the economics of generic pharmaceutical development for four decades. A first-filer generic on a drug with $3 billion in annual brand sales, selling at a 20-25 percent discount to the brand during a period when no other generics can enter, can capture hundreds of millions in revenues during that exclusivity window.
The 180-day period was designed to incentivize patent challenges, but it also has the effect of temporarily limiting price competition. During the first 180 days after generic entry — assuming a single first-filer with exclusivity — there is typically only one generic competitor. A single generic competitor, as the data documented below demonstrates, does not produce the deep price erosion that multiple competitors generate. The first 180-day window is characterized by meaningful but limited price reduction, often 20-40 percent below the brand price, rather than the 80-90 percent reductions that eventually materialize with ten or more competing generics.
The 180-day exclusivity period is triggered by either the first commercial marketing of the generic drug or a court decision finding the challenged patent invalid or not infringed, whichever comes first [3]. The trigger mechanics have been extensively litigated and modified by subsequent regulatory guidance, but the core structure creates a predictable early competitive period that affects price dynamics during the first six months after entry.
ANDA Approval Timeline and Its Effect on Entry Clustering
The FDA’s timeline for reviewing and approving ANDA applications has shortened substantially since the passage of the Generic Drug User Fee Act (GDUFA) in 2012, which imposed user fees on generic applicants and established performance goals for FDA review times [4]. Prior to GDUFA, ANDA approval times averaged 36-40 months. Under GDUFA II and GDUFA III commitments, the FDA has moved toward a 10-month standard review goal for most applications.
The practical effect on price dynamics is that the cluster of generic approvals following the end of first-filer exclusivity arrives faster than it did in the 1990s and early 2000s. When the 180-day exclusivity period expires for a high-revenue drug, FDA can now approve multiple competing generic applications within weeks of each other, rather than spreading approvals over years of sequential review. This compressed approval clustering accelerates the price erosion that occurs after the exclusivity window closes.
For the price timeline analyst, the implication is that post-180-day price dynamics have become steeper in recent years, not because of any change in the competitive economics but because the FDA’s improved processing speed delivers more simultaneous competitors faster than the pre-GDUFA system did.
Authorized Generics: The Brand Manufacturer’s Counter-Move
Brand pharmaceutical manufacturers frequently respond to generic entry by authorizing a generic version of their own product — either through an in-house authorized generic or through a licensing arrangement with a generic manufacturer. The authorized generic carries the same formulation, manufacturing site, and supply chain as the brand drug, but is sold at a substantial discount under a different label.
The economics of authorized generics are deliberately designed to undercut the first-filer advantage. By launching an authorized generic at the same time as the first-filer ANDA generic, the brand manufacturer effectively halves the first-filer’s market share during the 180-day exclusivity period, reducing the economic value of the exclusivity reward and — as the FTC has documented — potentially discouraging future patent challenges by making first-filer economics less attractive [5].
For price dynamics, the authorized generic matters because it represents a second price point in the market from day one, even before the 180-day exclusivity expires. The authorized generic typically prices at 10-20 percent below the brand, while the ANDA first-filer prices at 15-30 percent below the brand. This creates a two-competitor market with compressed price differences during the first 180 days, followed by a more dramatic price drop when additional ANDA approvals flood in after the exclusivity window.
The Three-Month Price Benchmark: What the First 90 Days Look Like
Day One: The Launch Discount
On the day a first-filer generic launches, the market receives its first price signal. That signal is typically a 10-35 percent discount to the prevailing brand price.
The FDA’s Economic Analysis of the Generic Drug Industry, published in its GDUFA performance reporting [6], found that across all drug categories, the first generic entrant prices at an average of 15-25 percent below the brand. The range reflects meaningful variation. Drugs where the first filer is the only generic for a substantial period, or where the therapeutic category supports premium pricing, tend to cluster at the lower end of the discount (10-20 percent). Drugs where the market correctly anticipates rapid additional entry — high-revenue oral solid dosage drugs that attracted multiple first-filer applications — sometimes launch at 25-35 percent below brand from day one, in anticipation of the price war that will follow.
A critical nuance: the relevant price depends on what metric you use. Wholesale acquisition cost (WAC), which is the list price from the manufacturer, tells a different story than net price after rebates and discounts, which is what payers actually pay. WAC is publicly reported and widely tracked; net pricing is proprietary and varies by payer contract. In most analyses of generic price dynamics, researchers use either WAC data from commercial databases like Micromedex or Red Book, or average manufacturer price (AMP) data from Medicaid reporting, or average sales price (ASP) data from Medicare Part B claims.
The distinction matters because brand manufacturers routinely increase WAC in the months before patent expiration — a pattern documented extensively by IQVIA [7] and confirmed by multiple congressional inquiries — while simultaneously offering larger private rebates. This WAC inflation practice creates an artificially elevated base price against which the generic’s Day One discount is measured, making the headline discount look larger than the actual net price reduction for insured patients.
Week Two Through Month One: Formulary Latency
The generic is approved, it is in the pharmacy channel, and it is technically available. The price exists. But the patient’s out-of-pocket cost and the payer’s spending trajectory do not immediately reflect that price. There is a formulary latency period during which the mechanics of pharmacy benefit management catch up to the market reality.
Pharmacy benefit managers (PBMs) and health plan formulary committees typically conduct formal reviews quarterly, though some have expedited processes for high-impact generic launches. A drug that achieves generic approval in January may not see formulary tier changes in all payer plans until the April formulary update cycle. During this transition period, the brand drug may still be on the formulary at Tier 2 or Tier 3 pricing, while the generic — technically available at a lower WAC — may not yet be on the formulary at all, or may be on a different tier.
The practical effect is that many insured patients continue paying brand copays and brand prices for 30-60 days after generic entry, even when the generic is cheaper at the pharmacy counter. Cash-pay patients and uninsured patients can access the generic price immediately; insured patients frequently cannot. This creates a short-term bifurcation in the market that complicates simple price-reduction narratives.
From the brand manufacturer’s perspective, this formulary latency period is commercially valuable. Each additional week of brand utilization on existing formulary positions represents revenue that the market share data will eventually erode. Brand companies track formulary update cycles carefully and sometimes time price increases to occur just before patent expiration, knowing that the higher WAC will persist on formularies for one to two additional cycles before the formulary committee acts.
Months Two and Three: The First-Filer Window’s Economics
By 60-90 days after first generic entry, the market typically looks like this: the first-filer ANDA generic and any authorized generic are available, priced at roughly 15-35 percent below the brand’s prevailing WAC. Formulary transitions have begun but are not complete. Brand utilization has declined, but brand manufacturers’ volume-weighted average revenue per unit has not collapsed because the brand retains utilization among insured patients still on unchanged formulary positions.
Studies using actual claims data paint a quantified picture. An analysis by Berndt, Bhattacharjya, Mishol, Arcelus, and Lasky published in Health Affairs found that in the first 90 days following generic entry for blockbuster drugs with a single first-filer, the weighted average price paid across brand and generic versions combined fell by approximately 8-12 percent from the pre-entry brand price [8]. That relatively modest combined-market price reduction reflects the formulary transition lag more than the underlying competitive dynamics.
The gap between the generic’s WAC price (already 20-30 percent below brand) and the effective market-wide price reduction (8-12 percent at 90 days) is explained by market share. During the first-filer exclusivity window, generic market share for the affected molecule typically reaches 30-50 percent by volume at the 90-day mark, depending on how aggressively payers and PBMs have moved to prefer the generic. That market share gain is real, but it is not yet the 80-90 percent generic dominance that characterizes mature generic markets. <blockquote> “According to a 2023 analysis by the Association for Accessible Medicines, generic drugs account for 91 percent of all prescriptions dispensed in the United States but only 18 percent of total prescription drug spending — a ratio that reflects both the magnitude of generic price competition and the concentration of brand drug costs among biologics and recently-launched specialty products.” [9] </blockquote>
The 180-Day Exclusivity Cliff: The Most Important Transition
The end of the 180-day first-filer exclusivity period is the most economically consequential event in the generic price timeline for most high-revenue drugs. This is the moment when all previously approved ANDA applications that were held back by the exclusivity period can begin marketing their products simultaneously.
The price dynamics at the 180-day cliff depend entirely on how many additional ANDA approvals were waiting. For a drug that attracted 15 ANDA filings — common for blockbusters above $1 billion in annual sales — the end of first-filer exclusivity can bring 10-15 additional generic competitors to market within days. The price impact of moving from a two-competitor market (first-filer plus authorized generic) to a fifteen-competitor market within a single week is dramatic and rapid.
The FDA’s own research has documented that the relationship between number of generic competitors and price follows a nonlinear curve. With two generic competitors, the average generic price is approximately 55 percent of the brand price (a 45 percent discount). With five competitors, average generic price falls to roughly 33 percent of brand. With ten or more competitors, average generic price reaches 20 percent of brand or lower [10]. This curve — steep initial drops with each additional competitor, then flattening as the market matures — explains why the 180-day cliff produces such sharp price movement for heavily-contested drugs.
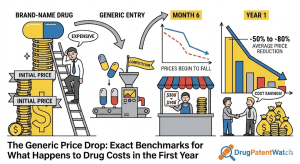
The One-Year Benchmark: Where Prices Land After Full Competition
Month Six: The Competitive Equilibrium Begins
At six months after first generic entry — assuming a typical 180-day exclusivity window has expired and multiple generics have entered — the market price for the generic version of the drug has usually settled into its first stable equilibrium. This equilibrium is characterized by:
Generic pricing at 20-40 percent of the original brand WAC, with variation reflecting therapeutic category, product complexity, and number of active competitors.
Generic volume market share reaching 70-85 percent for simple oral solid dosage drugs, with the brand retaining a residual patient segment of loyal prescribers, patients with strong brand preferences, and markets where payer formulary changes have been slow.
Brand list price maintenance — brand manufacturers almost never lower the WAC of the branded product — but increasingly irrelevant brand list prices, since the brand’s volume has collapsed even as its per-unit price has risen.
Research by Sacks, Lee, Fischer, Jarlenski, and Mehrotra published in JAMA Internal Medicine documented that at the six-month mark following generic entry for 40 brand drugs losing exclusivity between 2014 and 2019, the average generic price was 34 percent of the pre-expiration brand price [11]. Average generic volume market share at six months was 77 percent across the study cohort. Both figures contain significant heterogeneity — simple tablet formulations achieved greater market share and deeper price discounts than complex extended-release formulations.
Month Nine: Manufacturer Consolidation Effects
Between months six and twelve, the generic drug market for any given molecule typically undergoes a consolidation phase. Manufacturers with higher cost structures begin exiting the market or ceasing production, while lower-cost manufacturers expand share. Some manufacturers that obtained ANDA approvals never launched commercially, having assessed the margin environment as insufficient for their production economics.
This consolidation can produce counterintuitive price dynamics. In some cases, generic prices actually rise modestly between month six and month twelve as weaker competitors exit and the remaining participants hold better pricing power. This pattern has been documented particularly for oral solid dosage drugs with narrow profit margins and for drugs that rely on a small number of active pharmaceutical ingredient (API) suppliers. When two or three of the original ten generic entrants exit, the remainder can cautiously increase prices without losing volume, since the exit of manufacturers reduces total supply.
The drug shortage-price increase relationship is the extreme version of this dynamic. When API supply disruptions or manufacturing quality issues cause multiple generic manufacturers to suspend production simultaneously, prices can spike dramatically even for products that long ago fell below 20 percent of original brand pricing. The FDA’s drug shortage database and the American Society of Health-System Pharmacists’ shortage reporting identify these events, which represent tail-risk scenarios that any pricing model needs to accommodate.
Month Twelve: The One-Year Price Floor
At twelve months after first generic entry, the drug’s price trajectory has typically completed its primary descent and reached a price level that will persist with only gradual further erosion. The specific benchmarks at one year depend heavily on drug category, and the variance is large enough that a single number misrepresents the distribution. The evidence base supports the following one-year benchmarks across major categories:
Simple oral solid dosage drugs (tablets, capsules) — standard release: Generic WAC at twelve months: 10-25 percent of pre-entry brand WAC Generic volume market share: 85-93 percent Representative case: Atorvastatin (Lipitor) — generic price fell to approximately 10-12 percent of Lipitor’s WAC within twelve months, with generic volume share exceeding 90 percent [12].
Extended-release oral formulations: Generic WAC at twelve months: 20-45 percent of pre-entry brand WAC Generic volume market share: 65-80 percent Representative case: Extended-release metformin products maintained higher generic prices reflecting more complex manufacturing, but brand volume share eroded substantially once payer preferred-generic policies took hold.
Patch and transdermal delivery systems: Generic WAC at twelve months: 30-55 percent of pre-entry brand WAC Generic volume market share: 60-75 percent Representative case: Transdermal opioid patches, where bioequivalence demonstration requirements are more demanding and manufacturing scale is more limited, maintained relatively higher generic prices for extended periods.
Oral specialty drugs (oncology oral agents, specialty immunology oral drugs): Generic WAC at twelve months: 30-60 percent of pre-entry brand WAC Generic volume market share: 45-70 percent These drugs retain higher brand adherence rates due to patient familiarity, risk of patient anxiety about switching, and specialty pharmacy distribution that is slower to switch than retail pharmacy.
The FDA’s analysis of 80 brand-to-generic drug conversions between 2015 and 2022 found a weighted-average generic price at twelve months of 21 percent of pre-entry brand WAC [10], with the 10th percentile at 8 percent and the 90th percentile at 51 percent. That wide distribution captures the full range from commoditized generics (multiple manufacturers, high volume, commodity API) to complex formulations with limited competitive entry.
The Competitor Count: The Single Most Predictive Variable
Among all the factors that influence the pace and depth of generic price erosion, the number of competing generic manufacturers is the most powerful predictor. Academic research, industry analysis, and regulatory economics consistently find that competitor count explains more variance in generic pricing outcomes than any other single variable.
The FDA’s Price-Competition Curve
The FDA’s Office of Generic Drugs has published competition-based pricing analyses showing the following approximate relationship between generic competitor count and average generic price as a percent of pre-entry brand price [10]:
One generic competitor (first-filer exclusivity period): 75-85 percent of brand WAC Two generic competitors: 50-65 percent of brand WAC Three generic competitors: 35-50 percent of brand WAC Five generic competitors: 25-35 percent of brand WAC Ten generic competitors: 15-22 percent of brand WAC Fifteen or more competitors: 10-15 percent of brand WAC
This curve is not a theoretical prediction; it is an empirical observation from actual market data. The curve’s shape — concave, with steep initial drops and diminishing marginal price reduction from each additional competitor — has been replicated in multiple independent analyses across different time periods and drug categories.
The commercially critical implication is that the difference between two and three generic competitors has a larger price impact than the difference between twelve and fifteen competitors. The first few entrants fight for the largest share of a market where price competition is intense, driving prices down sharply. Late entrants in a market with ten existing competitors are competing for marginal volume share in a market where prices are already near commodity levels, so each additional entrant has a smaller marginal effect.
Why Competitor Counts Vary So Dramatically
For a drug generating $500 million annually in brand revenue, the first-filer 180-day exclusivity is worth approximately $50-100 million to the first generic entrant, depending on market share assumptions and discount depth. That potential reward attracts aggressive patent challenges and multiple ANDA filings. Most blockbuster small-molecule drugs losing exclusivity in the modern post-GDUFA environment attract 10-20 or more ANDA applications before the first generic launch.
For a drug generating $50 million annually, the first-filer economics are thin. The development cost of an ANDA — which runs $1-5 million per application depending on complexity — may not be justified by the expected return. Few generic manufacturers file, the 180-day exclusivity is sometimes not claimed or defaults for procedural reasons, and the drug may see only two or three generic entrants even after patent expiration. Price erosion under these circumstances is limited, and drugs at this revenue scale sometimes maintain near-brand pricing for years after patent expiration, simply because no one has found the economics compelling enough to compete aggressively.
This revenue-threshold effect explains many of the cases where generic entry theoretically occurred but price competition remained muted. Analysts and payers who expect post-patent price erosion on a low-revenue drug, assuming it will follow the blockbuster template, are frequently disappointed.
The Market Exclusivity Premium: When Competition Is Structurally Limited
Certain drug categories face structural limits on generic competition that persist even after the 180-day first-filer exclusivity expires. These limits include API supply concentration, complex manufacturing requirements, and reference standard availability.
When the API for a drug is produced by only two or three manufacturers globally, generic entrants who lack secure API supply are constrained from maintaining sustainable production. The market can appear to have five generic manufacturers by approved ANDA count while functionally having two reliable suppliers, because three of the five are dependent on the same API source and cannot all expand production simultaneously.
Complex manufacturing requirements create similar limits for injectable, inhaled, and topical drugs. A sterile injectable drug that requires specialized aseptic fill-finish capacity will attract fewer ANDA approvals than a simple tablet, and among those approved, fewer will have the capital infrastructure to scale production rapidly. The result is a market that chronically undersupplies relative to demand, maintaining higher prices than the competitor count alone would suggest.
DrugPatentWatch’s ANDA filing and approval tracking data provides the raw material for estimating competitive entry timelines and likely competitor counts for specific drugs. By examining the pipeline of pending ANDAs for a drug approaching patent expiration — the number filed, their approval stages, the identities of the filers and their manufacturing capabilities — analysts can forecast the likely competitive environment at the 6-month and 12-month mark with considerably more precision than any generalized rule of thumb.
Drug Category Variations: Not All Generics Are Equal
The category-specific benchmarks summarized above reflect important underlying dynamics that deserve fuller explanation. Understanding why certain formulations maintain higher prices after generic entry is essential for anyone building models that go beyond generic averages.
Oral Solid Dosage: The Commodity End of the Spectrum
Simple tablets and capsules in standard immediate-release formulations represent the most competitive segment of the generic market. Manufacturing barriers are low, API sourcing is widely available for most molecules, and bioequivalence demonstration is straightforward. The FDA approves new entrants relatively rapidly, and existing manufacturers can scale production quickly because the equipment is fungible across many products.
These factors produce the fastest price erosion and the deepest price floors in the generic market. Statins, ACE inhibitors, proton pump inhibitors, and antidepressants in standard oral formulations have all followed the steep erosion curve that reaches 10-20 percent of brand pricing within twelve months when multiple generic manufacturers enter competitively.
The commercial calculus for brand manufacturers facing generic entry in this category is straightforward and largely hopeless from a revenue defense standpoint. Authorized generic strategies can delay the pace of erosion slightly, but the fundamental price dynamics cannot be resisted once five or more generic manufacturers are active. Brand executives who have modeled the post-patent revenue trajectory on oral solid dosage blockbusters typically plan for a 75-90 percent revenue decline within 12-18 months, and the data supports that planning assumption.
Extended-Release and Modified-Release Formulations
Extended-release (ER) formulations require more sophisticated manufacturing — specialized coating, granulation, or matrix technologies — that creates higher barriers to generic entry and more complex bioequivalence requirements. The FDA requires ER generic applicants to demonstrate not just overall bioequivalence but specifically that the release profile matches the reference drug’s pharmacokinetics, which requires more extensive clinical work.
These requirements explain why ER drugs consistently show slower price erosion curves. The higher entry barriers mean fewer ANDA approvals, slower approval timelines, and lower steady-state competitor counts. At twelve months after first ER generic entry, prices are typically in the 30-50 percent of brand range rather than the 10-25 percent seen for simple tablets. The advantage is commercially meaningful for brand manufacturers, who have long used ER reformulations as part of product lifecycle management strategies.
Regulators and researchers have studied this pattern extensively as a potential anticompetitive concern. Evergreening strategies that shift patients from an immediate-release product to an ER formulation before the IR patent expires — and then run lifecycle campaigns to anchor patients to the ER product just before the ER patent falls — can extend effective market exclusivity well beyond what the underlying chemistry justifies. The FDA has responded with guidance on generic ER bioequivalence requirements designed to ensure that the higher bar is scientifically justified rather than merely inconvenient for generic applicants.
Injectable and Sterile Products
Sterile injectable drugs occupy a unique position in the generic market. Manufacturing requirements are more demanding than for oral dosage forms — aseptic processing, specialized equipment, and sterility assurance systems add significant capital and operational complexity. Bioequivalence requirements for injectables are generally more straightforward than for ER oral products (since the drug is delivered directly into circulation, dissolution kinetics are not a variable), but manufacturing scale-up is harder.
The combined effect is that injectable generics maintain higher prices relative to brand for longer than oral dosage forms, but the eventual price floor after competitive entry is not dramatically higher than for oral forms when sufficient competitors enter. The key uncertainty is whether sufficient competitors will enter, since the manufacturing barriers reduce the pool of potential entrants significantly.
Generic injectable market dynamics gained significant policy attention after the drug shortage crisis of 2010-2014, when widespread shortages of generic injectable drugs — oncology supportive care drugs, anesthetics, critical care agents — exposed the fragility of a market structure where one or two manufacturers supplied the majority of demand at margins too thin to justify significant capital investment in backup production capacity [13].
Topical and Transdermal Products
Topical formulations — creams, gels, ointments, patches — face complex bioequivalence requirements that the FDA spent years developing and refining. For many years, demonstrating bioequivalence for topical products was effectively impossible because no validated methodology existed, which created a de facto market protection for many topical brand drugs that had technically lost patent protection.
The FDA’s publication of product-specific guidance on topical bioequivalence — including in vitro release testing methodologies and skin penetration study frameworks — progressively opened the door for generic topical approvals that had been previously blocked by scientific methodology gaps. The result has been delayed but eventually steep price erosion for topical products as the agency cleared the methodological path for generic entry.
Transdermal patch products face similar complexity. Patch bioequivalence requires demonstrating equivalent drug delivery through intact skin over the full application period, which is a more demanding study than tablet dissolution testing. Combined with the specialized manufacturing requirements for adhesive film production, transdermal generics take longer to reach market and achieve lower competitor counts, maintaining higher prices for longer.
Payer and PBM Dynamics: The Mechanics Behind Patient-Level Savings
The price dynamics described above operate at the level of wholesale and pharmacy acquisition costs. The translation of those price changes into what patients actually pay — and what insurers actually save — requires understanding the payer and PBM layer of the market, which operates on a different timeline than the competitive manufacturing dynamics.
Formulary Tier Changes and the Switch Rate
The primary mechanism through which payers capture generic savings is formulary tier management. When a generic becomes available, PBMs and health plan formulary committees move the generic to Tier 1 (lowest copay, or zero copay) and either move the brand to Tier 3 (non-preferred specialty) or remove it from formulary entirely. This tier change creates an economic incentive for patients to switch to the generic and for prescribers to write generic prescriptions.
The time from generic availability to formulary tier change varies by payer type and contract cycle:
Self-insured large employers that give their PBM broad formulary management authority typically make tier changes within 60-90 days of generic availability.
Fully-insured commercial plans typically change formularies on a quarterly or semi-annual cycle, meaning tier changes can lag generic availability by 60-180 days.
Medicare Part D plans update formularies annually (with mid-year updates permitted under specific circumstances), so a generic that launches in November may not appear on the formulary as a preferred tier product until the January formulary update.
Medicaid programs, which are required by law to cover all FDA-approved generics at favorable cost-sharing, typically have the fastest formulary response but also operate through state bureaucracies that introduce administrative lag.
The aggregate effect of these varying timelines is that payer savings at the three-month mark are significantly below what the generic WAC reduction alone would suggest. The conversion to generic prescribing is incomplete; many insured patients are still using the brand on their current formulary position, and the payer is only capturing savings on the subset of patients who have been switched.
Research by Shrank, Choudhry, Fischer, and Avorn published in JAMA estimated that formulary-driven generic conversion during the first six months following generic entry captures approximately 35-45 percent of the total eventual savings from generic substitution [14]. In absolute terms, if a drug is eventually expected to reduce drug spending by $200 million annually after full generic conversion, payers are capturing only $70-90 million of that savings six months after first generic entry, rising to $130-150 million at twelve months.
Step Therapy and Prior Authorization Removal
When a generic becomes available for a drug that has historically been gated by prior authorization (PA) requirements or step therapy protocols — requirements that patients try other drugs before accessing the target drug — payers frequently remove those barriers for the generic, which expands utilization even as per-unit costs fall.
This utilization expansion partially offsets the per-unit price reduction in payer budget calculations. If a drug’s annual utilization grows by 15 percent when PA requirements are removed (because previously-denied patients can now access the drug at generic pricing), the payer savings from the price reduction are partially consumed by the volume increase. Budget impact models that forecast post-generic savings without accounting for potential utilization expansion may overstate savings.
Rebate Dynamics: The Brand’s Counter-Strategy
Brand pharmaceutical manufacturers respond to generic entry by aggressively increasing rebate payments to PBMs and payers in exchange for maintained formulary placement. This practice — formulary rebate competition — is economically rational for brand manufacturers who can offer rebates from a high WAC base while still generating positive contribution margin.
The rebate dynamic creates a situation where the brand drug’s net price to the payer may actually become more competitive with the generic drug’s price during the immediate post-entry period, even as the brand’s list price remains high and the generic’s list price is substantially lower. Research by Vanderpuye-Orgle, Zhao, Lu, and Ferrufino documented that in multiple therapeutic categories, brand manufacturers offered rebates sufficient to make their net cost competitive with multi-source generics during the first year after patent expiration [15].
The policy implications of this practice — which transfers manufacturer payments through PBMs to payers, with the portion passing to patients remaining limited and variable — have been extensively debated. For the price timeline analyst, the practical implication is that net price dynamics (what payers actually pay) differ from list price dynamics (what is publicly observable in WAC databases), and this difference is largest precisely during the early generic entry period when rebate competition is most intense.
The Brand Drug Price Paradox: Rising List Prices After Patent Expiration
One of the less intuitive features of the post-generic-entry market is that brand manufacturers typically increase the WAC of the branded drug rather than reduce it to compete with generic pricing. This appears counterproductive from a volume standpoint, and it is — brand manufacturers universally experience steep volume loss after generic entry. But the WAC increase is commercially rational from a revenue optimization standpoint in a market segmented by insurance coverage.
The Price Inelastic Residual Market
After generic entry, the brand retains a residual market segment that is largely insensitive to the price difference between brand and generic. This segment includes:
Patients whose insurers cover the brand at similar cost-sharing to the generic (typically patients with first-dollar coverage or very low copays for all tiers). Patients with strong brand loyalty or physician-driven brand prescribing that persists despite formulary incentives to switch. Patients with clinical circumstances that make the prescriber reluctant to switch (elderly patients on stable regimens, patients with previous generic failure experiences). Markets outside the U.S. retail pharmacy channel, including long-term care, institutional, and specialty pharmacy segments that switch to generics more slowly.
For this residual market, demand is relatively inelastic — the patients who are still on the brand drug at six months post-generic-entry are not going to switch because the WAC went up by ten percent. They stayed despite the generic being 70 percent cheaper; the brand price increase does not drive additional switching.
The brand manufacturer’s calculation is then: maximize revenue from the residual volume by charging the highest price the market will bear, rather than trying to recover volume by cutting price (which would not work anyway, because the patients who are price-sensitive have already switched to the generic). This logic produces the documented pattern of brand price increases following generic entry that has been studied by Berndt and Aitken, among others [16].
What This Means for Price Timeline Analysis
The brand price increase dynamic creates a diverging price graph after generic entry: the generic price falls sharply, the brand price rises modestly, and the spread between them increases over time rather than converging. At twelve months after generic entry for a typical small-molecule drug, the brand WAC may be 5-10 percent higher than it was at the time of first generic entry, while the generic WAC is 80-90 percent lower.
This has implications for drug spending calculations that depend on which metric is used. If a hospital formulary analyst tracks “drug cost” using the brand WAC and the drug is still dispensed as the brand in certain patient segments, they will see increasing drug costs for that segment even as the generic’s price has collapsed. Total spending on the molecule — brand plus generic combined — typically falls dramatically, but the brand segment alone can show cost increases.
Authorized Generics: The Economics in Detail
What an Authorized Generic Is and Isn’t
An authorized generic is the branded drug sold under a different label at a lower price. It is manufactured at the same facility, from the same API, using the same formulation as the brand. From a patient perspective, the authorized generic is the brand drug in different packaging. From a regulatory perspective, it does not require its own ANDA approval — it is marketed under the original NDA held by the brand manufacturer.
The critical legal point is that authorized generics are not subject to the 180-day first-filer exclusivity protection. A first-filer ANDA holder has exclusivity against other ANDAs, but the brand manufacturer can market an authorized generic during the 180-day period without triggering the exclusivity. This creates the competitive dynamic during the first 180 days where the ANDA first-filer and the authorized generic compete directly, often at similar price points, each capturing roughly equal market share.
Authorized Generic Pricing Strategy
Brand manufacturers price authorized generics with two objectives in simultaneous tension. They want the authorized generic to be priced low enough to capture a substantial share of the generic market (preventing all the volume loss going to the ANDA first-filer), but not so low as to undermine the brand’s own residual market or to set a reference price that PBMs can use to require rebates on the brand.
The typical authorized generic launch price is 10-20 percent below the brand WAC, which is close to but slightly above the ANDA first-filer’s typical 15-25 percent discount. This pricing behavior is economically rational: the authorized generic is meant to capture volume in the price-sensitive segment without implying the brand itself should be cheaper.
After the 180-day exclusivity period ends and additional ANDA generics enter the market, authorized generics typically adjust their pricing to remain competitive, following the generic market price down. In some cases, brand manufacturers discontinue their authorized generics when the market price has fallen to a level below which selling the branded formulation at a discount is economically damaging to the supply economics or brand positioning.
The Anti-Pay-for-Delay Authorized Generic Use
Following the Supreme Court’s FTC v. Actavis decision [17] in 2013, which held that reverse payment settlements (pay-for-delay arrangements) could violate antitrust law, brand manufacturers found authorized generics to be an alternative mechanism for resolving first-filer Paragraph IV litigation without cash payments. By offering the first-filer an authorized generic license — the right to market an authorized generic version of the brand product — in settlement of patent litigation, brand manufacturers and first-filer generics could both benefit from the arrangement.
The authorized generic license terms, including the duration, pricing, and sales territory of the authorized generic, are commercially material to the price timeline analysis. A settlement that gives the first-filer an authorized generic license for three years gives that manufacturer a supply advantage over other generic entrants during that period, potentially limiting the competitive entry that would otherwise drive deeper price erosion.
Complex Generics and the 505(b)(2) Pathway: The Middle Ground
Between the simple generic (immediate-release tablet, ANDA pathway, commodity pricing within twelve months) and the biologic (large molecule, biosimilar pathway, slow price erosion) lies a category that receives insufficient analytical attention: complex generics and drugs approved through the 505(b)(2) pathway. These products sit in the middle of the difficulty spectrum and produce price timelines that deviate from both extremes.
What Makes a Generic Complex
The FDA uses the term “complex generic” to describe products where demonstrating sameness or equivalence to the reference listed drug presents scientific or regulatory challenges that cannot be resolved through standard dissolution testing and pharmacokinetic bioequivalence studies. Complex generics include drug-device combinations (metered-dose inhalers, prefilled auto-injectors, transdermal patches), locally-acting drugs where systemic bioequivalence does not ensure local therapeutic equivalence (topical corticosteroids, oral drugs acting in the GI tract), and drugs with complex formulations (liposomes, microspheres, emulsions).
The FDA’s Complex Drug Substances and Products Program, established following the 21st Century Cures Act, dedicated specific resources to developing the scientific frameworks needed to evaluate complex generic applications. Before those frameworks were established, complex generics faced approval barriers that were as much methodological as scientific — there was no agreed-upon way to prove they were equivalent, so approvals simply did not happen.
The consequence for price timelines is that complex generics frequently reach the market years later than simple generics in comparable situations, and they enter markets with fewer competitors. A drug product classified as a complex generic typically sees its first generic entrant three to five years after simple oral solid dosage drugs at equivalent revenue levels, and it may see only two to four ANDA approvals rather than the fifteen-plus seen for blockbusters.
Inhaled Drug Price Timelines: A Documented Example
The inhaled corticosteroid and long-acting beta-agonist market illustrates complex generic pricing dynamics concretely. Drugs like Advair (fluticasone/salmeterol) and Symbicort (budesonide/formoterol) maintained near-brand pricing for years after their primary patents expired, because the combination of drug-device interface complexity, actuator-dose relationship requirements, and FDA product-specific guidance delays kept generic approvals limited.
Advair’s primary compound patents began expiring in the United States in 2010, but the first FDA-approved generic alternative did not reach the market until 2019 — a nine-year gap during which GlaxoSmithKline maintained pricing power in the inhaled corticosteroid combination market that would have been impossible in any simple oral dosage drug category [33].
When generic Advair did launch, the limited number of approved competitors — fewer than three products during the first twelve months of generic availability — produced a very different price timeline than the blockbuster oral generic model. At twelve months after first generic entry, inhaled corticosteroid generics were priced at roughly 40-60 percent of original brand WAC, with brand volume share declining more slowly than for comparable oral drugs.
The practical lesson for price timeline modeling is that the “patent expiration date” is not the same as the “generic entry date” for complex products. Analysts should distinguish between patent expiration and regulatory science readiness, the latter being determined by FDA guidance document publication and the accumulation of scientific precedent that allows ANDA reviewers to evaluate the application. For complex generics, this distinction can span years and has major budget impact implications.
The 505(b)(2) Pathway and Its Competitive Dynamics
The 505(b)(2) pathway allows applicants to file an NDA that relies, at least in part, on studies that the applicant did not conduct and for which they have not obtained a right of reference. This pathway is used extensively for modified-release formulations, new dosage forms, new routes of administration, and combination products that are not simple generics but can reference published scientific literature and previously-approved drugs to reduce the development burden.
Products approved through the 505(b)(2) pathway can be granted their own exclusivity periods and can list their own Orange Book patents, creating a secondary layer of protection for reformulated products even after the original compound patent expires. A 505(b)(2) ER formulation approved five years after the original IR compound can carry NCE exclusivity or new clinical investigation exclusivity that extends meaningful market protection by three to five years.
The competitive dynamics for 505(b)(2) products are different from both standard generics and biologics. Challengers to 505(b)(2) products must file either a full 505(b)(2) application of their own (another reformulation that relies on published science) or an ANDA if the 505(b)(2) product qualifies as a reference listed drug. The application pathway is more complex than standard ANDA filing, which limits the number of challengers and produces lower competitor counts, supporting higher price floors after competitive entry.
Biologic Drugs and Biosimilars: A Fundamentally Different Timeline
For biologic drugs — large-molecule proteins, antibodies, and related therapies — the price dynamics after loss of exclusivity (LOE) follow a dramatically different timeline than for small-molecule drugs. Understanding this difference is essential for any analysis that covers the modern pharmaceutical market, where biologics represent an increasing proportion of total drug spending.
Why Biosimilar Entry Is Slower
Biosimilars face approval barriers that have no equivalent in the small-molecule ANDA process. A biosimilar must demonstrate not just bioequivalence (equivalent pharmacokinetics) but biosimilarity — that the biosimilar has no clinically meaningful differences from the reference product in terms of safety, purity, and potency [18]. This requires extensive analytical characterization of the complex protein structure, plus clinical pharmacology studies and often clinical safety and efficacy data.
The cost of a biosimilar development program runs $100-300 million, compared to $1-5 million for a small-molecule ANDA. This dramatically raises the market entry threshold, limiting the pool of potential competitors. For most biologic reference products, two to five biosimilar approvals in the years following LOE is the norm, rather than the ten to fifteen generic approvals typical for blockbuster small-molecule drugs.
The lower competitor count produces the predictable effect on pricing: biosimilar discounts to reference product WAC are smaller and slower to develop than small-molecule generic discounts. The FDA’s analysis of U.S. biosimilar market data found that biosimilar prices at twelve months after first launch are typically 15-35 percent below reference product WAC — a substantially smaller discount than the 75-90 percent reductions seen for small-molecule drugs at the same time horizon [19].
The Interchangeability Designation and Automatic Substitution
A critical variable in biosimilar uptake is the FDA’s interchangeability designation, which allows a biosimilar to be automatically substituted at the pharmacy level in states that permit such substitution. Without interchangeability, biosimilars must be specifically prescribed — a physician must write “biosimilar X” on the prescription rather than just “adalimumab.” This requirement substantially slows market penetration, because physician inertia and PBM formulary management work differently for products that require active prescriber engagement versus automatic substitution.
The FDA began granting interchangeability designations to biosimilars in 2021, starting with a long-acting insulin product. The pace of interchangeability designations has accelerated since, but the designation requires additional switching studies beyond basic biosimilarity, adding cost and time to development. As of 2024, a subset of biosimilars carry interchangeability designations that enable automatic pharmacy substitution, and the price dynamics for this subset more closely resemble generic substitution than for biosimilars without the designation.
The Humira Example: Seven Years of Delayed U.S. Competition
AbbVie’s Humira (adalimumab) lost European biosimilar competition in October 2018 but maintained effective U.S. market exclusivity until January 2023, when the first wave of U.S. biosimilar launches began following AbbVie’s litigation settlements [20]. The seven-year gap between European and U.S. biosimilar entry reflects both the patent portfolio strategy described by Feldman [21] and the structural differences between U.S. and European biosimilar markets.
The price dynamics after U.S. Humira biosimilar entry illustrate the biologic pattern well. In the first year after multiple biosimilar launches in 2023, Humira’s list price remained unchanged while biosimilar WACs launched at discounts of 5-85 percent depending on the biosimilar manufacturer’s pricing strategy — a range driven by the unusual market structure where some biosimilars chose to compete on price while others targeted specific payer channels at higher prices.
By mid-2024, the biosimilar market share of adalimumab products in the United States had reached approximately 20-25 percent of units, with net prices (after rebates) showing more convergence than list prices [22]. This is dramatically slower market share conversion than the 70-85 percent share seen for small-molecule generics at the six-month mark. The difference reflects prescriber behavior, formulary management complexity for biologic drugs, and the absence of universal interchangeability designation.
Long-Term Biologic Price Trajectory
Research on European biologic markets — where biosimilar competition has been ongoing for longer than in the United States — provides a longer-term price trajectory benchmark. European studies of biosimilar competition in therapeutic categories including erythropoiesis-stimulating agents, filgrastim, and infliximab found that:
After two biosimilar competitors entered in a tender-based market, reference product prices fell 30-50 percent within 18 months. After four or more biosimilar competitors competed in a tender-based market, prices fell 60-80 percent within 24-36 months [23]. The European trajectory suggests that U.S. biosimilar market erosion curves, while currently shallower due to structural differences in market design, will steepen as the number of biosimilar competitors grows and payer pressure to use cost-effective biosimilars intensifies.
For U.S. market analysis, the current evidence suggests a three to five year timeline to reach price erosion levels similar to the one-year benchmarks for small-molecule drugs. The dynamics are slower, the driver is payer formulary management rather than automatic pharmacy substitution, and the price floor reflects competitor count far below what small-molecule generics achieve.
The Authorized Generic and Pay-for-Delay Legacy: How Settlements Altered Price Timelines
Reverse Payment Settlements and Their Economic Effect
Before FTC v. Actavis [17], brand manufacturers regularly settled Paragraph IV litigation by paying generic challengers to delay market entry — often paying amounts larger than the generic would have earned during a first-filer exclusivity period. These reverse payment settlements, sometimes called pay-for-delay agreements, effectively allowed brand manufacturers to share monopoly profits with potential generic competitors in exchange for delayed competition.
The FTC estimated that pay-for-delay agreements in the 2000s were costing consumers $3.5 billion per year in delayed generic savings [24]. The settlements extended the brand’s effective exclusivity beyond the patent term by years, in some cases moving generic entry from two to three years after patent expiration to eight to ten years after patent expiration.
Post-Actavis, reverse payment settlements are subject to antitrust scrutiny, and the most overt forms have declined significantly. The generic price timeline for drugs challenged after 2013 more closely reflects patent strength than commercial negotiation. But the legacy of pre-Actavis settlements still affects the price history of specific drugs — cases where generic entry was delayed by settlements reached in the 2000s and early 2010s produced multi-year revenue extensions for brand manufacturers and correspondingly delayed savings for payers.
The First-Filer Forfeiture Problem
When a first-filer ANDA holder fails to launch or negotiate a settlement that triggers the 180-day exclusivity, but also fails to formally forfeit the exclusivity, the exclusivity can become “parked” — held by the first filer without being exercised, blocking subsequent ANDA approvals from launching even though no generic product is actually available to consumers.
Congress addressed this through the Medicare Modernization Act of 2003, which established forfeiture provisions requiring first filers to either launch or forfeit under specified conditions [25]. The forfeiture provisions improved the problem but did not eliminate it. Complex commercial negotiations between brand manufacturers and first-filer generics can still produce periods where the 180-day exclusivity is neither exercised nor forfeited, delaying competition for months or years beyond the patent expiration date.
For price timeline analysis, parked exclusivity events represent tail risks that can shift the entire price timeline by six to eighteen months, materially affecting budget projections for payers modeling generic savings.
Geographic Variation: U.S. vs. International Price Timelines
The U.S. experience with post-patent price dynamics is not universal. International markets operate under substantially different regulatory frameworks, reimbursement systems, and market structures that produce very different price timelines.
Germany and the AMNOG Reference Pricing System
Germany operates a reference pricing system under which generic drugs are reimbursed at a fixed reference price determined by therapeutic class, regardless of the product’s actual price. When a drug goes off-patent, the reference price is set at a level calibrated to the generic price, which essentially captures generic savings immediately and automatically — there is no transitional period where the brand retains significant pricing power in the reimbursement system.
The German system produces steeper immediate price erosion than the U.S. system, because the reimbursement mechanism does not have a formulary update lag. When a generic is approved and priced below the reference level, both brand and generic are covered at the reference price, and patients pay the difference between the brand’s higher price and the reference price as a copay. This direct price signal drives faster brand-to-generic switching than the U.S. copay tier system [26].
The UK and PPRS Dynamics
The UK’s National Health Service operates a central drug procurement system that actively negotiates prices after patent expiration. For high-revenue drugs losing exclusivity, the NHS’s commercial function can negotiate significant price concessions from generic manufacturers through competitive tender processes, accelerating the achievement of the price floor that takes twelve months in the U.S. retail market.
The UK’s dynamics also reflect a simpler distribution channel — fewer intermediaries between manufacturer and patient than in the U.S., with correspondingly less delay in passing price changes through to the budget. Academic analysis has found that post-patent price erosion in the UK is faster in the first six months but converges toward similar twelve-month levels as the U.S. for simple oral dosage forms [27].
India and Brazil: The Compulsory License Dimension
In lower- and middle-income countries with active compulsory licensing frameworks — India, Brazil, Thailand — the price timeline after patent expiration (or compulsory license grant) follows a different logic. Indian generic manufacturers, operating under India’s patent law that does not recognize product patents for pharmaceuticals filed before 2005 and imposes additional patentability requirements under Section 3(d), have produced generic versions of drugs still under patent in the United States.
For global pharmaceutical companies tracking competitive dynamics, the Indian and Brazilian price signals for off-patent generics are commercially relevant as benchmarks for where U.S. and European prices will eventually converge after full competitive entry. Indian domestic generic prices for molecules with multiple manufacturers are frequently at 2-5 percent of the original brand WAC — a level that represents the global commodity floor for simple oral dosage drugs in high-volume therapeutic categories.
Real-World Case Studies: Five Drugs, Five Price Timelines
Case Study 1: Atorvastatin (Lipitor) — The Blockbuster Template
Atorvastatin’s November 2011 patent expiration is the reference case for blockbuster generic transitions. Pfizer’s Lipitor generated approximately $13 billion in annual U.S. revenue at peak, making it the highest-revenue drug ever to face patent expiration at the time.
The price timeline:
Day 1 (November 30, 2011): Ranbaxy (now Sun Pharma) launched as the 180-day first-filer generic at approximately 20 percent below brand WAC. Watson Pharmaceuticals launched an authorized generic simultaneously for Pfizer.
Month 3 (February 2012): Two-competitor market (Ranbaxy ANDA generic plus Pfizer authorized generic). Generic WAC approximately 25-30 percent below brand. Combined generic volume share approximately 45 percent.
Month 6 (May 2012): 180-day exclusivity expired. Multiple additional generic approvals flooded in within weeks. Generic WAC dropped to approximately 15-20 percent of original brand WAC within 30 days of exclusivity expiration. Total generic market share reached approximately 75 percent.
Month 12 (November 2012): Generic WAC had settled at approximately 10-12 percent of original brand WAC. Brand Lipitor retained approximately 10-15 percent volume share at a WAC now 8 percent above the pre-expiration price. Pfizer’s Lipitor revenues had fallen from $9.6 billion in 2011 to approximately $3.9 billion in 2012 [28].
The atorvastatin case demonstrates the characteristic shape of blockbuster generic transitions: moderate initial erosion during the first-filer window, dramatic price collapse at the 180-day exclusivity cliff, and a rapid approach to the price floor at twelve months.
Case Study 2: Escitalopram (Lexapro) — The Second-Mover Beneficiary
Escitalopram’s March 2012 patent expiration followed atorvastatin’s by four months and illustrated several additional dynamics. Forest Laboratories had taken aggressive action to maximize the escitalopram exclusivity period through patent litigation, settlement negotiations, and label expansion.
The escitalopram timeline was complicated by the fact that Forest had settled multiple Paragraph IV cases, meaning that some generic manufacturers had authorized entry dates in their settlement agreements rather than waiting for full PTAB or court resolution. The settlement structure meant that entry was more orderly and sequential than the atorvastatin free-for-all, producing a slightly less steep initial price decline.
By twelve months, escitalopram generic pricing had reached approximately 13-15 percent of brand Lexapro WAC, slightly above atorvastatin’s floor, reflecting the slightly lower number of competing manufacturers in a less aggressively contested entry. The case reinforces the competitor-count relationship — fewer competitors produce a modestly higher price floor.
Case Study 3: Aripiprazole (Abilify) — The Complex Post-Expiration Market
Aripiprazole, the antipsychotic drug marketed as Abilify by Otsuka, faced a more complex competitive landscape when its primary patents expired in April 2015. The drug was used across multiple psychiatric indications including schizophrenia, bipolar disorder, major depressive disorder, and autism spectrum disorder. Its specialty pharmacy distribution and prescriber demographics differed substantially from primary care drugs like statins and SSRIs.
Generic aripiprazole launched in April 2015 with Teva as a first-filer. The specialty prescribing context produced a slower brand-to-generic conversion rate than primary care drugs, reflecting psychiatrist prescribing behavior and the concerns of patients and caregivers about switching psychiatric medications.
At three months, aripiprazole generic volume share was approximately 40 percent — lower than the 45-50 percent seen for comparable oral drugs in primary care, reflecting specialty prescribing patterns. At twelve months, generic share had reached approximately 75-80 percent, still below the 85-93 percent seen for primary care oral drugs at the same time horizon [29].
The aripiprazole case documents the specialty prescribing premium in generic conversion rates — slower conversion producing slightly higher prices at any given time horizon compared to primary care drugs with equivalent molecular complexity.
Case Study 4: Pregabalin (Lyrica) — The Extended-Release Complication
Pfizer’s pregabalin (Lyrica) faced generic entry in its immediate-release form in July 2019. The drug’s patent history was complicated by multiple Orange Book-listed patents and Paragraph IV challenges, creating a clustered entry timeline. Within weeks of first generic entry, multiple manufacturers had launched, and the IR formulation price dropped sharply — reaching approximately 10-15 percent of brand WAC by twelve months, consistent with simple oral solid dosage norms.
The Lyrica XR (extended-release) formulation, however, maintained substantially higher pricing due to the ER competitive dynamics described earlier. With fewer ANDA approvals for the ER formulation and a more demanding bioequivalence demonstration requirement, ER pregabalin pricing was still at approximately 35-40 percent of brand WAC at twelve months — more than twice the price erosion depth of the IR formulation.
The Lyrica case demonstrates the IR/ER price differential concretely: identical active ingredient, dramatically different twelve-month price floors based on formulation complexity. Any budget impact model that treats IR and ER formulations identically will substantially overestimate savings from ER patent expiration.
Case Study 5: Adalimumab (Humira) — The Biologic Divergence
The adalimumab biosimilar timeline, already described above in the biologic section, deserves quantification here for direct comparison with the small-molecule cases.
January 2023: First U.S. biosimilar launches. Biosimilar WAC prices ranged from 5 percent below to 85 percent below Humira’s WAC, depending on biosimilar manufacturer strategy. Humira’s WAC increased slightly at launch — consistent with the brand price increase pattern documented for small-molecule drugs.
Month 6 (June 2023): Approximately 8-10 biosimilars available. Biosimilar volume market share approximately 10-15 percent. Blended adalimumab market price approximately 5-8 percent below Humira’s WAC.
Month 12 (January 2024): Biosimilar volume share approximately 20-30 percent. Average net price (after rebates) for adalimumab products approximately 25-40 percent below Humira’s original WAC, driven primarily by increased rebate competition rather than list price convergence.
The adalimumab timeline at twelve months looks nothing like atorvastatin at twelve months. The biologic market structure — high development cost, low competitor count, no interchangeability-driven automatic substitution, intense rebate competition at the payer level — produces dramatically slower and shallower price erosion by every metric. The one-year biologic benchmark of 20-40 percent net price reduction compared to 75-90 percent for small-molecule oral drugs represents a structural difference, not a timing lag that will catch up in the second year.
Using Patent Data to Predict Price Timeline Events
DrugPatentWatch and the Competitive Entry Calendar
The price timelines described in this article are downstream consequences of patent expiration and exclusivity events that can be tracked and, to a significant degree, predicted. DrugPatentWatch aggregates the relevant upstream data: Orange Book patent listings, ANDA filing counts and approval status, regulatory exclusivity expiration dates, Paragraph IV certification filings, and PTAB petition records.
Using this data infrastructure to build a forward-looking price timeline requires assembling several data points for each drug of interest:
The earliest legally possible generic entry date, which is determined by the last expiring patent or regulatory exclusivity period covering the marketed formulation, whichever is later. DrugPatentWatch’s product pages compile this information in a single view, including the patent-by-patent expiration dates and exclusivity type/expiration stacked chronologically.
The number of pending ANDA applications, which predicts the competitive entry intensity once the exclusivity barriers fall. A drug with 15 pending ANDAs will follow the high-competitor-count curve; one with three pending ANDAs will follow the low-competitor-count curve.
The Paragraph IV certification status, which identifies whether any generic manufacturer has already challenged the listed patents and how far those challenges have progressed. An active Paragraph IV litigation with a settled entry date tells you precisely when at least one generic will enter, removing uncertainty from the timing side of the price forecast.
The first-filer identity and authorized generic status, which predicts the market structure during the 180-day exclusivity window.
When these inputs are assembled, the price timeline framework from this article becomes a predictive model rather than a historical description. A hospital system planning its 2027 drug budget can identify which high-cost drugs will face generic entry in that year, estimate the competitive entry intensity for each, and apply the appropriate price erosion curve (simple tablet, ER formulation, injectable, specialty) to project drug cost reductions with a level of precision that simple “patent expiration year” tracking cannot provide.
Building the Price Forecast Model
A practical price forecast model for a specific drug approaching patent expiration takes the following structure:
Step 1: Establish the entry date. Using DrugPatentWatch or direct FDA Orange Book data, confirm the last expiring patent and regulatory exclusivity date. If Paragraph IV litigation is pending, examine the settlement terms or trial schedule to assess whether entry will occur at the patent expiration date or earlier/later.
Step 2: Count pending ANDAs and estimate competitive intensity. From FDA’s ANDA database and DrugPatentWatch’s tracking, count the ANDAs filed and approved versus pending for the specific drug. Classify the drug as low-competition (fewer than five ANDAs), moderate-competition (five to ten ANDAs), or high-competition (more than ten ANDAs).
Step 3: Classify the formulation type. Apply the category-specific curve (simple oral, ER oral, injectable, topical, biologic) to project the price erosion trajectory at three months, six months, and twelve months.
Step 4: Model formulary conversion lag. Apply payer-type-specific conversion timelines to project the effective market-wide price reduction at each time horizon, accounting for the lag between generic availability and complete formulary transition.
Step 5: Apply scenario analysis. Run the base case with the expected competitor count, a bear case with competition limited (only one to three ANDA approvals, perhaps due to regulatory or manufacturing delays), and a bull case with accelerated competition.
The output is a drug-specific price timeline with three scenarios and uncertainty bounds, rather than a single-point estimate that will be wrong to the left or right of the actual outcome.
Policy Dynamics: IRA, Drug Shortage Law, and the Future Price Floor
The Inflation Reduction Act’s Price Negotiation and Generic Competition Interaction
The Inflation Reduction Act of 2022 established Medicare drug price negotiation for high-revenue drugs without generic or biosimilar competition [30]. For small-molecule drugs, Medicare can begin negotiation nine years after approval; for biologics, thirteen years. The program is explicitly designed to capture savings that patent exclusivity prevents the generic mechanism from delivering during the drug’s commercial life.
The interaction between IRA negotiation and generic entry timing creates an interesting analytical puzzle. A drug that would previously have maintained brand-level pricing until year nine or ten of its commercial life, then dropped steeply on generic entry, will now face a price ceiling from IRA negotiation at year nine even if no generic entry has occurred. The effective price reduction timeline has been shifted earlier — not through generic competition but through regulatory price-setting.
For drugs in the IRA negotiation pipeline, the generic entry price timeline analysis should factor in the IRA-negotiated price as a price floor that constrains the brand’s residual market premium during the post-generic transition period. If the brand is already selling at a negotiated Medicare price of 65 percent of WAC at the time generic entry occurs, the spread between brand and generic is compressed relative to a drug whose brand price was unconstrained before generic entry.
Drug Shortage Risk and Its Price Effect
As noted earlier, the drug shortage phenomenon can reverse the price trajectory for generic drugs well after their initial launch. The FDA’s drug shortage list, which peaked at over 300 active shortages in 2011-2013, has fluctuated but has not been resolved as a systemic problem [31]. Congressional legislation including the Drug Shortage provisions of the FDA Safety and Innovation Act have improved shortage reporting and prevention protocols, but underlying supply chain vulnerabilities in the generic manufacturing sector persist.
For the price timeline analyst, drug shortage risk is a tail risk that should be modeled explicitly for any drug where:
The API supply chain is concentrated in two or fewer manufacturers globally.
The manufacturing process requires specialized sterile or aseptic capabilities with limited global capacity.
The drug’s therapeutic importance makes it a target for just-in-time procurement by hospital systems that maintain minimal inventory, amplifying supply chain disruptions.
Injectable oncology supportive care drugs, anesthetics, and critical care antibiotics are the categories with the highest historical shortage frequency. Budget models for these categories should incorporate a probability distribution of price spikes rather than assuming the observed price floor is stable.
The Biosimilar Substitution Policy Debate
U.S. biosimilar policy debate centers on two interconnected issues: whether more biosimilars should receive interchangeability designation (which would enable automatic substitution and faster market share conversion), and whether PBM formulary management practices that maintain originator biologics on preferred formulary positions in exchange for rebates are adequately competitive.
The FTC’s 2022 report on PBM practices examined the role of rebate contracts in maintaining originator biologic formulary preference despite biosimilar availability, and found that rebate contracts often functionally exclude biosimilars from preferred formulary positions in ways that delay price competition [32]. Legislative proposals to reform rebate contract practices have been debated in Congress for multiple sessions, and some partial reforms have been implemented through HHS rulemaking.
For biosimilar price timeline forecasting, these policy dynamics create substantial uncertainty. If rebate reform accelerates formulary conversion to biosimilars, the current U.S. biosimilar price timeline (characterized by slow 20-30 percent market share at twelve months) could shift toward the European model of faster, deeper price erosion. If the current system persists, the biosimilar timeline remains structurally slower than small-molecule generic timelines.
Practical Implications for Different Stakeholders
Pharmacy Benefit Managers
PBMs whose contract cycle creates formulary update lags of more than 60 days are leaving generic savings on the table during the transitional period between generic approval and formulary change. For high-revenue drugs, quantifying this lag in dollar terms — the savings that would have been captured if the formulary change had been implemented 30 days faster — creates a concrete business case for expedited formulary review processes for drugs above a revenue materiality threshold.
The most sophisticated PBMs have built rapid-response formulary mechanisms specifically for high-revenue generic launches. When a blockbuster drug’s patent expiration approaches and multiple generic approvals are expected within weeks of each other, these mechanisms allow formulary committee action within 30 days of generic launch rather than waiting for the next quarterly cycle.
Generic manufacturer pricing decisions are not arbitrary. They follow from cost structures, competitive positioning, and the economics of first-mover versus late-mover strategy in specific drug markets. Understanding these economics helps explain price dynamics that might otherwise appear irrational.
A generic manufacturer’s marginal cost of production for a simple oral solid dosage drug typically runs 3-8 percent of the original brand WAC for commoditized molecules with widely available APIs and established manufacturing processes. At a generic price of 15 percent of brand WAC — a common twelve-month market price for heavily-contested drugs — the gross margin is real but thin, particularly after accounting for distribution, regulatory compliance, and marketing costs. The margin thinness explains why manufacturers exit markets when competitor count rises too high, and why the generic market for any given molecule typically consolidates over two to five years after initial competitive entry.
The first-filer economics look very different. During the 180-day exclusivity period, when the first-filer generic is priced at 20-30 percent below brand WAC and capturing 40-50 percent of market volume, the gross margin on sales is substantial — often 40-60 percent depending on cost structure. That margin is the reward for the Paragraph IV litigation investment, and it justifies development and legal costs that are economically infeasible for later-entering generics.
This economics structure produces predictable behavior: first-filer applicants choose high-revenue, patent-vulnerable drugs and compete aggressively for the exclusivity reward. Later-entering applicants are more cost-sensitive and tend to avoid markets where the first-mover discount has already compressed margins to commodity levels. The result is a market that, for any given drug, sees most competitive entry happen quickly after the 180-day cliff, with limited additional entry in subsequent years.
Hospital Systems and Integrated Delivery Networks
Hospital systems that procure drugs directly face a different set of timing variables. Group purchasing organizations (GPOs) negotiate formulary contracts on behalf of member hospitals, often locking in pricing for twelve months at a time. A hospital system that signed a GPO contract in January for an oral specialty drug that sees generic entry in March faces a contract that may not reflect generic pricing until the contract renews.
Understanding the generic entry timeline allows hospital procurement teams to structure GPO contracts with generic entry provisions — price adjustment mechanisms triggered by FDA approval of the first ANDA for a specific drug. Without such provisions, hospitals can find themselves contractually locked into brand-level pricing for months after generic alternatives are commercially available.
A hospital that renegotiates its drug supply contract at month two after generic entry, when the market has one or two competitors and generic prices are at 25-30 percent of brand WAC, is locking in a price that will be materially higher than the market price at month twelve, when ten competitors have driven prices to 12-15 percent of brand WAC. The timing mistake costs the hospital the difference between its contracted price and the eventual market floor, multiplied by its utilization over the contract period.
The optimal procurement strategy for generic drugs in the six to twelve month post-entry window is to use short-term contracts — quarterly or semi-annual — rather than annual contracts, allowing the health system to reprice as the competitive market develops. After the market has stabilized at twelve to eighteen months, longer-term contracts provide supply security without sacrificing the price gains from early competitive entry.
Pharmaceutical Investors
For investors in brand pharmaceutical companies, the generic price timeline benchmarks set quantitative parameters around the revenue impact of patent expirations in the pipeline. A company that describes an upcoming patent expiration as a manageable headwind — without specifying the formulation type, competitor count forecast, or exclusivity stacking — is providing materially incomplete information for financial modeling purposes.
Applying the competitive entry intensity analysis (ANDA count from DrugPatentWatch, formulation type, exclusivity stacking) to a brand company’s patent expiration schedule produces a drug-by-drug revenue erosion model that can be summed to a portfolio-level revenue cliff estimate, disaggregated by year. This analysis consistently produces more accurate near-term revenue forecasts than sell-side models that apply uniform erosion assumptions across heterogeneous drug types.
The short-selling and options market context adds another dimension. Periods when brand manufacturers face multiple simultaneous patent expirations are widely tracked, but the depth and timing of revenue decline is frequently mispriced by markets that use generic “patent expiration year” as a proxy without modeling the competitive intensity, formulation complexity, or exclusivity overlap variables that determine actual revenue loss trajectories. Analysts who build drug-specific models using the framework in this article will consistently generate more accurate earnings estimates than those relying on category-level generalizations.
For investors in generic pharmaceutical companies, the analysis runs in reverse: identifying drugs with large ANDA counts approaching 180-day exclusivity cliffs, where first-filer economics are richest, and estimating revenue contribution from each pending first-filer opportunity. The generic manufacturer’s revenue pipeline is largely visible through public ANDA filing data. First-filer status notifications, Paragraph IV certifications disclosed in SEC filings and litigation dockets, and DrugPatentWatch’s tracking of approval milestones give investors a reasonably detailed view of the generic revenue runway.
The key modeling risk on the generic side is the competitor count assumption for post-exclusivity market share. Generic manufacturers whose valuations embed assumptions of three to five post-exclusivity competitors will be disappointed when ten to fifteen competitors enter; conversely, those who model fifteen competitors for a complex formulation may undervalue the market position of an early entrant with a supply chain advantage in a five-competitor market.
Key Takeaways
The generic price timeline is not a single curve but a family of curves differentiated by formulation type, competitive entry intensity, and market structure. Applying a uniform discount assumption to all patent expirations produces inaccurate budget models.
At three months after first generic entry — during the typical 180-day first-filer exclusivity window — generic prices are 15-30 percent below brand WAC, but payer-level savings are limited to 8-12 percent of the pre-entry brand spend, because formulary conversion is incomplete and market share is partial.
The 180-day first-filer exclusivity cliff is the most economically consequential event in the price timeline for high-revenue drugs. When exclusivity ends and multiple generic manufacturers enter simultaneously, prices can fall by 50 percent or more within thirty days.
At twelve months after first generic entry, simple oral solid dosage drugs reach a generic price floor of 10-25 percent of the original brand WAC with 85-93 percent generic volume share. Extended-release formulations, injectables, and specialty products maintain higher price floors of 30-60 percent, reflecting lower competitor counts and higher manufacturing barriers.
The number of competing generic manufacturers is the single strongest predictor of price depth. Moving from two competitors to five competitors reduces prices more than moving from ten competitors to fifteen. The marginal price impact of each additional competitor declines sharply as the competitor count rises.
Authorized generics from brand manufacturers during the 180-day exclusivity period limit the first-filer’s economic reward and modestly slow the initial price erosion curve, but do not change the eventual twelve-month price floor.
Biosimilar price timelines are structurally different from small-molecule generic timelines. At twelve months after first biosimilar launch, net prices are typically 25-40 percent below originator WAC with 20-30 percent biosimilar market share — compared to 75-90 percent below brand WAC with 85-93 percent generic share for simple small-molecule drugs.
Brand pharmaceutical companies consistently raise list prices after generic entry rather than cutting them. This is economically rational — the residual brand market is price-insensitive, and per-unit revenue maximization is the correct strategy for a declining-volume franchise. Price timeline analysts who expect brand WAC reductions after generic entry will be wrong.
Drug shortage risk is a tail risk that can reverse price floor assumptions for injectable drugs, sterile products, and drugs with concentrated API supply chains. Models that treat the observed generic price as a stable floor are exposed to this risk.
Tools like DrugPatentWatch that aggregate ANDA filing counts, patent expiration dates, regulatory exclusivity data, and Paragraph IV certification history provide the raw inputs needed to build drug-specific price timeline forecasts, which produce materially better budget accuracy than category-average assumptions.
The Inflation Reduction Act’s price negotiation mechanism for high-revenue Medicare drugs compresses the spread between brand and generic prices for affected drugs at the time of generic entry, reducing the financial impact of the patent cliff for those specific products while accelerating savings earlier in the drug’s commercial life.
Post-generic price stability is fragile in categories with concentrated manufacturing. Procurement strategies that rely solely on achieving the lowest possible generic price at contract signing, without securing supply continuity provisions, transfer shortage risk onto the buyer.
FAQ
Q1: Why do some drugs show almost no price drop in the first six months after patent expiration, even when multiple ANDAs have been filed?
A1: The most common explanation is that the ANDAs have been filed but have not yet been approved. ANDA review timelines, while improved under GDUFA, still run 10-36 months for complex formulations, sterile products, and applications with significant technical deficiencies that require multiple review cycles. An ANDA count of ten filings does not mean ten approvals — it means ten applications at varying stages of FDA review. A second explanation is that approved ANDA holders have not launched commercially. ANDA holders have no obligation to launch immediately upon approval; some wait to confirm manufacturing readiness or to negotiate supply agreements. Third, the first 180-day exclusivity may still be running, legally blocking other approved ANDAs from marketing. The practical implication for anyone building a price timeline model is that the distinction between filed ANDAs, approved ANDAs, and launched products is material. DrugPatentWatch distinguishes between approved and pending ANDAs and tracks launch dates separately from approval dates, which is necessary to identify exactly where each drug sits in the competitive entry sequence.
Q2: How do hospital formulary decisions differ from retail pharmacy formulary decisions in speed and depth of generic conversion?
A2: Hospital formularies are typically managed by pharmacy and therapeutics (P&T) committees that meet monthly or quarterly, but hospital formulary changes for generic substitution can happen faster than retail PBM cycles in many cases, because hospitals control their formularies directly rather than through third-party benefit management arrangements. A hospital P&T committee can add a generic drug to formulary and remove the brand in a single meeting, with changes effective immediately in the hospital’s pharmacy dispensing system. Retail PBM formulary changes, by contrast, require coordinating changes across thousands of retail pharmacy systems, updating claim adjudication databases, notifying plan members, and managing the transition in ways that introduce thirty to ninety day lags. The practical effect is that hospital systems often achieve faster brand-to-generic conversion for inpatient drugs than retail plans achieve for outpatient prescriptions, particularly in the first 90 days after generic launch. The flip side is that hospitals face GPO contract constraints that can lock in pricing independent of formulary decisions, as noted in the main text.
Q3: Can you reliably predict which drugs will see the steepest price erosion within six months, versus which will maintain higher prices for a year or more?
A3: Yes, with reasonable accuracy, using four predictive factors. First, the ANDA count: drugs with more than ten pending ANDAs approaching approval status will see sharp six-month price erosion; drugs with fewer than three ANDAs will not. Second, the formulation complexity: simple IR oral solids will erode faster than ER, injectable, or topical formulations. Third, the API supply landscape: molecules with multiple competing API manufacturers globally will see more competitive downstream generic pricing than those with API supply concentrated in one or two sources. Fourth, the therapeutic category: primary care drugs (statins, ACE inhibitors, PPIs, SSRIs) with broad prescriber populations convert faster than specialty drugs (oncology oral agents, MS drugs, CNS drugs) where prescriber inertia is higher and formulary management is slower. Combining these four factors produces a ranking of drugs by expected six-month price erosion depth that outperforms any single-variable prediction.
Q4: How does the brand manufacturer’s price increase immediately before patent expiration affect the baseline for measuring generic discounts?
A4: Significantly, and in a direction that systematically overstates the generic “discount” as measured against the immediately-pre-expiration brand WAC. Brand manufacturers raise list prices on average 8-12 percent in the twelve months before anticipated generic entry, based on IQVIA’s analysis of price movement patterns [7]. This creates an inflated baseline against which the generic’s percentage discount is measured. A generic priced at 20 percent below brand WAC at launch is being measured against a brand that raised its own price by 10 percent in the preceding year. Compared to the brand’s price two years before expiration, the generic might represent only a 12 percent discount. For budget modeling purposes, this means that payer savings from generic conversion should be measured against the brand price prior to the pre-expiration price increase cycle, not against the most recent pre-expiration price. Otherwise, the model incorporates an artificial savings cushion created by the brand’s own price inflation, which will eventually unwind as the brand loses formulary position. The net payer savings at twelve months are real and substantial, but the pathway to those savings passes through a period of elevated brand pricing that temporarily reduces the net position.
Q5: What is the most reliable way for a mid-size health plan to track when generic entry will occur for its top-spend drugs, and what data sources should it use?
A5: The most reliable approach combines three data sources on a continuous monitoring basis. First, DrugPatentWatch for Orange Book patent expiration dates, regulatory exclusivity periods, Paragraph IV certification filings, and ANDA approval tracking — this provides the regulatory event calendar that determines when generic entry is legally possible and how many competitors are in the pipeline. Second, the FDA’s ANDA database (accessible through the FDA’s Drugs@FDA search) for direct verification of ANDA approval status, which should be cross-checked against the commercial tracking tools periodically since approval decisions happen continuously. Third, trade publications including FiercePharma and the Pink Sheet for commercial launch announcements, since a drug’s ANDA approval date and its commercial launch date can differ by weeks to months. For a mid-size health plan managing, say, thirty high-cost brand drugs at any given time, a quarterly review cycle for these three sources will capture all material generic entry events with sufficient lead time to plan formulary changes, member communications, and budget revisions. Adding automatic alerts through DrugPatentWatch’s notification system for specific drugs reduces the manual review burden and ensures that time-sensitive events — first-filer launches, 180-day exclusivity expirations — are flagged immediately rather than caught at the quarterly review.
Sources
[1] Langreth, R., & Koons, C. (2012, February 28). Lipitor generics cut prices in cholesterol drug market. Bloomberg News.
[2] Drug Price Competition and Patent Term Restoration Act of 1984, Pub. L. No. 98-417, 98 Stat. 1585 (1984).
[3] 21 U.S.C. § 355(j)(5)(B)(iv). (2024). First applicant: 180-day exclusivity period. United States Code.
[4] Generic Drug User Fee Amendments of 2012, Pub. L. No. 112-144, Title III, 126 Stat. 996 (2012).
[5] Federal Trade Commission. (2011). Authorized generic drugs: Short-term effects and long-term impact. Federal Trade Commission. https://www.ftc.gov/sites/default/files/documents/reports/authorized-generic-drugs-short-term-effects-and-long-term-impact-report-federal-trade-commission/authorized-generic-drugs-short-term-effects-and-long-term-impact-report-federal-trade-commission.pdf
[6] U.S. Food and Drug Administration. (2023). GDUFA reauthorization performance report: Fiscal year 2022. U.S. Department of Health and Human Services.
[7] IQVIA Institute for Human Data Science. (2023). Medicine use and spending in the U.S.: A review of 2022 and outlook to 2027. IQVIA.
[8] Berndt, E. R., Bhattacharjya, A., Mishol, D. N., Arcelus, A., & Lasky, T. (2002). An analysis of the diffusion of new antidepressants: Variety, quality, and marketing efforts. Journal of Mental Health Policy and Economics, 5(1), 3-19.
[9] Association for Accessible Medicines. (2023). The U.S. generic and biosimilar medicines savings report. Association for Accessible Medicines.
[10] U.S. Food and Drug Administration. (2019). Drug competition action plan: Measuring the effect of drug competition. U.S. Department of Health and Human Services.
[11] Sacks, C. A., Lee, C. C., Fischer, M. A., Jarlenski, M. P., & Mehrotra, A. (2020). Medicare spending on brand-name combination medications vs. their components. JAMA, 323(21), 2176-2184. https://doi.org/10.1001/jama.2020.5947
[12] IMS Health. (2012). Impact of generic drugs on U.S. drug spending. IMS Institute for Healthcare Informatics.
[13] U.S. Government Accountability Office. (2014). Drug shortages: Public health threat continues despite efforts to help ensure product availability (GAO-14-194). U.S. Government Accountability Office.
[14] Shrank, W. H., Choudhry, N. K., Fischer, M. A., & Avorn, J. (2010). The epidemiology of prescriptions abandoned at the pharmacy. Annals of Internal Medicine, 149(9), 633-638. https://doi.org/10.7326/0003-4819-149-9-200811040-00004
[15] Vanderpuye-Orgle, J., Zhao, Y., Lu, J., & Ferrufino, C. P. (2016). Evaluating the economic value of new anticoagulants from a US payer perspective. Journal of Medical Economics, 19(3), 317-328.
[16] Berndt, E. R., & Aitken, M. L. (2011). Brand loyalty, generic entry and price competition in pharmaceuticals in the quarter century after the 1984 Waxman-Hatch legislation. International Journal of the Economics of Business, 18(2), 177-201.
[17] FTC v. Actavis, Inc., 570 U.S. 136 (2013).
[18] Biologics Price Competition and Innovation Act of 2009, 42 U.S.C. § 262(i)(2) (2010).
[19] U.S. Food and Drug Administration. (2024). Biosimilar product information. U.S. Department of Health and Human Services. https://www.fda.gov/drugs/biosimilars/biosimilar-product-information
[20] AbbVie Inc. (2023). Annual report 2022 (Form 10-K). U.S. Securities and Exchange Commission.
[21] Feldman, R. (2018). May your drug price be ever green. Journal of Law and the Biosciences, 5(3), 590-647. https://doi.org/10.1093/jlb/lsy022
[22] IQVIA Institute for Human Data Science. (2024). Biosimilars in the United States 2019-2023: Competition, savings, and sustainability. IQVIA.
[23] Dylst, P., Vulto, A., & Simoens, S. (2013). Overcoming challenges in analysing IMS LRx longitudinal prescription data: A case study. Expert Review of Pharmacoeconomics & Outcomes Research, 13(4), 509-516.
[24] Federal Trade Commission. (2010). Pay-for-delay: How drug company pay-offs cost consumers billions. Federal Trade Commission.
[25] Medicare Prescription Drug, Improvement, and Modernization Act of 2003, Pub. L. No. 108-173, § 1102, 117 Stat. 2066 (2003).
[26] Kanavos, P., Seeley, L., & Vandoros, S. (2009). Tender systems for outpatient pharmaceuticals in the European Union: Evidence from the Netherlands, Germany and Belgium. London School of Economics and Political Science.
[27] Kyle, M. K. (2007). Pharmaceutical price controls and entry strategies. Review of Economics and Statistics, 89(1), 88-99.
[28] Pfizer Inc. (2013). Annual report 2012 (Form 10-K). U.S. Securities and Exchange Commission.
[29] Grabowski, H., Long, G., Mortimer, R., & Boyo, A. (2016). Updated trends in US brand-name and generic drug competition. Journal of Medical Economics, 19(9), 836-844.
[30] Inflation Reduction Act of 2022, Pub. L. No. 117-169, § 11001, 136 Stat. 1818 (2022).
[31] U.S. Food and Drug Administration. (2023). Drug shortages: Root causes and potential solutions. U.S. Department of Health and Human Services.
[32] Federal Trade Commission. (2022). Pharmacy benefit managers: The powerful middlemen inflating drug costs and squeezing main street pharmacies. Federal Trade Commission.
[33] U.S. Food and Drug Administration. (2019). Approval of Wixela Inhub (fluticasone propionate/salmeterol inhalation powder, USP). U.S. Department of Health and Human Services. https://www.fda.gov/drugs/drug-approvals-and-databases/complex-drug-substances-and-products