In the spring of 2018, a major integrated health system’s pharmacy benefit function projected that biosimilar competition for adalimumab, the active ingredient in AbbVie’s Humira, would materially reduce formulary costs within eighteen months. The projection fed into budget decisions, contract negotiations, and capital allocation across the system’s self-funded plan. The people who built the model were experienced. They used standard financial modeling software. They consulted publicly available FDA approval timelines and drew reasonable inferences about litigation risk from the patent expiration calendar.
They were wrong by more than five years.
AbbVie’s U.S. biosimilar exclusivity wall held until January 2023, a full nine years after the European compound patent on adalimumab expired, and more than seven years after biosimilar developers had filed their first FDA applications. Health systems, payers, and investors who modeled biosimilar entry using small-molecule generic frameworks or simplified patent expiration timelines systematically overstated competition and understated reference product revenues across nearly a decade. The aggregate cost of those modeling errors, measured in misprojected savings, mispriced drug contracts, and incorrect investment theses, ran into the billions of dollars across the U.S. health care system.
The error was not primarily about the specific facts of AbbVie’s portfolio. It was about a category of modeling mistake: applying analytical frameworks designed for one type of pharmaceutical competition to a structurally different type. Biosimilar entry is not generic drug entry with more complexity layered on top. It is a distinct competitive and regulatory phenomenon with its own legal structure, its own commercial dynamics, and its own price erosion curves. Companies that treat it as generics-plus consistently reach wrong conclusions.
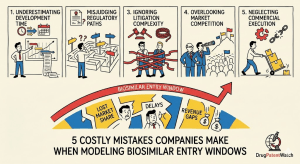
This article identifies the five most costly modeling mistakes that companies make when projecting biosimilar entry windows and shows how to correct each one. The mistakes are specific, actionable, and documented in real commercial outcomes. Getting them right requires understanding the Biologics Price Competition and Innovation Act (BPCIA) patent framework, the FDA’s biosimilar approval pathway, the commercial dynamics that govern biosimilar uptake, and the defensive strategies that reference product sponsors use to maximize their exclusivity windows.
The analysis uses tools like DrugPatentWatch, which tracks biosimilar applications, patent landscapes for biological products, and litigation activity under the BPCIA framework, as a data source for several of the factual claims about specific product patent statuses.
Why Biosimilar Modeling Fails So Often
Before examining the specific mistakes, it helps to understand why the modeling problem is structurally more difficult for biologics than for small-molecule drugs.
The Regulatory Architecture Is Different
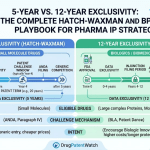
Small-molecule generic entry in the United States is governed by the Hatch-Waxman Act, a legislative framework built around a specific and relatively predictable legal trigger: the Paragraph IV patent certification, which initiates a structured 30-month stay and litigation process. The entry timeline is primarily determined by two variables — when the relevant Orange Book patents expire and whether Paragraph IV litigation succeeds. These variables are analyzable using publicly available patent records.
The BPCIA, enacted as part of the Affordable Care Act in 2010 [1], created a different framework for biosimilar entry that does not rely on Orange Book listing or Paragraph IV certification. Instead, it established a confidential information-sharing process between biosimilar applicants and reference product sponsors — the “patent dance” — that determines which patents are litigated before market entry. The process is optional on the biosimilar applicant’s side in ways that have been contested in federal court, the outcome of which directly affects entry timelines. Modelers who do not understand the patent dance mechanics and their litigation uncertainty cannot build accurate entry windows.
The Technology Is Different
Biological drugs are manufactured in living cells. They are structurally complex proteins or antibodies that cannot be exactly replicated, only approximated. The FDA does not require biosimilars to demonstrate pharmaceutical equivalence to the reference product using a simple two-period crossover pharmacokinetic study, as it does for generic small-molecule drugs. Instead, it requires a “totality of evidence” showing no clinically meaningful difference from the reference product [2].
This difference in evidentiary standards creates a different development and manufacturing complexity profile. Biosimilar development programs typically cost $100-300 million and take seven to ten years from initial cell line development to approval [3]. Manufacturing capacity is constrained. The companies capable of completing a biosimilar development program represent a subset of pharmaceutical manufacturers significantly smaller than the set capable of producing generic tablets or capsules. These supply-side constraints affect how many biosimilar competitors enter any given market, which directly affects the price erosion dynamics.
The Commercial Dynamics Are Different
When a generic drug launches, substitution is largely automatic through the pharmacy dispensing system. Generic drugs rated “AB” by the FDA can be substituted for the brand without physician intervention in most states. Biosimilars do not automatically qualify for this treatment. Only biosimilars designated as “interchangeable” by the FDA can be substituted at the pharmacy without physician intervention under federal law, and state laws governing substitution vary significantly [4].
This means that biosimilar adoption requires active physician prescribing behavior change in most cases, subject to formulary management and step therapy protocols by payers. The uptake dynamics are slower, more variable, and more sensitive to commercial factors (contracting, rebates, patient assistance programs) than generic substitution. Models built on generic penetration curves systematically overstate how quickly biosimilar entry reduces net prices.
Mistake #1: Treating the BPCIA Patent Dance as Predictable
The patent dance is the most misunderstood element of biosimilar entry modeling. Modelers who understand that it exists frequently simplify it into a fixed timeline add-on — “BPCIA litigation takes X months after a biosimilar application” — and then apply that addition uniformly across products. Both parts of that approximation are wrong.
What the Patent Dance Actually Does
Under 42 U.S.C. § 262(l), a biosimilar applicant that files a 351(k) application with the FDA must — or, as subsequent litigation clarified, may but is not required to — provide the reference product sponsor with a copy of its application and manufacturing information within 20 days of receiving FDA notification that its application has been accepted for review [5]. The reference product sponsor then has 60 days to identify patents it believes would be infringed. The parties negotiate a list of patents to litigate. If they cannot agree, a default list is formed by each party submitting a patent list with a prescribed size limit. Litigation on those patents — the “first wave” — begins.
After the biosimilar application is approved by the FDA, the biosimilar applicant must give 180 days’ notice of its intent to market commercially. The reference product sponsor can then seek a preliminary injunction to prevent market entry during that notice period, triggering “second wave” litigation on patents not included in the first wave.
The critical analytical point is that the patent dance timeline is not a single fixed duration. It is a negotiated and litigated process with multiple decision branches, each of which materially affects the timing of lawful market entry.
The Opt-Out Problem
The Supreme Court’s decision in Sandoz Inc. v. Amgen Inc. (2017) [6] resolved the central ambiguity about whether the patent dance was mandatory. The Court held that biosimilar applicants are not required to participate in the patent dance. An applicant can simply decline to provide the reference product sponsor with its application and manufacturing information. The consequence is that the reference product sponsor cannot sue under the BPCIA’s first-wave mechanism. It can only seek an injunction based on a 180-day notice of commercial marketing, at which point it is litigating without the benefit of having reviewed the applicant’s specific manufacturing process.
This opt-out creates a bifurcation in the litigation timeline that most models do not capture. An applicant that participates in the dance typically delays first-wave patent litigation initiation by four to six months compared to an opt-out, but gets the benefit of litigating a scoped, negotiated list of patents rather than facing an emergency injunction motion at a less favorable procedural posture.
Historically, biosimilar applicants have generally participated in the patent dance for complex products with large patent estates, because the structured first-wave litigation provides more certainty about which patents need to be cleared for market entry. For products with smaller patent estates or clearer invalidity arguments, opt-out is more attractive. Modelers who do not analyze this choice for each specific product and applicant pair cannot accurately project when litigation commences or what its scope will be.
First-Wave vs. Second-Wave Patent Selection Strategy
The BPCIA’s list-exchange mechanism requires the reference product sponsor to disclose its patent list within 60 days of receiving the biosimilar application. This disclosure requirement creates strategic incentives. Reference product sponsors have an incentive to list patents broadly, even including patents with uncertain applicability to the biosimilar product, to create litigation uncertainty. Biosimilar applicants have an incentive to challenge the broadest, most commercially threatening patents in the first wave and accept narrower secondary patents in the second wave.
This strategic interaction means that the patents actually litigated in BPCIA proceedings are not simply the ones most likely to be infringed. They reflect both parties’ litigation strategies and risk tolerances. A model that identifies which patents will be challenged by reading the reference product’s patent portfolio without modeling the strategic selection process will identify the wrong set of patents and project incorrect litigation timelines.
The first-wave/second-wave structure also has a temporal implication that modelers frequently miss. Second-wave patents — those that the reference product sponsor chooses to assert only after the biosimilar receives FDA approval — can extend litigation beyond the approval date. A biosimilar that receives FDA approval may still face a preliminary injunction on second-wave patents, extending the effective exclusivity period by months. AbbVie’s BPCIA litigation strategy against several adalimumab biosimilar applicants explicitly used this two-wave structure to maximize the litigation period, and the second-wave injunction risk was a material factor in the decision of most biosimilar applicants to settle rather than risk blocked entry.
How to Model the Patent Dance Correctly
Correct modeling of the patent dance requires four analytical steps that go beyond timeline lookup:
First, map the full patent estate of the reference product using FDA’s Purple Book (which lists biologics license applications and their reference product designations but does not list specific patents the way the Orange Book does) supplemented by the USPTO patent database and structured biosimilar intelligence tools. DrugPatentWatch indexes biosimilar application filings cross-referenced with the patent estates of reference biologics, providing a starting point for identifying the patents most likely to be included in the exchange list.
Second, classify each patent by its likely wave assignment. Patents covering the primary amino acid sequence, the core antibody structure, or the manufacturing cell line are first-wave candidates. Formulation patents, device patents, and patents with uncertain applicability are more likely second-wave, and their litigation timeline follows FDA approval rather than application filing.
Third, assess each first-wave patent’s litigation strength using the same IPR history, prosecution disclaimer, and claims architecture tools described in prior patent portfolio analysis frameworks. Patents with prior PTAB petitions denied at institution are more likely to survive first-wave challenges quickly. Patents with dense prior art or narrow dependent claims covering the commercial embodiment only are more likely to generate settlement pressure.
Fourth, model the decision tree for patent dance participation vs. opt-out for the specific applicant in question, using publicly available information about that applicant’s litigation history, financial resources, and commercial timeline requirements. A well-capitalized biosimilar developer with a competitive advantage from being first to market has different opt-out incentives than one entering a market already served by two approved biosimilars.
Mistake #2: Conflating Regulatory Approval Timelines with Market Entry Timelines
FDA approval of a biosimilar application is not the same as commercial market entry. The gap between these two events is consistently underestimated in entry window models, and the underestimation occurs because of four distinct factors that are typically analyzed independently rather than combined.
The FDA BLA 351(k) Review Timeline
The FDA’s review clock for a biosimilar application runs 12 months from the acceptance date (with a Biosimilar User Fee Act goal of 12 months for standard review and 6 months for priority review) [7]. However, the acceptance date itself follows an initial filing review that can take several months after submission, and complete response letters requesting additional data add further time. The mean time from 351(k) application submission to approval for biosimilars approved through 2022 was approximately 26 months from original submission, with substantial variance depending on the complexity of the totality-of-evidence package [8].
Models that use the 12-month PDUFA goal date as the approval timeline will systematically underestimate approval time. Complete response letters are common for biologics, particularly for complex molecules where manufacturing comparability data is challenging to generate. A biosimilar for a recombinant protein requiring extensive analytical characterization is more likely to receive a complete response letter requesting additional data than a biosimilar for a well-characterized monoclonal antibody.
The Manufacturing Scale-Up Problem
Biosimilar development timelines in the regulatory system are one thing. Commercial manufacturing readiness is another. The manufacturing complexity of large-molecule biologics — particularly monoclonal antibodies requiring mammalian cell culture fermentation, protein purification, and fill-finish operations at scale — means that FDA approval and commercial manufacturing readiness do not always arrive simultaneously.
Cell culture processes for biologic manufacturing require extensive scale-up validation before they produce commercially releasable product at volume. A biosimilar developer that has manufactured clinical trial quantities of a biologic at a 200-liter bioreactor scale must complete separate scale-up validation to a 10,000-liter or 20,000-liter commercial bioreactor scale before it can supply the market. This validation process — including comparability studies demonstrating that the scaled-up product retains biosimilarity to the clinical-stage material — can take 12-18 months after FDA approval [9].
For competitive entry window modeling, this means that market entry date equals the later of: (a) FDA approval, (b) BPCIA patent clearance (either through litigation resolution or settlement), and (c) commercial manufacturing readiness. Models that use FDA approval as the proxy for market entry ignore manufacturing readiness as a binding constraint and consistently project entry windows too early.
The manufacturing readiness variable is difficult to observe externally, but indirect indicators exist. Public company biosimilar developers disclose capital expenditure data on manufacturing facility construction and validation in SEC filings. Contract development and manufacturing organization (CDMO) partner relationships often become public through press releases. Inspection records for manufacturing facilities, including facility assessment letters from the FDA, appear in public databases. A model that incorporates these indicators will generate a more accurate commercial readiness timeline than one that uses only the regulatory approval timeline.
The Interchangeability Designation Gap
FDA interchangeability designation — the determination that a biosimilar can be substituted for the reference product at the pharmacy without physician intervention — requires additional switching studies beyond standard biosimilar approval requirements [10]. These studies must demonstrate that the risk in terms of safety or diminished efficacy of alternating or switching between the biosimilar and reference product is not greater than the risk of maintaining the patient on the reference product.
Interchangeability creates a commercial advantage for biosimilar developers that is substantial in high-volume self-administered products dispensed through the pharmacy channel. Insulins, certain autoimmune biologics like adalimumab, and other self-administered biologics generate a meaningful share of their volume through pharmacy dispensing rather than through specialty pharmacy or infusion center administration.
Models that project biosimilar market share without distinguishing between products with and without interchangeability designations will overestimate penetration in pharmacy-channel products and underestimate the commercial value of interchangeability. For products where pharmacy-channel dispensing represents more than 40 percent of volume, the interchangeability timeline — which typically runs 18-24 months behind standard biosimilar approval for applicants that pursue it — is a material input to the market entry model. <blockquote> “Of the more than 40 biosimilars approved by the FDA through mid-2023, fewer than 15 had received interchangeability designations, reflecting the additional clinical and analytical requirements that distinguish interchangeable biosimilars from standard approved biosimilars.” [11] </blockquote>
The Insulin Glargine Case: A Timeline Lesson
The biosimilar entry history for insulin glargine — Sanofi’s Lantus — illustrates how the gap between regulatory approval and meaningful market entry operates in practice. Basaglar, developed by Eli Lilly and Boehringer Ingelheim, received FDA approval in December 2015 but did not launch commercially until December 2016, after settling patent litigation with Sanofi [12]. The settlement included a twelve-month delayed entry provision.
Toujeo, Sanofi’s higher-concentration reformulation of insulin glargine approved in February 2015, had by the time of Basaglar’s commercial entry captured a substantial portion of the patient population previously treated with standard Lantus. This formulation shift — a defensive strategy by Sanofi that is analyzed in more detail under Mistake #3 — meant that Basaglar entered a market that had already been partially restructured by the reference product sponsor’s commercial response.
Models built before Toujeo’s approval that projected insulin glargine biosimilar entry without accounting for the reference product reformulation risk were forecasting competition against a product population that had already partially migrated to a protected formulation. The lesson is not specific to insulin — it applies wherever reference product sponsors have the capability and incentive to execute formulation transitions ahead of biosimilar entry.
Building a Realistic Approval-to-Entry Timeline
The entry window model should use a triangulated approach to timeline estimation. The regulatory track provides a floor estimate (earliest possible entry assuming no manufacturing delays and immediate patent clearance). The manufacturing readiness assessment provides a second constraint. The BPCIA litigation analysis provides a third. The binding entry date in any scenario is the last of these three constraints to be resolved.
For scenario planning, analysts should model:
The base case, in which regulatory review runs at the median approval time for comparable products, manufacturing is ready within 18 months of approval, and BPCIA litigation resolves through settlement at a date that tracks historical resolution timing for comparable patent estates.
The delayed case, in which a complete response letter adds 12 months to the regulatory timeline, manufacturing scale-up requires an additional 12 months beyond the base case, and patent litigation runs to final judgment rather than settlement.
The accelerated case, in which the applicant qualifies for priority review based on a biosimilar designation in a therapeutic area of unmet need, manufacturing is ready at the time of approval, and patent litigation resolves early through consent judgment.
The spread between the delayed and accelerated scenarios in this framework is frequently four to seven years for complex biologics — a range that, if not properly communicated, creates the false precision that underlies most biosimilar entry modeling errors.
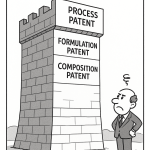
Reference product sponsors do not passively wait for biosimilar competition to arrive. They execute deliberate defensive strategies that use their formulation and device patent portfolios, their manufacturing intellectual property, and their commercial position to extend the effective period of market exclusivity beyond the primary biological compound’s patent term.
Models that project biosimilar entry based only on the primary biologics patent — typically the original patent on the amino acid sequence of the protein or antibody — without accounting for the defensive patent layer are projecting entry into a market that the reference product sponsor has been actively preparing to defend.
The Evergreening Toolkit for Biologics
The mechanisms reference product sponsors use to extend exclusivity fall into four categories, each with distinct legal and commercial dynamics:
Formulation patents covering changes to the drug’s excipients, pH, concentration, or delivery format. These are particularly effective for autoinjector or prefilled syringe products, where the delivery device is itself a significant component of the value proposition to patients and prescribers.
Device patents covering the autoinjector, prefilled syringe, or other drug delivery system used with the biologic. These patents do not cover the drug itself, and biosimilar applicants can theoretically develop different delivery devices. But the practical consequence is that biosimilars launched with different devices face a “device switch” concern from prescribers, which creates uptake resistance even when the biological molecule is identical.
Manufacturing process patents covering specific cell culture conditions, purification methods, or formulation processes. These patents create a dilemma for biosimilar developers: to demonstrate biosimilarity, they must produce a biologic that looks analytically like the reference product, which may require replicating aspects of the manufacturing process that are patented.
Combination patents covering the reference biologic co-administered with another drug or used in a specific combination regimen. Where clinical evidence supports a particular combination as a standard of care, a combination patent can restrict biosimilar substitution in that clinical context.
AbbVie’s Humira portfolio executed all four strategies systematically, filing more than 311 U.S. patents related to adalimumab (the molecule, its formulations, its autoinjectors, its manufacturing processes, and its clinical uses), with more than 100 of those patents issuing after 2014 — that is, after biosimilar development programs were already underway [13]. This portfolio construction was deliberate and coordinated, using continuation prosecution to generate new patents timed to the biosimilar development programs’ anticipated completion dates.
Formulation Transition Risk
The most commercially impactful defensive strategy for biosimilar entry modeling purposes is the pre-emptive formulation transition — the reference product sponsor reformulating the product in a way that creates a protected new product ahead of biosimilar entry, then transitioning patients to the new formulation through its commercial machinery.
Sanofi’s Toujeo transition ahead of insulin glargine biosimilar entry has already been mentioned. AbbVie’s transition to Humira Citrate-Free — a reformulation that reduced injection site pain by removing citrate buffer from the formulation — was filed and prosecuted with claims covering the specific citrate-free, high-concentration adalimumab formulation [14]. Biosimilar developers who had designed their products to match the original citrate-containing formulation faced a choice when the citrate-free formulation became the commercial standard: reformulate to match, which required new analytical comparability data, or launch with the original formulation and accept a commercial disadvantage.
Models that do not identify the pipeline of pending formulation applications for a reference product — available through the FDA’s NDA and supplemental approval records and cross-referenceable with patent prosecution data — cannot project this transition risk accurately.
DrugPatentWatch’s product-level patent tracking, which cross-references FDA approval records with patent prosecution timelines, provides a structured way to identify pending formulation supplement applications and their associated patent prosecution. An analyst reviewing adalimumab’s patent landscape in 2013 who used this data would have identified the pending citrate-free formulation applications and their associated continuation prosecution, which would have revised the biosimilar entry model substantially.
Manufacturing Process Patents and the Biosimilarity Dilemma
Manufacturing process patents for biologics create a peculiar analytical problem. A biosimilar developer that has produced a product analytically comparable to the reference biologic has, by definition, used manufacturing conditions that produce similar protein structures. To the extent that those conditions are covered by reference product process patents, the biosimilar manufacturer may be infringing even if its specific process is nominally different from the patented process.
The doctrine of equivalents — which holds that a product or process that performs substantially the same function in substantially the same way to achieve the same result can infringe even if it does not literally meet every element of a claim [15] — is particularly consequential for biomanufacturing. The “same result” (a structurally comparable protein) and the “same way” (producing it in a mammalian cell culture system with specific nutrient conditions) are often present simultaneously with the “same function” argument, creating infringement exposure even for processes nominally distinct from the patented one.
Models that assess biosimilar entry risk without reviewing manufacturing process patents in the reference product’s portfolio will understate litigation risk. Specifically, they will classify the infringement risk as resolved once the chemical comparability argument is addressed, without identifying the process patent layer as a separate litigation pathway that the reference product sponsor can use to delay entry.
The Role of Physician Prescribing Transition
Beyond the patent portfolio, reference product sponsors execute commercial transition strategies that reduce the effective patient population available for biosimilar capture at the time of entry. These strategies include:
Long-term patient assistance programs that lock patients onto the reference product before biosimilar entry, creating switching inertia. Patients who have been stable on a biologic for three to five years, whose physicians are reluctant to switch them for financial reasons, and who have been enrolled in manufacturer copay assistance programs represent a population with very low switching probability.
Contracting strategies with payers and pharmacy benefit managers that bundle the reference product with other products in the manufacturer’s portfolio, creating tiered formulary positions that are commercially entrenched before biosimilar entry.
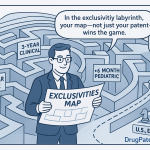
Data exclusivity periods — specifically the 12-year BPCIA exclusivity for reference biologics [16] — that prevent FDA approval of any 351(k) application during the exclusivity period, giving reference product sponsors a defined regulatory window to execute these commercial strategies before the competitive environment changes.
Entry window models that project market share uptake for biosimilars without accounting for the accumulated commercial position of the reference product at the time of biosimilar entry — measured by the depth of long-term patient assistance program enrollment, payer contract structures, and formulary position stability — will overestimate first-year biosimilar market share by a factor that, in documented cases, ranges from two to five times actual share.
Mistake #4: Underestimating the Commercial Uptake Delay
Even when a biosimilar achieves lawful FDA approval and clears all patent and regulatory hurdles, the speed at which it captures market share follows a pattern that is fundamentally different from small-molecule generic penetration. Models that use generic penetration curve parameters to project biosimilar uptake — even as a rough approximation — systematically overstate year-one and year-two biosimilar share and understate the timeline to meaningful share levels.
Why Generic Penetration Curves Do Not Apply
The standard academic model of generic drug penetration, derived from studies of post-exclusivity entry for oral solid dosage forms, describes rapid share capture: 80-90 percent volume substitution within 12-24 months of first generic entry, driven primarily by pharmacy-level substitution that does not require physician intervention [17].
The mechanisms driving this penetration curve are specific to small-molecule generic dynamics. State pharmacy laws mandate or permit pharmacist substitution of AB-rated generics without a new prescription. Pharmacy benefit managers push generic substitution through tiered formulary structures that require beneficiaries to pay the full branded product cost if they choose brand over generic when a rated generic is available. Physicians largely accept this substitution because generics are pharmaceutical equivalents — the same molecule at the same dose in the same dosage form — and prescribers have limited professional concern about substitution.
None of these mechanisms apply automatically to biosimilars. Pharmacy substitution requires an interchangeability designation and state law authorization. Even states that have enacted laws permitting interchangeable biosimilar substitution typically require pharmacist notification to the prescriber and patient consent [18]. PBM formulary mechanisms can favor biosimilars but require active formulary management decisions, not automatic substitution. Physician acceptance of switching is not uniform — particularly for patients who have been stable on a biologic for years — and it requires active prescriber education and engagement.
The commercial result is that biosimilar uptake follows a logistics curve with a much longer ramp period than generic penetration. The inflection point — where biosimilar market share begins rising steeply — typically occurs 24-36 months after first biosimilar launch, not 3-6 months as with generic oral solids.
Formulary Management as the Governing Variable
The single most important commercial variable in biosimilar uptake is formulary position — specifically, whether major pharmacy benefit managers and commercial insurance plans put the biosimilar on a preferred tier (typically Tier 2 or specialty Tier status) and remove the reference product from preferred status.
This decision is driven primarily by the net pricing the biosimilar offers after rebates and discounts compared to the reference product. Reference product sponsors typically respond to biosimilar entry by increasing rebates to maintain formulary position, creating a rebate escalation dynamic that delays or prevents the formulary transition that would drive volume to the biosimilar.
The adalimumab market in the United States illustrates this dynamic with unusual clarity because the data is now retrospective. Multiple adalimumab biosimilars launched in January 2023 after the AbbVie exclusivity settlement expired. By the end of 2023, AbbVie had maintained over 80 percent market share for adalimumab in U.S. commercial formularies, not because the biosimilars lacked approval or interchangeability designations (several had obtained them), but because AbbVie’s rebating strategy preserved formulary position for Humira with the major PBMs [19].
The model implication is that biosimilar uptake projections must incorporate a formulary transition probability assessment — the likelihood, in each major payer segment, that the biosimilar achieves preferred formulary status within the projection window. This probability depends on: the list price discount the biosimilar offers, the reference product sponsor’s expected rebating response, the PBM’s economic interest in driving generic-like substitution (which varies by formulary structure and beneficiary cost-sharing design), and the therapeutic area’s sensitivity to physician prescribing inertia.
The Specialty Pharmacy vs. Retail Pharmacy Split
Biosimilars distributed through specialty pharmacy channels face additional uptake friction compared to those distributed through retail pharmacy. Specialty pharmacy represents approximately 55 percent of biologics dispensing by value [20], and specialty pharmacies operate under distribution agreements with manufacturers that can create structural preferences for specific products.
A reference product sponsor that has exclusive distribution agreements with major specialty pharmacies — or that offers rebates and data-sharing programs that create financial relationships with specialty pharmacy operators — can maintain product access advantages that slow biosimilar penetration even after formulary decisions have nominally favored the biosimilar.
Models that project biosimilar uptake using aggregated market share data without segmenting the specialty pharmacy vs. retail pharmacy channel separately will generate uptake curves that average together two populations with very different dynamics: retail pharmacy (where interchangeability and formulary management drive faster substitution) and specialty pharmacy (where distribution relationships and clinical monitoring programs slow switching).
Provider Buy-and-Bill Biologics: A Third Dynamic
For biologics administered in infusion centers or physician offices under the buy-and-bill system — where providers purchase the product and bill insurance for its administration — the uptake dynamics are governed by provider economics, not patient or pharmacy preferences.
Under the average sales price (ASP) system used by Medicare Part B, providers are reimbursed at ASP plus 6 percent for drugs administered in their offices. For a biologic with an established ASP, this creates a reimbursement spread. A biosimilar entering at a list price discount to the reference product initially generates a lower absolute reimbursement amount (ASP-plus-6 is 6 percent of a lower number), which reduces the provider’s financial incentive to switch patients.
This ASP-plus-6 dynamic, combined with the inventory management complexity of maintaining multiple biologic products in a clinical setting, creates provider-level switching resistance that is absent in the pharmacy dispensing channel. Models that project biosimilar penetration for infusion-administered biologics using retail pharmacy penetration parameters will overestimate share by ignoring the buy-and-bill economic friction.
The Adalimumab Penetration Reality Check
The actual adalimumab biosimilar market share data from 2023 provides the clearest available calibration point for biosimilar penetration models. Despite nine biosimilar adalimumab products approved and five that launched commercially in 2023, AbbVie’s combined share of adalimumab prescriptions in the United States remained above 80 percent at year-end 2023 [21].
Even among payers that had moved to biosimilar-preferred formularies, the transition was slower than projected. Patients already on Humira required active prescriber intervention to switch, and prescribers were cautious about switching stable patients to biosimilars without strong financial incentives or explicit payer direction. New patients entering therapy were captured by biosimilars at higher rates — particularly where PBMs implemented prior authorization requirements favoring biosimilars for new starts — but the existing patient base remained largely with the reference product.
This experience represents a lower bound for biosimilar penetration in a competitive class, because adalimumab is a market where biosimilars have had every structural advantage: multiple approved interchangeable biosimilars, active PBM formulary management programs, and substantial list price discounts from biosimilar manufacturers. If biosimilar penetration was slower than most models projected in this most favorable scenario, models for biologics with fewer biosimilar competitors, fewer interchangeability designations, or more complex administration channel dynamics should project even slower uptake.
Calibrating the Uptake Model
Correct uptake modeling for biosimilars uses class-specific historical uptake data rather than generic penetration curve parameters. The relevant historical comparators are:
Infliximab biosimilars (launched 2016-2020 in the U.S. market) in the infusion-administered segment, where penetration tracked buy-and-bill economics.
Pegfilgrastim biosimilars (launched 2018-2019) as a relatively favorable penetration environment, where the product is used prophylactically in oncology and payer management is particularly active.
Trastuzumab biosimilars (launched 2019-2020) as a comparator for oncology biologics in hospital and outpatient infusion settings.
Each of these provides a different calibration point for a different commercial access pathway. An uptake model for a new biosimilar should use the most structurally comparable historical analogue, not a generic curve.
Price erosion — the decline in effective net price for the reference product once biosimilar competition begins — follows a fundamentally different pattern for biologics than for small-molecule drugs. The difference is not just in magnitude but in structure: which pricing mechanism is eroded first, how quickly the erosion occurs, and what the new competitive equilibrium looks like.
The Generic Price Cliff vs. the Biosimilar Price Slope
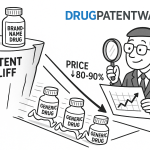
For small-molecule drugs, patent expiration typically triggers a price cliff: list price drops rapidly for both the branded product and the generic, and net prices converge toward the generic floor within 12-24 months in competitive markets [22]. The speed and depth of the cliff depend on the number of generic entrants — Grabowski et al.’s documentation of the generic market shows that average generic prices fall to roughly 30-40 percent of the branded price with three or more generic competitors [23].
This cliff model does not describe biosimilar market dynamics. Instead, biosimilar entry triggers price competition that is slower, less deep, and more amenable to differentiation strategies by the reference product sponsor. The reasons are structural:
Biosimilars are typically priced at 15-35 percent discounts to the reference product’s list price at launch, compared to generic discounts of 80-90 percent. The smaller initial discount reflects the higher development cost of biosimilar programs, the smaller number of competitors, and the commercial access friction described in Mistake #4.
Reference product sponsors respond to biosimilar entry with rebate increases — in some cases offering rebates so large that the net price of the reference product is competitive with or lower than the biosimilar’s list price for payers who maintain the reference product on preferred formulary. This creates a dual-price market where the list price and the net price tell different stories.
The net price convergence between reference products and biosimilars occurs primarily in the commercial insurance and PBM channel. In Medicare Part B (buy-and-bill) and Medicare Part D (pharmacy benefit), different pricing mechanisms apply, and the convergence timing differs.
The List Price vs. Net Price Confusion
Many biosimilar entry models project revenue impact on the reference product using list price (WAC) discounts from the biosimilar. This is an analytical error that understates the competitive resilience of reference product revenue in the near-term and overstates it in the long-term.
When a biosimilar launches at 20 percent below WAC, and the reference product sponsor simultaneously increases PBM rebates by 15-20 percentage points to maintain formulary position, the reference product’s net price to payers may change very little in the first year. The revenue impact to the reference product sponsor is lower than the list price discount suggests, because the rebate increase is not tracked in WAC-based analyses.
The long-term dynamic is the reverse problem: eventually, if biosimilar manufacturers are willing to accept low net prices to capture volume, and if PBMs structure formularies to reward that competition, the net price floor for the reference product is substantially lower than list price models suggest.
An accurate biosimilar price impact model uses net pricing data — actual transaction prices, net of rebates and discounts — rather than list price discounts. For public companies, net pricing information is disclosed in quarterly earnings calls and SEC filings, though not always at the product level. IQVIA and MMIT (Managed Markets Insight and Technology) data products provide channel-level net price estimates for major biologics that can be used as calibration inputs.
The Interchangeability Premium Effect on Pricing
Biosimilars that obtain FDA interchangeability designation can command a pricing premium over non-interchangeable biosimilars in the same class, because interchangeability enables pharmacy-level substitution — a structural commercial advantage. In markets where interchangeable biosimilars compete against non-interchangeable biosimilars, price stratification typically emerges: interchangeable biosimilars price at smaller discounts to the reference product (capturing value from the substitution right) while non-interchangeable biosimilars price at larger discounts to compete on net cost alone.
This stratification affects models in two ways. First, projections of market share for an individual biosimilar product must account for its position within the competitive biosimilar set as well as its position relative to the reference product. A non-interchangeable biosimilar entering a market where two interchangeable biosimilars are already present faces a two-level competitive challenge.
Second, the formulary incentive structure changes when interchangeable biosimilars are available. PBMs and plans have a stronger incentive to implement formulary restrictions when they can mandate automatic substitution at the pharmacy, because the substitution can occur without prescriber or patient intervention. The presence of interchangeable biosimilars in a market is therefore a trigger for more aggressive formulary management, which accelerates net price erosion across the entire biosimilar class.
Historical Price Erosion Benchmarks for Biologics
Academic and industry research on biosimilar pricing has produced a set of empirical benchmarks that should anchor any biosimilar entry price model:
In the infliximab market, where biosimilar competition began in 2016, the net price of Remicade in the commercial insurance segment declined approximately 40-50 percent over five years from first biosimilar entry, with the majority of erosion occurring through rebate increases rather than WAC reductions [24].
In the pegfilgrastim market, where competition from biosimilars was more intense (due to multiple entrants including interchangeable biosimilars), net price erosion was approximately 50-60 percent over four years, with market share capture of 60-70 percent going to the combined biosimilar set [25].
In the European biosimilar markets, which have operated longer and under different rebate dynamics, price erosion for monoclonal antibodies has been more aggressive — 50-80 percent list price declines in tender markets, with reference product sponsors in some cases voluntarily reducing list prices significantly to remain competitive [26].
A price erosion model for a new biosimilar entry scenario should select the most appropriate benchmark based on the competitive dynamics of the specific market — number of biosimilar competitors expected, presence of interchangeable biosimilars, channel mix (infusion vs. pharmacy, commercial vs. government), and reference product sponsor’s financial capacity and strategic incentive to defend with rebates.
The Government Payer Complication
The Inflation Reduction Act’s Medicare drug price negotiation mechanism, which became operational for the first wave of negotiated drugs in 2026, intersects with biosimilar entry modeling in a specific way. Under the IRA, biologics are not eligible for Medicare price negotiation for 13 years from approval, compared to 9 years for small-molecule drugs [27]. This 4-year additional exclusivity period was specifically negotiated as part of the legislative compromise and reflects the higher development cost of biologics.
For entry window models, this means that reference biologics within their 13-year exclusivity window cannot be subject to IRA price negotiation even if they have biosimilar competition. The IRA’s negotiation mechanism therefore applies to older biologics — those approved more than 13 years ago — and removes a piece of the pricing floor that would otherwise support reference product pricing. A biologic that is negotiated under IRA to a lower Medicare price is less able to offer competitive rebates to maintain commercial formulary position, which may in fact accelerate net price erosion in the commercial segment relative to pre-IRA dynamics.
The precise modeling implication depends on the vintage of the reference product. For biologics approved in the last decade, the IRA is not immediately relevant to the entry window. For older biologics whose 13-year window has elapsed, IRA negotiation is a pricing floor constraint that entry models must incorporate.
The Integrated Biosimilar Entry Model
The five mistakes described above each correct a specific model input. Together, they define the structure of an integrated biosimilar entry model that substantially outperforms the simplified approaches typically used.
Model Architecture
The integrated model has four linked components that should be built sequentially:
The patent clearance timeline model estimates the date range within which BPCIA litigation is resolved and lawful commercial entry is possible. It inputs the patent estate mapping, BPCIA dance participation/opt-out assessment, first-wave and second-wave patent strength assessment, and historical BPCIA litigation duration for comparable patent estate sizes.
The regulatory and manufacturing readiness model estimates the date range for FDA approval and commercial manufacturing readiness. It inputs the 351(k) application filing date, an assessment of complete response letter probability based on the complexity of the biosimilar’s analytical package, manufacturing capacity indicator data, and interchangeability designation timeline if applicable.
The commercial uptake model projects market share capture as a function of time after entry, using channel-specific penetration curves calibrated against historical biosimilar analogues. It inputs the channel mix of the target biologic market, the expected formulary management environment, interchangeability designation status, and the competitive biosimilar set size.
The net price impact model projects the reference product’s revenue trajectory net of biosimilar competition and reference product sponsor defensive pricing. It inputs historical net price benchmark data, the reference product sponsor’s balance sheet capacity for rebate escalation, and the channel-specific net price dynamics.
The outputs of these four components feed into a product-level revenue projection for both the reference product (declining) and the biosimilar(s) (growing), which can then be used for payer budget impact modeling, investment thesis construction, or competitive intelligence for reference product commercial planning.
Scenario Planning Structure
Each component generates a range rather than a point estimate. The integrated model runs across four scenarios that capture the commercially meaningful distribution of outcomes:
Scenario A (Base case): Median assumption on each component — patent clearance at the historical median, approval timeline at average without complete response letter, formulary penetration at historically observed rates for comparable product classes, net price erosion at infliximab benchmark.
Scenario B (Delayed entry): Patent litigation extends to final written decision rather than settlement, complete response letter adds 12 months to approval timeline, reference product sponsor executes formulation transition before biosimilar entry, formulary resistance maintains reference product position for 24 months.
Scenario C (Rapid entry): Biosimilar applicant opts out of patent dance, patent clearance occurs through successful IPR petitions ahead of litigation, FDA issues priority review classification, interchangeability designation is obtained simultaneously with approval, major PBM implements biosimilar-preferred formulary immediately at entry.
Scenario D (Market restructure): Reference product sponsor implements formulation transition, multiple biosimilar entrants arrive near-simultaneously, major PBM moves reference product to non-preferred tier, IRA negotiation applies if product is within the eligible vintage window.
The spread between Scenarios A and B is the range that planning and contracting decisions should be based on. Scenario C represents the upper bound for biosimilar developer commercial models. Scenario D represents the reference product sponsor’s stress test for revenue durability.
Calibrating Scenario Probabilities
Assigning probabilities to each scenario requires empirical grounding, not gut estimation. The most defensible approach anchors each scenario component’s probability against historical base rates from the BPCIA litigation record, FDA biosimilar approval history, and commercial uptake data.
The probability of a complete response letter for a biosimilar application can be estimated from FDA approval records: roughly 25-35 percent of biosimilar applications receive a CRL during initial review based on the 2015-2022 approval history [8]. This base rate should be adjusted upward for complex biologics (pegylated proteins, fusion proteins, antibody-drug conjugates) and downward for well-characterized monoclonal antibodies with extensive analytical packages.
The probability of BPCIA first-wave patent litigation resolving through settlement versus judicial decision can be estimated from the public BPCIA case record available through PACER. Historical data through 2022 shows that approximately 70-80 percent of BPCIA cases that progress past the motion-to-dismiss stage resolve by settlement rather than final written decision, with settlement timing concentrated in the 12-18 month window after litigation initiation.
The probability of a major PBM implementing a biosimilar-preferred formulary within two years of first biosimilar launch depends on the therapeutic area and the rebate dynamics. In anti-TNF products (infliximab, adalimumab), the historical rate of major PBM formulary transition to biosimilar-preferred within two years was approximately 30-40 percent of formulary contracts through 2023, though this figure is increasing as PBMs develop more structured biosimilar adoption programs.
These base-rate inputs allow the scenario probabilities to be set empirically rather than arbitrarily, which makes the model more defensible in investment committee or board presentations.
Data Infrastructure Requirements
Running an integrated model of this complexity requires reliable, structured data inputs from multiple sources. Patent status for biologics reference products is complicated by the absence of a simple Orange Book equivalent for biologics — the Purple Book identifies reference products and approved biosimilars but does not list patents.
DrugPatentWatch addresses this gap by tracking biosimilar applications and cross-referencing them with the patent estates of reference biologics drawn from USPTO records, providing a structured data set that includes patent expiration dates, prosecution status, PTAB petition history, and BPCIA litigation filing records where public. For analysts building biosimilar entry models, this consolidated data infrastructure reduces the research time required to populate the patent clearance component from weeks to days.
FDA data sources — the Purple Book for biosimilar application status, the FDA’s ANDA and BLA databases for manufacturing facility approval records, and the FDA’s Drug Shortages database for supply reliability signals — supplement the patent data with regulatory status information.
Commercial data inputs — IQVIA claims data for market share tracking, MMIT formulary data for payer position, and broker research for net pricing estimates — complete the commercial uptake and price impact components.
No single data source provides all inputs. The model requires integration across multiple databases, which is precisely the task that structured pharmaceutical intelligence platforms are designed to support.
Case Study: Trastuzumab (Herceptin) and the Biosimilar Entry Sequence
Roche’s trastuzumab, sold as Herceptin for treatment of HER2-positive breast cancer and gastric cancer, became one of the most commercially significant biologics of the early biosimilar competition period. Its entry pattern illustrates both the complexity of the integrated entry model and the specific ways in which simplified modeling fails.
The Patent and Exclusivity Landscape
Trastuzumab received FDA approval in 1998. The primary composition patent covering the humanized anti-HER2 antibody expired in 2019. The 12-year BPCIA data exclusivity period had long since elapsed. By the time the first biosimilar applications were submitted to the FDA starting in 2014, the primary barrier to biosimilar entry was not statutory exclusivity but litigation over formulation and manufacturing process patents.
Roche’s defensive patent portfolio for trastuzumab included formulation patents covering the specific lyophilization and reconstitution characteristics of the commercial product, manufacturing process patents covering aspects of the cell culture and purification process, and method-of-use patents covering specific dosing regimens used in the approved indications [28].
A simplified entry model looking at the primary composition patent’s 2019 expiration would have projected FDA approval and market entry beginning around 2018-2019, allowing time for biosimilar development programs that started in 2014 to clear the development timeline. This projection was approximately correct in the European market — Roche’s Herceptin patent protections are structured differently under European patent law, and biosimilar entry in Europe began in 2018.
Why the U.S. Entry Sequence Was More Complex
In the United States, Roche’s BPCIA litigation strategy involved first-wave patent assertions against multiple biosimilar applicants beginning in 2015-2016, as each applicant engaged in the patent dance or was sued after providing the 180-day marketing notice. Settlements were reached with several applicants on terms that included specified market entry dates in the 2019-2020 timeframe.
The settlements themselves — which are publicly disclosed in corporate filings and BPCIA court records — specified the earliest dates on which each biosimilar could launch. For Mylan/Biocon’s Ogivri, the settlement allowed U.S. commercial entry in December 2019. For Samsung Bioepis and Merck’s Ontruzant, entry was permitted in February 2019. Pfizer/Celltrion’s Herzuma launched in January 2020 [29].
The spread between biosimilar launch dates — reflecting different settlement terms negotiated from different legal positions — is itself an analytical input for models projecting the competitive intensity at each point in time. In early 2019, only one biosimilar was commercially available. By mid-2020, five were available. The market share capture rate for each additional entrant depends on when it enters relative to the competitive landscape at that moment.
Penetration Dynamics in Oncology
Trastuzumab in oncology infusion centers followed the buy-and-bill pattern. Provider switching decisions were governed by ASP-plus-6 economics, clinical familiarity with the reference product, and the availability of manufacturer support programs. Market share capture by the biosimilar set was gradual — the combined biosimilar share of trastuzumab was approximately 25-30 percent by the end of 2020, a year after first biosimilar entry, compared to what simplified generic penetration models would have projected as 60-70 percent [30].
The revenue implications for Genentech/Roche were substantially more favorable than a simplified entry model would have projected. Net revenue from trastuzumab in the U.S. declined, but at a rate consistent with a 30-36 month trajectory to significant share loss, not the 12-18 month trajectory that generic models would project.
For biosimilar developers who had modeled rapid penetration to justify the capital investment in their development programs, the actual penetration rate represented a commercial miss that affected peak revenue projections and, for some smaller developers, threatened the economics of the entire program.
Case Study: Infliximab (Remicade) and the Rebate Defense
The infliximab biosimilar market is the most studied example of reference product sponsor rebate defense and its effect on biosimilar penetration. The Johnson & Johnson (Janssen) Remicade story illustrates Mistake #4 and Mistake #5 operating simultaneously.
The Market Structure
Infliximab is administered by intravenous infusion in hospital and infusion center settings. It occupies the buy-and-bill segment almost entirely. Two biosimilars — Inflectra (Pfizer/Celltrion) and Renflexis (Samsung Bioepis/Merck) — received FDA approval in 2016 and 2017 respectively and launched commercially at list price discounts of approximately 15-35 percent to Remicade [31].
Simple market entry models projected that the two biosimilars together would capture 30-40 percent of infliximab volume within two years based on their price discount and the general secular trend toward value-based formulary management.
The Rebate Defense
J&J responded to biosimilar entry with an aggressive rebate program for commercial payers. The program offered substantial rebates on Remicade — reported in healthcare industry coverage and J&J’s own earnings disclosures as sufficient to bring net prices to levels competitive with biosimilar net prices — in exchange for exclusive or preferred formulary placement [32]. The rebates were conditional on Remicade maintaining formulary exclusivity or preferred status in the payer’s formulary, creating an explicit commercial incentive to exclude biosimilars.
This strategy was legally challenged. In 2019, Pfizer filed an antitrust lawsuit against J&J alleging that the exclusive dealing contracts constituted illegal monopoly maintenance [33]. The litigation is instructive for modeling purposes even beyond its antitrust implications: it demonstrated, in evidentiary detail, that the rebate defense was effective — biosimilar penetration of the infliximab market through 2019 was substantially below pre-entry projections, and the mechanism was the exclusive dealing contracts.
The antitrust lawsuit and subsequent regulatory attention (including a 2020 HHS report on rebate practices and biosimilar access) [34] ultimately created some erosion in J&J’s ability to maintain the exclusive dealing structure. By 2021-2022, biosimilar infliximab penetration had increased to 20-25 percent of the market, but this trajectory was three to four years slower than simplified entry models had projected.
The Modeling Lesson
The infliximab case provides a specific and calibrated lesson: for high-revenue buy-and-bill biologics where the reference product sponsor has both the financial capacity to offer large conditional rebates and the legal authority to structure exclusive or semi-exclusive arrangements with payers, biosimilar penetration can be suppressed to approximately 20 percent or below for two to three years post-entry. The reference product sponsor’s rebate capacity — measurable from its gross margin, the product’s revenue contribution, and historical rebate practices — should be an explicit input to the uptake model.
For payers and health systems using entry models for budget planning, the implication is different from that for biosimilar developers. The payer question is not just “when will biosimilar penetration reduce my costs” but “is our formulary actively structured to capture biosimilar savings, or is our rebate contract with the reference product sponsor undermining the savings opportunity?” The models that answered this question accurately were those that incorporated the reference product sponsor’s rebate defense as a structural feature of the competitive landscape, not an incidental commercial decision.
The Pfizer Antitrust Case as an Analytical Framework
Pfizer’s 2017 antitrust suit against J&J, which proceeded through substantial discovery before reaching settlement, generated a publicly available evidentiary record about how exclusive dealing contracts are structured in practice. The case’s amended complaint described J&J contracts with hospital systems that required Remicade exclusivity as a condition for receiving bundled rebates on the J&J product portfolio — not just Remicade, but across immunology and other therapeutic areas [33].
This bundling mechanism is analytically important for biosimilar entry modeling because it means the reference product’s rebate defense is not just a function of that product’s own margin. It is a function of the entire reference product sponsor’s portfolio economics. A sponsor with a broad commercial portfolio can offer cross-product bundled discounts that are unavailable to a biosimilar manufacturer competing only on the specific biologic in question. The practical implication is that biosimilar developers entering markets against sponsors with large, commercially diverse portfolios face a rebate defense capacity that cannot be estimated from the reference product’s individual margin alone.
The courts’ treatment of these arrangements — which varies between antitrust permissibility and impermissibility depending on the extent of market foreclosure — is itself a variable in the entry model. After the FTC and DOJ increased scrutiny of pharmaceutical exclusive dealing arrangements in 2021-2022, several reference product sponsors modified their contracting structures to reduce explicit exclusivity requirements. Whether these modifications genuinely changed the competitive dynamics, or simply changed the documentation while preserving the economic effect, is something that market share data will reveal over the next several years.
For entry window models, the prudent approach is to model rebate defense capacity conservatively high in the near-term (years one and two post-entry) and discount it in the medium-term (years three through five) to reflect both the erosion of contract cycles and the regulatory risk of exclusive dealing enforcement. This creates a characteristic S-shaped biosimilar penetration curve in the model output — slow initial capture, accelerating in years two and three as payer contracts re-open and formulary transitions take effect, then decelerating as the remaining high-inertia patient population resists switching.
Implications for Reference Product Sponsors
The modeling failures described in this article create asymmetric information advantages for parties who get the analysis right. For reference product sponsors — the companies defending branded biologic revenue against biosimilar entry — the integrated framework provides a clearer picture of their actual defensive position.
Identifying True Vulnerability Windows
A reference product sponsor that can accurately project its true patent clearance timeline, accounting for all BPCIA litigation decision branches, knows which years it must defend commercially versus which years it can rely on legal barriers. This projection informs two decisions: how aggressively to invest in continuation patent prosecution to extend the legal barrier window, and how early to begin the commercial defensive strategies (formulation transition, exclusive contracting, patient assistance program enrollment) that will govern penetration rates after legal barriers fall.
Companies that use simplified models consistently mistime these commercial defensive investments. They either invest too early — spending on commercial defense before the legal window has been determined, when those resources might be better deployed in clinical development — or too late, beginning commercial defense after biosimilar applicants have already secured FDA approval and commercial launch infrastructure.
The Patent Prosecution Timeline as a Commercial Decision
For continuation applications pending during an active biosimilar development period, the integrated entry model directly informs prosecution strategy. If the model projects that the primary patent estate will provide legal exclusivity through a specific year, and commercial defensive investments can sustain market share for two to three years beyond that, the value of a continuation patent that would extend legal exclusivity by two additional years is quantifiable: it equals the net revenue protected by two additional years of legal barrier minus the probability of claim invalidity, discounted appropriately.
This value calculation should drive the resource allocation decision for continuation prosecution. Legal departments that make prosecution decisions on technical merit alone, without connecting the expected value of issued claims to the commercial timeline, spend inconsistently with the economic value of their patent portfolio.
Transition Therapy Strategy and the Successor Product
The most commercially resilient defensive strategy for a reference product sponsor is not extending the exclusivity of the existing biologic but accelerating the transition of patients to a successor product that has independent, full-term protection. The successor can be a next-generation biologic with improved clinical characteristics, a fixed-dose combination that adds a protected co-component, or a device improvement that is clinically meaningful enough to command prescriber preference.
Roche’s transition from intravenous Herceptin to the subcutaneous formulation approved in Europe in 2013 and in the United States in 2019 — Herceptin Hylecta, developed with Halozyme’s ENHANZE drug delivery technology — is one example of a device-and-formulation combination creating a protected successor [28]. The subcutaneous formulation has independent patents on the recombinant hyaluronidase enzyme component and the injection delivery method, and offers a genuine clinical convenience benefit (administration time of approximately five minutes versus 30-90 minutes for intravenous infusion) that creates prescriber preference independent of financial incentives.
For entry window models, the existence of a clinically meaningful successor product — identifiable from FDA NDA and supplemental BLA databases — should be treated as a market-share capture ceiling for biosimilars to the original formulation. The patient population that has migrated to the subcutaneous formulation is not available for biosimilar capture of the intravenous product. Modeling biosimilar intravenous trastuzumab without accounting for the subcutaneous transition that had already occurred will overestimate the available market for biosimilar capture.
Implications for Biosimilar Developers
Biosimilar developers who have incorporated the integrated entry framework into their investment decisions make materially better capital allocation choices than those relying on simplified models.
The First-Mover vs. Later-Entrant Economics
The integrated model changes the calculation of first-mover premium in biosimilar markets. In small-molecule generics, the 180-day first-filer exclusivity creates a well-defined first-mover premium: the first approved ANDA for a Paragraph IV certification product earns a period of exclusivity before other generic competitors enter. The value of this exclusivity period is calculable and drives the economics of Paragraph IV litigation investment.
No direct equivalent to the 180-day exclusivity exists for biosimilars. The BPCIA’s 12-year reference product exclusivity does not benefit the biosimilar developer. The first biosimilar approved in a class does benefit from a period before additional biosimilar competition, but the duration and commercial value of this lead are highly variable.
An integrated model that projects the timing of the second and third biosimilar entrant in a class — based on the pipeline of 351(k) applications available through FDA records and DrugPatentWatch’s biosimilar application tracking — provides the first biosimilar developer with a realistic window for capturing first-mover commercial advantage. If the model projects that the second biosimilar will enter the market 18 months after the first, the first biosimilar’s commercial strategy should be designed to capture the maximum formulary penetration possible within that window before losing the first-mover competitive position.
The Contracting Window and Its Commercial Value
The first biosimilar to enter a market has a contracting window — the period before additional biosimilars arrive — during which it negotiates formulary position with PBMs and health plans. In this window, the first biosimilar faces only the reference product as its competition and can typically offer a smaller net price discount to achieve preferred formulary position. Once a second biosimilar enters, price competition between biosimilars begins, eroding the net price the first biosimilar can sustain.
The commercial value of the first-mover contracting window depends on the duration of the window (time to second biosimilar entry) and the depth of the formulary penetration the first biosimilar can lock in before the second entrant arrives. Multi-year formulary contracts — which typically run one to three years — signed during the first-mover window can provide protected revenue even after biosimilar competition intensifies. Biosimilar commercial teams that spend the first-mover window building multi-year formulary contracts rather than chasing individual high-volume prescribers will generate more durable revenue than those focused on immediate prescriber-level penetration.
This insight has a direct modeling implication: the first-mover premium should be measured not in market share captured in year one but in contracted revenue that is locked through multi-year formulary agreements. Developers who project first-mover value using year-one market share as the primary metric will undervalue long-duration formulary contracts and make suboptimal commercial investment decisions in the first twelve months post-launch.
The Biosimilar Development Cost-Recovery Model
Biosimilar programs that cost $150-250 million to develop and launch require a realistic revenue model to justify the investment. The integrated entry model’s output — a probability-weighted range of revenue scenarios across five to ten years post-launch — is the direct input to that cost-recovery calculation.
A typical biosimilar program economics model projects peak annual net revenue, time to peak (which depends on the uptake curve from the commercial model), duration of above-cost revenue generation (which depends on when subsequent biosimilar entrants drive price below a sustainable level), and net present value of the full revenue stream discounted at the developer’s cost of capital. The integrated model’s probability-weighted range allows this NPV calculation to be expressed as a distribution rather than a point estimate, with the 25th percentile scenario representing the downside against which the investment must be stress-tested.
Programs that show positive NPV only under the accelerated entry scenario and negative NPV under the base case or delayed entry scenario should not attract investment at the capital levels required for biosimilar development. Programs that show positive NPV even under the delayed case, and attractive risk-adjusted returns under the base case, represent rational capital allocation targets. The investment discipline that distinguishes between these two categories requires exactly the kind of integrated modeling this article describes.
Interchangeability as a Strategic Priority
The integrated model quantifies the commercial value of interchangeability designation — additional market share capture in the pharmacy channel, formulary management advantages with PBMs — and compares it against the additional development cost and timeline required to obtain it (additional switching studies, 12-24 months of additional clinical study time).
For products where pharmacy dispensing represents a large share of the market (subcutaneous autoinjector biologics, insulins, self-administered growth hormone), the commercial value of interchangeability is typically large relative to the development cost. For products distributed primarily through infusion centers and specialty pharmacy (intravenous monoclonal antibodies, complex biologics requiring clinical monitoring), the commercial premium for interchangeability is smaller.
Biosimilar developers who make the interchangeability decision based only on FDA regulatory requirements, without quantifying the commercial value against the additional investment, systematically misallocate their development capital.
Using Patent Landscape Data in Development Program Selection
The decision of which reference product to target for a biosimilar program — made years before FDA approval and commercial entry — should be informed by the integrated entry model applied prospectively to candidate reference products. Developers that select targets based primarily on peak reference product revenue, without fully modeling the patent clearance timeline, the BPCIA litigation risk, the reference product sponsor’s defensive capabilities, and the competitive biosimilar applicant set, will consistently target products where the economic return is lower than the revenue figure suggests.
DrugPatentWatch’s biosimilar intelligence module tracks 351(k) applications filed, cross-referenced with the patent estate of each reference product, providing a prospective competitive map of the biosimilar development pipeline. A developer evaluating whether to enter a program for Reference Biologic X can assess not just the reference product’s commercial profile but also how many other developers have already filed 351(k) applications, what the likely settlement timeline will be for first-wave patent litigation based on the patent estate size and strength, and whether the entry window is economically viable given the development investment required.
This analysis belongs at the beginning of the development program decision, not after the Phase III biosimilar study has been completed and the FDA application has been filed.
Understanding the First-Filer Dynamic for 351(k) Applications
Unlike Hatch-Waxman’s 180-day first-filer exclusivity, which creates well-defined first-mover economics for Paragraph IV ANDA filers, the BPCIA does not grant formal exclusivity to the first biosimilar applicant. This absence of a statutory first-mover incentive has created a different competitive dynamic: biosimilar developers race to be first to market not because they receive a defined exclusivity period but because they receive a period of competitive biosimilar market exclusivity by default — the time between their commercial launch and the next biosimilar entrant’s approval.
The commercially valuable first-mover window is therefore determined by when the second biosimilar applicant receives FDA approval and achieves commercial readiness. Modeling this window requires tracking the entire pipeline of 351(k) applications against the reference product, assessing each applicant’s development timeline and manufacturing readiness, and projecting approval timing for the second and third entrant as well as the first. Developers who model only their own timeline without tracking the competitive applicant pipeline are making capital allocation decisions with incomplete information about the duration of their first-mover window.
The Policy Dimension: Access, Competition, and Modeling Accuracy
The modeling mistakes described in this article have implications beyond the financial interests of companies and payers. When biosimilar entry windows are misestimated, the resulting distortions in contracting, investment, and policy decisions have downstream effects on patient access and drug pricing.
Payer Budget Impact Modeling
Hospitals, health plans, and self-funded employer groups rely on biosimilar entry window models to project pharmacy benefit costs and make formulary management decisions. When those models overestimate biosimilar penetration (as has historically been the case), plan sponsors build budgets that assume cost savings that do not materialize. The shortfall requires either benefit cost increases, formulary restrictions on other drugs, or acceptance of higher-than-projected costs.
More fundamentally, when payers believe that biosimilar competition will naturally deliver savings without active formulary management — because the models project rapid generic-like penetration — they fail to take the active formulary management steps (step therapy requirements, prior authorization for branded biologics, preferred biosimilar tier placement) that would actually deliver those savings. The modeling error becomes self-fulfilling: by assuming competitive dynamics that don’t materialize without active management, payers fail to take the actions that would create those dynamics.
Policy Misallocation
Federal and state policy directed at biosimilar competition — including interchangeability legislation, rebate reform, and ASP reimbursement policy — has been informed by market projections that systematically overestimate biosimilar penetration. Policy interventions designed to accelerate biosimilar penetration that is already projected to be rapid will have different effects than interventions in a market where penetration is structurally constrained by the mechanisms described in this article.
The IRA’s biosimilar competition carve-out (the 13-year negotiation exclusivity for biologics) was based in part on assessments of how effectively biosimilar competition restrains biologic prices. A more accurate model of biosimilar penetration rates — one that incorporates the formulary resistance, buy-and-bill friction, and rebate defense mechanisms documented here — would generate different policy conclusions about how much market protection biologics require before price negotiation is appropriate.
ASP-Plus-6 Reform Proposals and Their Modeling Implications
Several federal reform proposals have focused on changing the Medicare Part B ASP-plus-6 reimbursement structure for biologics and their biosimilars, specifically to create stronger financial incentives for provider switching. The most discussed reform is ASP-plus-6 for reference biologics combined with a biosimilar-specific reimbursement premium (ASP-plus-8 or ASP-plus-16) that gives providers a higher margin for administering biosimilars than for administering reference products [34].
If implemented, these reforms would materially change the buy-and-bill penetration curve described in Mistake #4. Under current ASP-plus-6 for all products, providers are indifferent between the reference product and a biosimilar on reimbursement grounds alone (both earn 6 percent over their respective ASPs), and may prefer the reference product for familiarity and risk-avoidance reasons. Under a differential premium structure, providers would earn more per biosimilar administration, creating active financial incentives to switch stable patients.
Entry window models built under current reimbursement rules should be maintained in a policy-adjusted variant that reflects this potential structural change. For products where Medicare Part B infusion represents a large share of the market (infliximab, rituximab, bevacizumab), the policy-adjusted scenario can show materially different penetration curves than the current-law baseline. Companies making long-term capital allocation decisions in this space — particularly hospital health systems, infusion center operators, and biosimilar developers targeting infusion-administered products — should sensitivity-test their financial models against this policy scenario even if its legislative probability is uncertain.
State-Level Interchangeability Law Variation
The commercial impact of interchangeability designation varies significantly by state because state laws governing pharmacist substitution authority for interchangeable biosimilars are not uniform. As of 2024, 49 states had enacted biosimilar substitution laws, but the provisions differ in notification requirements, patient consent requirements, record-keeping obligations, and the operational processes required before pharmacist substitution can occur [18].
These legal variations create a state-by-state commercial access map that is material for products where retail pharmacy dispensing is a large share of the volume. A biosimilar with interchangeability designation that enters a market where the three highest-volume states for that product have burdensome notification or consent requirements will see slower pharmacy-channel penetration than the national interchangeability status would suggest.
Building the state law variation into an uptake model requires mapping the product’s geographic volume distribution against the state substitution law framework. For national brands with relatively uniform geographic volume, the averaging effect makes state law variation a secondary concern. For products with highly concentrated geographic volume — urban population centers for certain specialty biologics — the law in the top five or six states can dominate the penetration outcome.
Building the Correction: A Practical Summary
The five mistakes represent five specific corrections to standard biosimilar entry models. Each correction requires additional data inputs, but none requires fundamentally new analytical capability.
For the BPCIA patent dance mistake: use the full patent estate mapping, model the opt-out decision for the specific applicant, and build a litigation decision tree that distinguishes first-wave and second-wave patent timing. Patent data from DrugPatentWatch and PTAB records from the USPTO populate this analysis.
For the approval-to-entry timeline mistake: triangulate between the regulatory timeline, manufacturing readiness indicators, and BPCIA litigation resolution. Use FDA facilities data and public company capital expenditure disclosures as manufacturing readiness proxies. Model complete response letter probability based on biosimilar complexity class.
For the defensive strategy mistake: map the reference product’s formulation and device patent prosecution pipeline, not just its issued patent estate. Track FDA supplemental NDA applications for formulation changes. Use DrugPatentWatch’s pending application tracking to identify continuation prosecution against which the entry model must be stress-tested.
For the uptake model mistake: segment the market by commercial channel (retail pharmacy, specialty pharmacy, buy-and-bill) and use class-specific historical penetration data for each segment. Incorporate an explicit formulary management probability assessment and a reference product sponsor rebate defense capacity estimate.
For the price erosion mistake: use net price data — not list price — calibrated against the most comparable historical biosimilar market. Apply the interchangeability premium effect if the entering biosimilar has obtained or is pursuing interchangeability designation. Model the dual-price market structure that emerges when reference product sponsor rebates are competitive with biosimilar list prices.
Key Takeaways
The BPCIA patent dance is not a fixed timeline. The opt-out decision by biosimilar applicants, the first-wave and second-wave patent selection strategy, and the litigation decision tree structure all create substantial variance in when lawful market entry occurs. Accurate models must capture this variance, not smooth it into a single timeline assumption.
FDA approval is a necessary but not sufficient condition for commercial market entry. Manufacturing readiness and BPCIA patent clearance each represent independent binding constraints. The commercial entry date is the last of these three constraints to be satisfied.
Reference product sponsors execute systematic defensive strategies — formulation transitions, continuation patent prosecution targeted at biosimilar development timelines, device patent portfolios, and exclusive rebate contracting — that materially extend the effective period of market exclusivity beyond the primary biological compound’s patent term. These strategies are identifiable through pending application tracking and prosecution history analysis before they become market-visible.
Biosimilar uptake is governed by formulary management decisions, interchangeability designation status, and channel-specific commercial friction, not by the automatic substitution mechanics that drive generic penetration. Class-specific historical analogues (infliximab, trastuzumab, pegfilgrastim) provide calibration points. Generic penetration parameters do not.
Net price data — not list price — governs the actual revenue trajectory for reference products under biosimilar competition. Reference product sponsor rebate defense can suppress net price erosion for two to three years post-entry, particularly in buy-and-bill settings. Models calibrated against list price discounts will overstate the revenue impact of biosimilar entry in the near-term and potentially understate it in the medium-term once rebate defense capacity is exhausted.
The integrated biosimilar entry model links four separate components — patent clearance timeline, approval-to-entry timeline, commercial uptake, and net price impact — and runs across multiple scenarios with explicit probability weighting. Outputs should be expressed as revenue ranges, not point estimates, with the scenario spread clearly communicated to decision-makers.
The Inflation Reduction Act’s 13-year negotiation exclusivity for biologics means that the policy environment affecting reference product pricing in the government payer segment will differ between older biologics (eligible for negotiation) and more recently approved biologics (still protected). Entry models that ignore this segmentation will misestimate the net price floor for reference products depending on their approval vintage.
Biosimilar developer program selection decisions should incorporate the integrated entry model prospectively — before development programs begin — using patent landscape data, competitive applicant tracking, and reference product sponsor defensive capability assessments to project the realistic commercial return on the development investment.
Payers who rely on simplified biosimilar entry models without taking active formulary management steps are not passive beneficiaries of a competitive process. They are participants in a system where the reference product sponsor’s rebate defense is explicitly designed to reward payers who do not manage formularies to biosimilar access. The modeling insight and the formulary management decision are linked.
The adalimumab experience — where nine approved biosimilars coexisted with 80 percent reference product share for more than a year after patent exclusivity ended — is not an anomaly. It is a calibration point for what biosimilar competition looks like without active formulary management in a high-rebate reference product market.
FAQ
Q1: How do you determine whether a biosimilar applicant will opt out of the BPCIA patent dance, and what is the practical effect on the entry timeline if they do?
A1: The opt-out decision is not observable before it happens, but you can assess its probability by analyzing four factors about the specific applicant. First, the applicant’s balance sheet and litigation risk tolerance — smaller biosimilar developers without large litigation portfolios are more likely to opt out to avoid the cost and complexity of extended BPCIA first-wave litigation. Second, the size and complexity of the reference product’s patent estate — products with large patent estates make opt-out more attractive because engaging in the dance could result in a very large first-wave litigation burden. Third, the timing of the applicant’s commercial readiness — an applicant with manufacturing capacity ready to deploy commercially has a stronger incentive to opt out and seek rapid entry than one still in scale-up. Fourth, prior behavior of the applicant in BPCIA proceedings — several large biosimilar developers have established patterns of dance participation or avoidance that reflect their institutional legal strategy.
The practical effect on timeline depends on whether the reference product sponsor responds by seeking a preliminary injunction during the 180-day notice period. If the reference product sponsor seeks an injunction and obtains it, the timeline is extended by the duration of injunction litigation — potentially 12-18 months. If no injunction is sought or granted, the opt-out can actually accelerate entry by skipping the six-month exchange and negotiation phase of the patent dance, effectively starting the 180-day notice period earlier. The net direction of the timing effect is therefore not predictable without modeling the specific injunction risk for the specific reference product’s patent estate.
Q2: What is the most effective way to model the reference product sponsor’s rebate defense capacity, and how do you incorporate it into a market share projection?
A2: Rebate defense capacity has three components that can be estimated from publicly available data. First, the gross margin of the reference biologic product, which sets the upper bound on how large a rebate the sponsor can offer while maintaining positive contribution margin. For large-molecule biologics, gross margins are typically in the 70-80 percent range based on cost-of-goods estimates from biosimilar developer disclosures. Second, the revenue concentration of the reference product within the sponsor’s overall portfolio — a product that represents more than 30 percent of total company revenue will attract disproportionate commercial defense investment, while a product representing 5 percent may be more readily defended through product line transitions to protected successor products. Third, the competitive rebate benchmark from comparable therapeutic areas, which can be estimated from MMIT formulary data and public company disclosure of rebate-adjusted net prices.
To incorporate rebate defense into a market share model, you build a two-stage structure. Stage one models the formulary decision by major PBM segments: given the biosimilar’s net price offering and the reference product sponsor’s expected maximum rebate response, what net price does the PBM face for each option, and which does the PBM’s contract economics incentivize? Stage two converts the formulary decision into a market share outcome using historical penetration data for the channel mix of the specific product class. The output is a probability-weighted market share distribution rather than a single number, with the distribution shaped by the uncertainty in the reference product sponsor’s actual rebate response.
Q3: How does the FDA’s interchangeability designation affect the BPCIA patent dance, if at all?
A3: The BPCIA patent dance process is structurally independent of the interchangeability designation — the dance is triggered by the 351(k) application, not by the interchangeability data package. A biosimilar applicant can file for interchangeability simultaneously with its original 351(k) application or as a supplement after initial approval, and neither filing changes the patent exchange obligations or litigation rights.
Where interchangeability indirectly affects BPCIA strategy is in the commercial stakes calculation. An applicant pursuing interchangeability has stronger economic incentives to achieve the earliest possible commercial entry, because the commercial value of interchangeability erodes if competitors obtain interchangeability first and capture pharmacy formulary positions. This higher economic urgency may push the applicant toward opt-out and rapid entry strategies rather than extended patent dance participation. Reference product sponsors are aware of this dynamic and may calibrate their litigation strategy accordingly — in some cases choosing to settle earlier with interchangeability-pursuing applicants whose market share capture potential is higher, to obtain favorable settlement terms before the commercial stakes increase further.
Q4: What does the European biosimilar market experience tell us about the ultimate equilibrium that U.S. biosimilar competition will reach, and over what timeframe?
A4: European biosimilar markets have operated longer and under different pricing dynamics than the U.S. market, making direct comparison imperfect. However, the European experience does define an empirical ceiling for biosimilar penetration and price erosion. In European tender markets for monoclonal antibodies — particularly infliximab biosimilars in Scandinavian countries and trastuzumab biosimilars in Germany — combined biosimilar market share reached 70-90 percent within three to four years of first entry, with list price reductions of 50-70 percent from original reference product prices. These penetration levels were achieved under European tender systems that make formulary decisions centrally and with less room for reference product rebate defense than in the U.S. commercial market.
In the U.S. context, the evidence from adalimumab and infliximab suggests that the equilibrium market share for the biosimilar set will settle in the 50-70 percent range over a three-to-five year horizon, but only if active payer formulary management drives the transition — not passively. The net price erosion for the reference product in that equilibrium is 30-50 percent from its pre-biosimilar net price levels, most of which occurs through rebate increases rather than list price cuts. The U.S. market is unlikely to replicate European tender dynamics unless the formulary management structure changes substantially, which the Inflation Reduction Act’s formulary and rebate reform provisions may or may not accomplish depending on their ultimate implementation.
Q5: For a biosimilar developer evaluating a new development program today, which publicly available data sources provide the most reliable input for building a prospective integrated entry model?
A5: The most reliable publicly available inputs, organized by model component, are:
For the patent clearance component: USPTO patent database for issued patent and pending application records; PTAB for IPR petition history and outcomes; PACER for BPCIA district court litigation records; DrugPatentWatch for structured biosimilar application cross-references to reference product patent estates, which significantly reduces the manual research burden.
For the regulatory timeline component: FDA’s Purple Book for biosimilar application status; FDA’s CDER drug database for BLA review timelines; FDA’s Complete Response Letter data in annual reports on biosimilar program activity; EMA’s biosimilar assessment reports for European approval experience that is often a leading indicator of U.S. approval complexity.
For the manufacturing readiness component: SEC 10-K and 10-Q filings for public biosimilar developers disclosing capital expenditure plans; FDA facility inspection records in the FDA Establishment Inspection Report database; WHO prequalification records for manufacturing facilities, which indicate international GMP status and can be a proxy for U.S. readiness.
For the commercial uptake component: IQVIA National Sales Perspectives data for historical market share by product (subscription required); MMIT formulary data for payer formulary position tracking; public company earnings transcripts from biosimilar developers disclosing actual vs. projected penetration.
For the net price component: quarterly earnings transcripts from reference product sponsors disclosing net price realization; IQVIA net price estimates from published academic literature using SSR data; CMS drug spending data for Medicare Part B net price trends.
The integration of these sources is the principal analytical challenge. Structured pharmaceutical intelligence platforms that pre-link patent records with biosimilar application data — as DrugPatentWatch does for the patent clearance component — provide meaningful efficiency over manual database querying, particularly for the patent estate mapping step that is foundational to the entire model.
Sources
[1] Biologics Price Competition and Innovation Act of 2009, 42 U.S.C. § 262 (2010).
[2] Food and Drug Administration. (2015). Scientific considerations in demonstrating biosimilarity to a reference product: Guidance for industry. U.S. Department of Health and Human Services.
[3] Dranitsaris, G., Jacobs, I., Kirchhoff, C., Popovian, R., & Shane, L. G. (2017). Drug tendering: drug supply and shortage implications for the uptake of biosimilars. ClinicoEconomics and Outcomes Research, 9, 573-584.
[4] National Conference of State Legislatures. (2023). State laws and legislation related to biologic medications and substitution of biosimilars. NCSL.
[5] 42 U.S.C. § 262(l)(2)(A). (2010). Biosimilar biological product development – Application contents. United States Code.
[6] Sandoz Inc. v. Amgen Inc., 582 U.S. 1 (2017).
[7] Food and Drug Administration. (2023). Biosimilar user fee act (BsUFA) IV performance goals and procedures: Fiscal years 2023 through 2027. U.S. Department of Health and Human Services.
[8] Food and Drug Administration. (2023). Biosimilar and interchangeable products: Purple Book database. U.S. Department of Health and Human Services. https://www.fda.gov/drugs/biosimilars/biosimilar-and-interchangeable-products
[9] Rader, R. A., & Langer, E. S. (2018). Biopharmaceutical manufacturing: Historical and future trends in titers, yields, and efficiency in commercial-scale bioprocessing. BioProcess International, 16(1), 10-20.
[10] Food and Drug Administration. (2019). Considerations in demonstrating interchangeability with a reference product: Guidance for industry. U.S. Department of Health and Human Services.
[11] IQVIA Institute for Human Data Science. (2023). Biosimilars in the United States 2023-2027: Competition, savings, and sustainability. IQVIA.
[12] Food and Drug Administration. (2015). FDA approves Basaglar, the first follow-on insulin glargine product to treat diabetes [Press release]. U.S. Department of Health and Human Services.
[13] Feldman, R., & Frondorf, E. (2017). Drug wars: A new generation of generic pharmaceutical delay. Harvard Journal on Legislation, 53(2), 499-564.
[14] AbbVie Inc. (2015). Humira (adalimumab) injection: Citrate-free formulation approval. AbbVie Inc.
[15] Warner-Jenkinson Co. v. Hilton Davis Chemical Co., 520 U.S. 17 (1997).
[16] 42 U.S.C. § 262(k)(7)(A). (2010). Reference product exclusivity. United States Code.
[17] Grabowski, H., Long, G., Mortimer, R., & Boyo, A. (2016). Updated trends in US brand-name and generic drug competition. Journal of Medical Economics, 19(9), 836-844.
[18] National Conference of State Legislatures. (2022). Biosimilar substitution: State laws and legislation. NCSL.
[19] Berkrot, B. (2024, February 2). AbbVie retains Humira market share despite biosimilar competition. Reuters Health. https://www.reuters.com/business/healthcare-pharmaceuticals
[20] IQVIA Institute for Human Data Science. (2022). The use of medicines in the US 2022: Usage and spending trends and outlook to 2026. IQVIA.
[21] AbbVie Inc. (2024). Annual Report 2023 (Form 10-K). U.S. Securities and Exchange Commission.
[22] Sacks, C. A., Lee, C. C., Kesselheim, A. S., & Dusetzina, S. B. (2021). Medicare spending on brand-name combination medications vs their component generics. JAMA, 325(8), 787-794.
[23] Grabowski, H., Long, G., & Mortimer, R. (2014). Recent trends in brand-name and generic drug competition. Journal of Medical Economics, 17(3), 207-214.
[24] Hernandez, I., Sampathkumar, S., & Good, C. B. (2020). Changes in brand-name biologic prices over a 5-year period. Annals of Internal Medicine, 172(10), 658-663.
[25] IQVIA Institute for Human Data Science. (2021). Biosimilars in the United States 2021-2025: Competition, savings, and sustainability. IQVIA.
[26] Moorkens, E., Vulto, A. G., Huys, I., Dylst, P., Godman, B., Keupacki, S., … & Simoens, S. (2017). Policies for biosimilar uptake in Europe: An overview. PLOS ONE, 12(12), e0190147.
[27] Inflation Reduction Act of 2022, Pub. L. No. 117-169, § 11001, 136 Stat. 1818 (2022).
[28] Declerck, P. J., & Danesi, R. (2019). Biosimilars: A beginner’s guide. Targeted Oncology, 14(Suppl 1), 3-10.
[29] Food and Drug Administration. (2020). Purple Book database of licensed biological products. U.S. Department of Health and Human Services.
[31] Pfizer Inc. (2017). FDA approval of Inflectra (infliximab-dyyb) [Press release]. Pfizer Inc.
[32] Johnson & Johnson. (2019). Annual Report 2018 (Form 10-K). U.S. Securities and Exchange Commission.
[33] Pfizer Inc. v. Johnson & Johnson, No. 2:17-cv-04180-JCJ (E.D. Pa. 2019).
[34] U.S. Department of Health and Human Services. (2020). Rebating drug prices: The case for reform. Office of the Assistant Secretary for Planning and Evaluation.