Executive Summary: The Financial Physics of Exclusivity
The pharmaceutical industry approaches a defining economic event: the scheduled expiration of intellectual property protections for a cohort of the world’s highest-revenue therapeutic assets. Between 2025 and 2030, the sector faces a “patent cliff” of unprecedented magnitude, with revenue at risk estimated between $236 billion and $400 billion.1 This period involves the loss of market exclusivity (LOE) for nearly 200 blockbuster drugs, including oncology stalwarts like Keytruda and immunology leaders like Stelara.1
For the executive leadership of a pharmaceutical enterprise—spanning Intellectual Property (IP), Business Development (BD), and Finance—this is not merely a cyclical contraction. It is a systemic stress test of the corporate valuation model. When a small-molecule blockbuster loses patent protection, it does not experience a gradual sales decline. It faces a catastrophic revenue hemorrhage, often shedding 80% to 90% of its value within 12 months of generic entry.1 The variance between a managed decline and a financial disaster lies in the precision of the forecasting function.
Historically, patent tracking was an administrative task relegated to legal back-offices, often managed via static spreadsheets. This approach is obsolete. The modern exclusivity environment is characterized by extreme complexity: the “patent dance” of biologics, the legislative disruption of the Inflation Reduction Act (IRA), and the litigious volatility of “at-risk” generic launches. A forecast error of a single quarter can represent a variance of hundreds of millions of dollars in cash flow, creating unacceptable risks for inventory management, R&D allocation, and investor guidance.
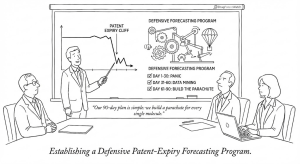
This report provides a rigorous, 90-day operational framework to establish an elite patent-expiry forecasting program. It rejects the passive monitoring of regulatory lists in favor of active, data-driven intelligence. By integrating legal status, manufacturing signals, and commercial analytics into a unified predictive engine, organizations can transform patent data from a compliance requirement into a competitive advantage.
Phase I (Days 1–30): Auditing the Data Foundation
The initial phase of program implementation focuses on sanitation and structure. In many pharmaceutical organizations, critical data concerning asset longevity is fragmented across functional silos. Legal teams maintain patent dockets; regulatory teams track exclusivity periods; commercial teams manage sales forecasts. These silos create dangerous blind spots. The objective of the first 30 days is to dismantle these barriers and establish a Single Source of Truth (SSOT).
Establishing the Single Source of Truth (SSOT)
The most pervasive risk in patent forecasting is the “Excel Trap”—the reliance on manual spreadsheets to track dynamic legal dates.4 Spreadsheets are static; the patent system is kinetic. A manual tracker fails to account for daily adjustments in patent terms, the filing of terminal disclaimers, or the sudden imposition of a 30-month litigation stay.
To establish an SSOT, the organization must audit its internal records against the definitive external standards. This requires a granular mapping of every commercial asset to its corresponding intellectual property portfolio. This is not simply a matter of listing patents. It requires identifying the “Pivotal Patent”—the specific legal instrument that serves as the final barrier to entry in each jurisdiction.5
Table 1: The Data Audit Checklist
Data Field
Strategic Relevance
Common Audit Failure
Filing Date
Determines the 20-year nominal term baseline.
Confusing the priority date with the filing date, leading to 12-month errors.
Grant Date
Trigger for Patent Term Adjustment (PTA) calculations.
Ignoring PTA additions caused by USPTO delays.
Regulatory Exclusivity
Non-patent barriers (NCE, Orphan, Pediatric) that run concurrently or consecutively.
Failing to identify that exclusivity expires after the patent.
Terminal Disclaimers
Legal filings that tie a patent’s expiry to an earlier patent in the family.
Assuming a later-granted patent extends the term when it is legally tethered to an earlier expiry.
Litigation Status
Active Paragraph IV challenges or Inter Partes Reviews (IPR).
Missing a 30-month stay trigger that delays generic approval regardless of patent validity.
The audit must also address the “family” problem. A drug protected by a Composition of Matter patent in the United States may rely on a Formulation patent in Europe or a Method of Use patent in Japan. The expiry dates will not align globally. The SSOT must reflect this jurisdictional variance, mapping the “last man standing” for each major market.5
Mastering the Regulatory Books: Orange vs. Purple
A forecasting team must possess an encyclopedic understanding of the primary regulatory databases. The distinction between small molecules and biologics is fundamental, yet often conflated in general reporting.
The Orange Book: The Small Molecule Bible
For small-molecule drugs, the FDA’s Approved Drug Products with Therapeutic Equivalence Evaluations, known as the Orange Book, is the definitive source.6 Listing patents in the Orange Book is mandatory for New Drug Application (NDA) holders.
Mandatory Listings: Sponsors must list patents claiming the drug substance (active ingredient), the drug product (formulation), or a method of use.7
The omission Risk: Process patents (manufacturing methods) and patents claiming metabolites or intermediates are prohibited from being listed.7 This creates a blind spot; a strong manufacturing patent might block generics, but it will not appear in the Orange Book.
Strategic Utility: The Orange Book drives the automatic substitution mechanism at the pharmacy level. Forecasting the “cliff” requires analyzing the Therapeutic Equivalence (TE) codes. A code of “AB” signals that a generic is bioequivalent and will be automatically substituted, driving the rapid erosion curve.6
The Purple Book: The Biologics Frontier
For biological products, the reference is the Lists of Licensed Biological Products with Reference Product Exclusivity and Biosimilarity or Interchangeability Evaluations, or the Purple Book.8
Historical Opacity: Unlike the Orange Book, the Purple Book historically lacked comprehensive patent data. The Biologic Patent Transparency actions and the BPCIA have begun to change this, requiring the listing of patents identified during the “patent dance” litigation exchange.9
The Biosimilar Distinction: Biologics do not have automatic substitution unless they are designated “Interchangeable.” Most biosimilars are approved as “biosimilar” but not “interchangeable,” meaning a pharmacist cannot substitute them without a physician’s order. This slows the erosion curve, converting the “cliff” into a “slope”.10
Strategic Utility: The Purple Book is essential for tracking the status of 351(k) applications (biosimilars) and determining if a competitor has achieved the coveted Interchangeable status, which would accelerate market share loss.
The Calculus of Exclusivity: The Billion-Dollar Math
The nominal term of a U.S. patent is 20 years from the filing date. However, the effective patent life—the period of actual market monopoly—is determined by a complex algebraic formula involving three statutory mechanisms. A forecasting error here is not a rounding error; it is a strategic failure.
1. Patent Term Adjustment (PTA)
This mechanism compensates the patent holder for administrative delays at the United States Patent and Trademark Office (USPTO). If the USPTO takes more than three years to issue a patent, or fails to meet specific response deadlines, days are added to the patent term.11
Calculation: Day-for-day addition.
Applicability: Applies to any patent in the portfolio.
Forecasting Insight: A patent filed later in the development cycle might accrue significant PTA, extending protection beyond the core composition patent.
2. Patent Term Extension (PTE)
Enacted under the Hatch-Waxman Act, PTE compensates for the regulatory review period at the FDA, during which the patented invention cannot be commercialized.12
Calculation: The formula is: (1/2 of the Clinical Testing Phase) + (100% of the FDA Review Phase).11
Constraints:
One Patent Rule: PTE can only be applied to one patent per approved product.11
Five-Year Cap: The extension cannot exceed five years.
Fourteen-Year Cap: The total remaining patent life from the date of approval cannot exceed 14 years.11
Strategic Choice: Selecting which patent to extend is a critical strategic decision. Usually, the Composition of Matter patent is chosen, but if that patent is near expiry, a Method of Use patent might be selected to maximize the 14-year tail.
3. Pediatric Exclusivity (PED)
This is the “turbocharger” of the patent system. The Best Pharmaceuticals for Children Act (BPCA) grants an additional six months of market exclusivity if the sponsor conducts FDA-requested pediatric studies.13
The “Magic Wand” Effect: Unlike PTE, which extends one patent, Pediatric Exclusivity attaches to the end of every single patent and regulatory exclusivity listed for the drug.11
Financial Impact: For a drug selling $5 billion annually, this six-month extension generates $2.5 billion in revenue. The cost of the trials may be only $20 million. It is arguably the highest ROI activity in the pharmaceutical industry.11
Forecasting Rule: Always verify if a Written Request for pediatric studies has been issued. If so, add six months to every calculated expiry date in the model.
Phase II (Days 31–60): Constructing the Intelligence Infrastructure
With the internal data audited and the regulatory baselines established, the second phase focuses on external threat detection. The goal is to transition from reactive monitoring to predictive intelligence. Reliance on public, free data sources is insufficient for this task. Public databases like Google Patents lack the curated linkage between legal documents, regulatory status, and litigation dockets required for commercial decision-making.14
Integrating External Intelligence: The Role of DrugPatentWatch
To achieve the necessary granularity, the forecasting program must integrate a specialized intelligence platform. DrugPatentWatch serves as a critical infrastructure component, aggregating disparate datasets into actionable intelligence.15
The platform provides deep business intelligence on small-molecule drugs and over 1.3 million global patents.15 Its primary value lies in its ability to bridge the gap between “legal data” (patents) and “commercial data” (drug names and sales).
API Integration for Real-Time Forecasting
Manual data entry is the enemy of accuracy. The optimal setup involves integrating the DrugPatentWatch API directly into the organization’s Enterprise Resource Planning (ERP) or Customer Relationship Management (CRM) systems, such as SAP S/4HANA or Salesforce Health Cloud.15
The Salesforce Use Case: By feeding patent expiry data into Salesforce, sales teams can see the “runway” for each product in their territory. Commercial leadership can automate alerts when a competitor files a generic application or when a patent term is adjusted.17
The SAP Use Case: Integrating expiry dates into SAP allows supply chain managers to adjust inventory production schedules automatically. As the LOE date approaches, production volumes for the branded product can be ramped down to prevent “write-offs” of unsellable stock post-cliff.18
Table 2: Comparison of Data Sources for Forecasting
Feature
Public Sources (e.g., Google Patents)
Specialized Platform (DrugPatentWatch)
Data Latency
Weeks to Months 14
Daily Updates 15
Litigation Linkage
Disconnected
Integrated (Dockets linked to Patents)
Regulatory Linkage
None
Orange/Purple Book Integration
Exclusivity Tracking
Patent Term only
Tracks PED, Orphan, NCE, PTE
Supply Chain Data
None
API Vendor/DMF Tracking
Decoding Litigation: The Paragraph IV Signal
The filing of an Abbreviated New Drug Application (ANDA) with a Paragraph IV (PIV) certification is the definitive signal of generic intent. It is a declaration that the generic company believes the brand’s patents are invalid, unenforceable, or will not be infringed by their product.19
The 30-Month Stay
Under the Hatch-Waxman Act, if the brand sponsor sues the generic applicant within 45 days of receiving the PIV notice, the FDA is automatically barred from approving the generic for 30 months.20
Forecasting Implication: This creates a “minimum runway.” Even if the patent case is weak, the brand is guaranteed a 30-month delay from the date of the PIV notice (unless the court rules sooner). This 30-month period is a critical window for lifecycle management strategies, such as launching line extensions or authorized generics.
The 180-Day Exclusivity Prize
The first generic company to file a substantially complete ANDA with a PIV certification is granted 180 days of market exclusivity.21 During this period, no other generic can enter.
Duopoly Economics: During these six months, the market operates as a duopoly (Brand vs. First Generic). Price erosion is moderate (typically 20-30%).
The Cliff Event: Once the 180 days expire, the “floodgates” open. Multiple generics enter, and the price collapses to 5-10% of the brand price.22
Forecasting Rule: Your revenue model must have two phases of erosion: Phase 1 (The Step) for the first six months, and Phase 2 (The Cliff) thereafter.
Monitoring the Supply Chain: API Sourcing as a Leading Indicator
Legal filings are statements of intent; manufacturing activity is a statement of capability. A generic company cannot launch without a reliable source of Active Pharmaceutical Ingredient (API).
DrugPatentWatch enables the tracking of Drug Master Files (DMFs) filed with the FDA.23 A DMF is a submission to the FDA that may be used to provide confidential detailed information about facilities, processes, or articles used in the manufacturing, processing, packaging, and storing of one or more human drugs.
The Signal: A sudden spike in DMF filings for a specific molecule indicates that multiple generic manufacturers are preparing their supply chains. This correlates strongly with a “hard cliff”—rapid price erosion due to high competition intensity.24
Sourcing Intelligence: Identifying who is supplying the API (often manufacturers in India or China) can provide intelligence on the cost basis of the competitors, allowing for better pricing strategy for the brand’s own authorized generic.
The Biologic Difference: The “Patent Dance”
For biologics, the intelligence gathering process is different. The Biologics Price Competition and Innovation Act (BPCIA) creates a structured information exchange known as the “patent dance”.25
Phase 1: The biosimilar applicant provides their application (aBLA) and manufacturing information to the brand sponsor.
Phase 2: The brand sponsor lists patents they believe are infringed.
Phase 3: The parties negotiate which patents to litigate immediately (“first wave”) and which to leave for later (“second wave”).
Forecasting Challenge: This process is private until a lawsuit is filed. However, the settlements that result from this litigation often establish a fixed entry date years in the future.
Case Study: AbbVie’s settlement with Amgen over Humira allowed Amgen to enter the European market in 2018 but delayed U.S. entry until 2023.27 This created a definitive “cliff date” that was contractually fixed, removing the uncertainty of trial outcomes.
Action: Monitor court dockets and press releases for settlement announcements. These dates supersede all patent expiry calculations.
Phase III (Days 61–90): Advanced Modeling and Scenario Planning
With the data audited and intelligence systems active, the final phase involves stress-testing the forecast. Linear extrapolation of historical trends is a liability. The market disruption caused by generic entry is non-linear and subject to “black swan” events.
Forecasting Erosion Curves: Cliff vs. Slope
The single most common modeling error is applying a small-molecule erosion curve to a biologic asset.
Small Molecule Dynamics (The Cliff)
Mechanism: Automatic substitution at the pharmacy. The patient often does not know a switch has occurred.
Competitors: Usually 10+ generic entrants.
Erosion Profile: 80-90% revenue loss in Year 1.1
Price Floor: Approaches marginal cost of goods sold.
Biologic Dynamics (The Slope)
Mechanism: No automatic substitution (unless “Interchangeable”). Requires physician or payer intervention.
Competitors: Fewer entrants (2-5) due to high development costs ($100M+).
Erosion Profile: Slower uptake. Price discounts are often 15-35% initially, deepening over time.10
Retention: “Sticky” patients who are stable on the therapy may not be switched.
Forecasting Action: Use a “step-down” model for biologics based on payer contract cycles. A biosimilar might launch in January, but if the brand has a locked formulary contract until December, market share will not move until the next contracting cycle.
Modeling “At-Risk” Launches
An “at-risk” launch occurs when a generic company launches its product while patent litigation is still active, betting that the court will eventually rule the brand’s patents invalid or not infringed.28
The Calculus of Damages:
If the generic launches at risk and subsequently loses the patent case, they are liable for damages.
Lost Profits: The brand can claim the profits they would have made without the generic presence.
Price Erosion: The brand can claim damages for the “price crush” caused by the generic.
Treble Damages: In cases of “willful infringement,” courts can triple the damages.
Case Study: Protonix (Pfizer v. Teva)
Teva launched a generic version of Pfizer’s Protonix at risk. The litigation continued. Ultimately, the court found Pfizer’s patent valid. Teva and Sun Pharma agreed to pay $2.15 billion in damages.28 This massive penalty serves as a deterrent, but large generics (Teva, Sandoz) still take calculated risks on weak patents.
Scenario Planning:
The forecasting model must include a probabilistic “At-Risk” scenario.
Input: Legal team’s confidence score in the patent (e.g., 60%).
Input: Generic’s potential profit vs. potential damages liability.
Output: A risk-weighted LOE date that may be earlier than the final court verdict.
The Authorized Generic (AG) Defense
A critical strategic decision is whether to launch an Authorized Generic. An AG is the brand company’s own drug, manufactured on the same line, but packaged and sold as a generic (often through a subsidiary or partner).29
Strategic Rationale:
Revenue Retention: It allows the brand to capture a portion of the generic market revenue.
Price Disruption: Launching an AG during the first-filer’s 180-day exclusivity period destroys the generic’s “duopoly” profits. It forces price competition immediately, reducing the incentive for the generic challenger.30
Data Insight: The presence of an AG reduces the first-filer’s revenue by 40-50%.31
Forecasting Adjustment: If the Commercial team plans an AG launch, the “erosion” forecast should be adjusted to reflect the captured generic revenue stream, which can soften the cliff significantly.
The Regulatory Disruption: Inflation Reduction Act and Skinny Labels
Two recent developments have fundamentally altered the forecasting landscape: the Inflation Reduction Act (IRA) and the judicial evolution of “skinny labels.”
The IRA Effect: Decoupling Patents from Price
The Inflation Reduction Act introduces Medicare price negotiation for high-spend drugs. This effectively creates a new type of “cliff” that is statutory rather than patent-based.
The Small Molecule Penalty:
Small Molecules: Eligible for negotiation 9 years after FDA approval.32
Biologics: Eligible for negotiation 13 years after FDA approval.
This 9-year timeline for small molecules is drastically shorter than the typical 14-year effective patent life.
Strategic Impact: It disincentivizes post-approval R&D (e.g., new indications) for small molecules, as the commercial window is capped.
Forecasting Rule: For any high-spend Medicare drug, the LOE date is the earlier of: (a) Patent Expiry, or (b) The IRA Negotiation Date. Failure to apply this cap will result in massive overvaluation of the asset’s tail revenue.33
Skinny Labeling and Induced Infringement
Generics often attempt to bypass Method of Use patents by using a “skinny label” (Section viii carve-out)—seeking approval only for unpatented indications.34
The GlaxoSmithKline v. Teva Precedent:
Historically, skinny labels were a safe harbor. However, in GSK v. Teva, the courts ruled that even with a skinny label, a generic could be liable for “induced infringement” if their marketing materials, press releases, or even “implied” actions encouraged doctors to use the drug for the patented indication.34
Forecasting Implication: This ruling strengthens the brand’s hand. It makes it riskier for generics to rely on carve-outs. Consequently, forecasters might extend the expected exclusivity period for assets protected by strong Method of Use patents, assuming generics will be deterred by the liability risk.
Operationalizing the Function: Governance and M&A
A forecasting program is only as valuable as the decisions it informs. Intelligence must flow out of the IP department and into the boardroom to drive capital allocation and strategy.
The Cross-Functional Steering Committee
The forecasting function cannot live in a silo. A best-practice “LOE Steering Committee” should meet monthly, comprising:
Legal/IP Chair: Owns the patent data, litigation status, and settlement negotiations.
Regulatory Lead: Updates on exclusivity periods (Orphan, Pediatric) and interchangeability status.
Commercial Lead: Provides input on “stickiness,” payer contracting cycles, and Authorized Generic readiness.
Finance Lead: Integrates the risk-adjusted LOE dates into the Net Present Value (NPV) models and cash flow projections.
KPIs for the Steering Committee:
Forecast Accuracy: Variance between predicted and actual LOE date (target < 30 days).
Litigation Success: Percentage of PIV challenges defeated or settled favorably.
Pediatric ROI: Revenue gained from 6-month extensions versus the cost of trials.
M&A Due Diligence: Valuing Target Portfolios
The same rigorous forecasting engine used for internal defense must be weaponized for external acquisition. When evaluating a target company, the “patent cliff” is the primary driver of valuation.
The “Freedom to Operate” Haircut:
Acquirers often overpay because they look at the nominal patent life of a target’s portfolio. A target might claim protection until 2035 based on a formulation patent. However, a deep forecast might reveal that the Composition of Matter expires in 2028, and the formulation patent is weak and vulnerable to a PIV challenge.35
Action: The due diligence team must run the target’s portfolio through the forecasting model. If the “effective” life is shorter than the “nominal” life, the valuation model must be adjusted downward, potentially saving billions in bad capital allocation.
Key Takeaways
Exclusivity is Composite: There is no single “expiry date.” Effective market life is the aggregate of the 20-year patent term, Patent Term Adjustment (PTA), Patent Term Extension (PTE), and Pediatric Exclusivity. Omitting one variable creates multi-million dollar variances.
Data Hygiene is Foundational: Eliminate static spreadsheets. Audit all internal data against the FDA Orange Book (for small molecules) and Purple Book (for biologics) to establish a Single Source of Truth.
Intelligence must be Kinetic: Use specialized platforms like DrugPatentWatch to integrate real-time API feeds into ERP/CRM systems. Litigation filings and manufacturing signals (DMFs) are leading indicators that move faster than manual updates.
Differentiate Erosion Models: Small molecules face a “Cliff” (automatic substitution, 90% loss). Biologics face a “Slope” (payer-driven, gradual loss). Apply the correct erosion curve to the asset class.
The IRA is a Valuation Cap: For high-spend drugs, the Inflation Reduction Act creates a statutory revenue cap at Year 9 (small molecules) or Year 13 (biologics) that often supersedes patent life.
Supply Chain Signals: Monitoring API sourcing via Drug Master Files provides physical confirmation of generic intent, validating legal signals.
Defend with Authorized Generics: Launching an Authorized Generic is a proven mechanism to disrupt the first-filer’s 180-day exclusivity profits and retain residual value.
Frequently Asked Questions
Q1: How does the “Patent Dance” under the BPCIA impact the predictability of biosimilar entry compared to generic entry?
A: The BPCIA “patent dance” is a private, structured exchange of information that often results in settlements with fixed entry dates, rather than the “all-or-nothing” court verdicts common in generic litigation. While the process is opaque initially, the resulting settlements (like the Humira case) often provide a definitive “cliff date” years in advance, offering higher predictability for forecasting once the settlement is public, compared to the volatility of an “at-risk” generic launch.25
Q2: Why is Pediatric Exclusivity considered the highest ROI activity in patent lifecycle management?
A: Pediatric Exclusivity provides an additional six months of market protection that attaches to every valid patent and exclusivity for the drug. For a blockbuster generating $5 billion annually, this six-month extension is worth $2.5 billion. The cost to conduct the required pediatric trials is typically a fraction of this (e.g., $20-$50 million), yielding an ROI that can exceed 50x. It is a strategic imperative for any high-value asset.11
Q3: Can we rely on free public databases like Google Patents for commercial forecasting?
A: No. Public databases generally lack the critical “linkage” between patent data, regulatory status (Orange Book/Purple Book), and litigation dockets. They do not track 30-month stays, Pediatric Exclusivity attachments, or settlement agreements. Relying on them leads to data latency and a lack of commercial context, which can result in catastrophic forecasting errors.14
Q4: How does the Inflation Reduction Act (IRA) create a bias against small-molecule R&D?
A: The IRA subjects small-molecule drugs to price negotiation 9 years after approval, while biologics get 13 years. This four-year gap significantly reduces the “revenue tail” for small molecules. It disincentivizes investment in post-approval research (e.g., new indications) for small molecules because the time to recoup that investment is artificially capped by the negotiation timeline, regardless of the patent life.32
Q5: What is the strategic significance of an “Authorized Generic” (AG) during the 180-day exclusivity period?
A: The 180-day exclusivity period is designed to give the first generic filer a duopoly with the brand, allowing them to price high and recoup litigation costs. By launching an Authorized Generic during this window, the brand breaks the duopoly, forcing price competition immediately. This reduces the generic’s revenues by 40-50%, disincentivizing future challenges and allowing the brand to capture a significant portion of the “generic” revenue stream.30
Paucity of intellectual property rights information in the US biologics system a decade after passage of the Biosimilars Act – NIH, accessed December 27, 2025, https://pmc.ncbi.nlm.nih.gov/articles/PMC11081489/
Strategic behavior and entry deterrence by branded drug firms: the case of authorized generic drugs – PubMed, accessed December 27, 2025, https://pubmed.ncbi.nlm.nih.gov/39316276/
The Expiry of Humira® Market Exclusivity and the Entry of Adalimumab Biosimilars in Europe: An Overview of Pricing and National Policy Measures – PubMed Central, accessed December 27, 2025, https://pmc.ncbi.nlm.nih.gov/articles/PMC7839249/