More than $200 billion in pharmaceutical revenue faces patent expiry through 2030, with some analyst projections reaching $300 billion. For small molecules the loss arrives in weeks. For biologics like Humira it plays out over years as a rebate war. Neither is survivable without a forecast built for the actual dynamics at work.
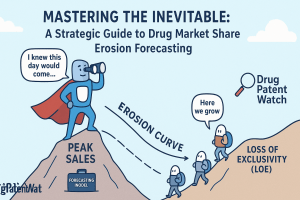
Why Patent Cliff 2.0 Is Not the Same Cliff Pfizer Fell Off in 2011
The pharmaceutical industry’s last major patent cliff, roughly 2010 to 2014, was dominated by oral small molecules. Atorvastatin, clopidogrel, escitalopram, montelukast. Their generics arrived, prices collapsed 80% to 95% within 12 months, and the brands effectively ceased commercial existence. Painful, but predictable. The current wave is a different animal.
The Cliff vs. the Slope: Why Molecule Type Changes Everything About Forecasting
For traditional small molecules, loss of exclusivity is a cliff. Automatic pharmacy substitution, Hatch-Waxman’s 180-day generic exclusivity structure, and multiple ANDA filers combine to crater the brand price within 30 to 90 days of first generic entry. A brand doing $2 billion annually can be at $200 million in net sales within 18 months. That is the definition of a cliff.
Biosimilars produce a slope. Physician reluctance to switch a stable rheumatoid arthritis patient from a reference biologic they have prescribed for four years. A biologics license application process under the 351(k) pathway that is materially more demanding than an ANDA. Biosimilar interchangeability designation, which allows automatic pharmacy-level substitution, carrying its own regulatory evidentiary requirements that most biosimilars have not cleared on launch day. And payer formulary structures built around multi-year rebate contracts with the reference product manufacturer.
“Do not mistake a gradual slope for a gentle ride. The price pressure is just as real. AbbVie lost an estimated 60% of Humira’s net sales not to losing patients, but to the rebates required to keep them.” — IQVIA LOE Rules Analysis, 2025
The strategic reframe matters enormously for anyone building a forecast. The old mental model, “when does the patent expire and how fast does share drop,” misses the dominant variable in a contested biologic LOE: net price per unit. AbbVie’s Humira U.S. volume held through 2023 and 2024. Its revenues did not. The company’s own disclosures showed Humira net revenues declining sharply while prescription volumes remained largely intact, the difference absorbed by rebates paid to pharmacy benefit managers to hold formulary position against nine biosimilar entrants. Forecasting models that only model volume share and not net price trajectory will produce numbers that are arithmetically precise and commercially useless.
Understanding the Regulatory Distinction Between Patent Expiry and Loss of Exclusivity
A drug’s commercial monopoly has two components that expire independently: patents and regulatory exclusivities. Patents are 20-year property rights from the USPTO filing date, covering the composition of matter, formulation, method of use, or manufacturing process. Regulatory exclusivities come from the FDA upon approval and are independent of the patent estate. A New Chemical Entity receives five years of NCE exclusivity. An orphan drug indication receives seven years. Pediatric studies can add six months.
The effective date of exclusivity loss is whichever protection, the last-to-expire relevant patent or the last-to-expire applicable exclusivity, falls last. A forecast built on the primary composition-of-matter patent’s expiry date, without accounting for secondary patents covering formulations or delivery systems, or without fully mapping FDA exclusivity periods, is structurally incomplete. This distinction has cost generic filers tens of millions of dollars in at-risk launch losses and has cost brand teams equivalent sums in over-investment in defensive strategies timed to the wrong date.
Key Term: Patent Thicket
A patent thicket is a cluster of overlapping, interrelated patents protecting a single drug product. AbbVie accumulated more than 250 patents on Humira covering the molecule, formulations, dosing regimens, and manufacturing processes. The thicket does not create an impenetrable wall, but it creates litigation risk for any biosimilar entrant and enables settlement negotiations that delay commercial entry for years beyond the primary patent’s expiry. Tracking a drug’s full thicket, not just its lead patent, is mandatory for accurate LOE timing. Section 02 — The Variables That Drive Erosion
What Actually Determines How Fast a Drug’s Market Share Dies
The number of generic or biosimilar competitors is the dominant variable in any erosion model. The relationship is so consistent across therapeutic classes and geographies that it functions less like a predictive variable and more like a physical law. Get this number wrong and every other refinement in your model is irrelevant.
The Number-of-Competitors Rule and Why Forecasting N Is the Whole Game
HHS ASPE analysis and multiple academic studies consistently show that price erosion post-LOE tracks directly with competitor count. One generic competitor produces a 30% to 39% price reduction from brand price. Two competitors produce 50% to 54% erosion. Six or more competitors drive 80% to 95% erosion. The trajectory is non-linear; each incremental entrant in the range of one to five has a larger per-unit impact than entrants arriving in a market already crowded with eight or ten players.
Generic Competitors
Price Erosion vs. Brand
Typical Timeframe
Strategic Implication
1 (first-filer)
30%–39%
Day 1–180 (exclusivity period)
Authorized generic decision point for brand
2
50%–54%
Month 6–12
Brand rebating begins in earnest
3–5
60%–79%
Year 1–2
Brand formulary position under pressure
6–10+
80%–95%
Year 2–4
Brand exits most payer formularies
10+ (commodity)
90%–97%
Year 3–5
“Scalloped” recovery possible if entrants exit
Source: Synthesized from HHS ASPE generic competition analysis, FDA reports, and DrugPatentWatch data.
The consequence for forecasting methodology is direct: the most valuable analytical activity is not refining the shape of the erosion curve algorithm. It is building a rigorous, evidence-based model for how many competitors will enter, and when. That requires tracking ANDA and BLA 351(k) filings, monitoring Paragraph IV certification activity in the Orange Book, understanding which manufacturers have the requisite chemistry, manufacturing, and controls capabilities, and mapping litigation settlement terms that embed market entry dates.
The Scalloped Price Decay Curve and What Drives Temporary Rebounds
Price decay after LOE is not a clean monotonic decline. In roughly 20% of cases, the average selling price of a generic product temporarily increases after an initial drop. The mechanism is straightforward: intense competition drives prices below individual manufacturers’ cost of production. Some license holders exit. Reduced competition allows prices to recover modestly. New entrants return if prices normalize, and the cycle repeats, each iteration typically bottoming at a lower level than the prior trough.
For commercial forecasting teams, this scalloped pattern creates a specific trap: a price rebound in the 18- to 24-month window post-LOE can be misread as evidence that the brand’s value-added marketing is working. It usually isn’t. It reflects generic market rationalization, and it is temporary. Models calibrated on that window will overestimate long-run net price.
Small Molecule vs. Biosimilar Erosion: The Two Regimes That Require Different Models
Dimension
Small Molecule / Generic
Biologic / Biosimilar
Speed of erosion onset
Days to weeks
Months to years
Primary substitution mechanism
Automatic pharmacy substitution
Payer formulary management, physician choice
Price floor
5%–10% of brand WAC
50%–70% of brand WAC (reference biologic)
Typical entrant count
Often 10+ within 3 years
2–5 within 3 years, manufacture-limited
Regulatory pathway
ANDA (Hatch-Waxman)
BLA 351(k) (BPCIA)
Interchangeability designation
Automatic (AB-rated equivalents)
Requires additional FDA designation; most lack it at launch
Manufacturing barrier
Low to moderate
High; cell-based manufacturing, CQA complexity
Primary brand defense
Authorized generic, litigation delay, coupons
Rebate-for-formulary exclusivity, patent thicket
Lead forecasting variable
Number of ANDA filers
Net price offered to major PBMs
Source: DrugPatentWatch analysis; IQVIA Institute data.
How Route of Administration and Formulation Complexity Create Manufacturing Moats
A film-coated oral tablet with a well-characterized active pharmaceutical ingredient has a manufacturing moat of approximately zero. The API is commercially available from multiple Indian and Chinese suppliers. The formulation technology is unrestricted. An ANDA filer needs chemistry, manufacturing, and controls documentation and a bioequivalence study. Dozens of companies can do this simultaneously.
A prefilled auto-injector biologic is different in every dimension. The biological starting material requires a cell bank, validated fermentation processes, and downstream purification validated to critical quality attributes. The drug-device combination adds a prefilled syringe or auto-injector that is itself a regulated combination product with device design history requirements. A company producing the small molecule is not, by default, capable of producing the biologic. This manufacturing complexity directly limits the number of likely entrants, which, as the data above shows, directly moderates the rate of price erosion. A manufacturing moat analysis is therefore not secondary detail in an LOE forecast. It is a primary input.
How the Inflation Reduction Act Breaks Historical Erosion Models
The IRA’s Medicare Drug Price Negotiation Program, which allows CMS to negotiate a Maximum Fair Price for certain high-expenditure drugs, introduces a two-stage LOE structure that historical erosion models do not accommodate. Under the IRA, a drug selected for negotiation can face a mandated price reduction years before its patent expires. When the patent does expire and generics or biosimilars enter, they are benchmarking their price against an already-reduced reference price, compressing the revenue opportunity that would otherwise attract market entrants.
The downstream effect on generic market economics could be significant. If Medicare-negotiated prices reduce a biologic’s launch-year net price by 30% to 40%, a biosimilar manufacturer targeting 20% below that negotiated price is entering a market where the financial return may not justify the regulatory and manufacturing investment. This could produce a counterintuitive outcome: drugs selected for IRA negotiation may face fewer biosimilar or generic entrants than their revenue history would historically attract, potentially moderating post-patent erosion in ways that have no analog in the prior decade’s data. Section 03 — Strategic Classification
The LOE Archetype Framework: How to Classify a Drug Before You Model It
Every drug approaching patent expiry has a unique combination of molecular type, commercial channel, clinical profile, competitive landscape, and payer dynamics. The single most common forecasting error is applying a generalized erosion model to a drug without first characterizing which type of LOE event it is actually facing. The archetype framework forces that characterization before any number is generated.
What a Well-Constructed LOE Archetype Contains
An LOE archetype classifies a drug across five dimensions: molecule and formulation complexity (oral solid vs. injectable biologic vs. inhalation product vs. device combination); commercial channel (retail pharmacy vs. specialty pharmacy vs. provider-administered buy-and-bill); clinical stakes (stable maintenance therapy vs. high-stakes oncology or CNS drug with narrow therapeutic window); competitive exposure (number and timing of expected entrants); and payer and market access structure (rebate intensity, 340B exposure, formulary tier positioning).
Each dimension maps to a distinct erosion dynamic. Buy-and-bill oncology drugs administered in infusion centers retain share longer because the healthcare provider bears both the clinical and financial responsibility for the infusion. Switching a stable patient from an infused biologic to a biosimilar requires a provider decision that involves their own practice economics, clinical risk tolerance, and patient consent. That friction slows the substitution rate materially. A retail pharmacy statin with 12 generic entrants faces no such friction; the pharmacist substitutes at the point of dispensing.
Archetype 1: The Commodity Oral
High-volume oral solid dosage for a primary-care indication. Simple API with established manufacturing, broad ANDA filer pool, automatic pharmacy substitution upon first generic approval. Examples: statins post-Lipitor, ACE inhibitors, proton pump inhibitors after omeprazole’s LOE. Expected erosion is 80%+ of brand volume within 12 to 18 months, price collapsing to single-digit percentages of brand WAC within three years. The authorized generic decision is the primary strategic lever.
Archetype 2: The Contested Biologic
High-volume self-administered or provider-administered biologic for a major chronic condition with a large patient population. Humira (adalimumab) for rheumatoid arthritis and psoriasis is the defining example. The Keytruda (pembrolizumab) and Opdivo (nivolumab) LOE events, expected in the late 2020s and early 2030s respectively, will be the next high-stakes tests of this archetype. Expected erosion: volume retention significantly better than small molecule analogues, but net price erosion severe due to rebate competition with biosimilar entrants. The forecast must model payer behavior, not just patient switching.
Archetype 3: The Niche Specialty Biologic
Provider-administered biologic for a rare or ultrarare disease. Small patient population, specialized prescriber base, high per-patient cost. Biosimilar economics are marginal: a $500,000-per-year drug with 2,000 patients nationally may not justify the investment in a 351(k) application, clinical safety data package, and manufacturing scale-up. Brand may retain significant share for years post-patent expiry simply due to lack of competition, particularly if the molecule involves complex protein engineering or a novel expression system.
Archetype 4: The Complex Formulation Specialty
Drug with a complex formulation or delivery device, such as extended-release oral products with abuse-deterrent formulation, inhalation products with complex device-drug interactions, or transdermal systems. Generic versions require demonstration of bioequivalence under product-specific FDA guidance that may not exist or may be demanding to execute. Fewer ANDA filers with demonstrated capability, slower approval timelines, and moderately slower market share erosion than simple oral solids.
Archetype
Classification
Speed of Volume Erosion
Timeline
Price Floor
vs. Brand WAC
Primary Risk Variable
Forecast Driver
Commodity Oral
Rapid — months
<10%
ANDA filer count
Contested Biologic
Slow — 2–5 years
50%–70%
Payer rebate dynamics
Niche Specialty
Very slow to minimal
70%–90%
Market size / entrant economics
Complex Formulation
Moderate — 1–3 years
20%–50%
FDA guidance timing; device IP
Why Archetypes Are a Planning Tool, Not Just a Forecasting Tool
The LOE archetype is not a passive descriptor. It is actionable. A drug classified as a Commodity Oral at year minus five has a four-to-five-year window to shift archetype through lifecycle management investment. An extended-release formulation adds manufacturing complexity and a bioequivalence challenge that reduces the ANDA filer pool. A new indication in an orphan disease adds seven years of FDA orphan exclusivity for that indication. A fixed-dose combination with a second molecule in the class creates a separate patent estate and a different competitive analysis.
The forecast at year minus five should not be a single erosion curve but a set of scenario curves: baseline (current archetype), scenario A (successful ER formulation approved and commercially adopted), scenario B (new orphan indication secured), scenario C (combination product launched). The difference in NPV between scenarios defines the maximum rational investment in each lifecycle management program. Forecasting and strategy are the same exercise when structured this way. Section 04 — Landmark Case Studies
Four LOE Events That Define the Playbook
The abstractions of archetype theory resolve into specificity quickly when applied to actual LOE events. Lipitor, Plavix, Humira, and Gleevec are not just pharma history. They are the calibration set for every forecast model currently in use.
The world’s best-selling drug through most of the 2000s, Lipitor generated over $125 billion for Pfizer during its patent life. As the highest-volume oral statin for primary-care hypercholesterolemia, its Hatch-Waxman patent expiry in November 2011 was the most anticipated LOE in history. What followed was textbook.
Sales dropped 71% in a single quarter after generic entry. Within 18 months, the brand had lost the overwhelming majority of its prescription volume to multiple generic filers. Pfizer’s defensive strategy included heavy direct-to-consumer marketing pre-LOE, aggressive litigation to delay first generic entry as long as possible, and the deployment of an authorized generic through Watson to capture a portion of the generic revenue stream. None of this materially changed the shape of the erosion curve. The archetype’s physics were too strong.
The lesson for portfolio managers is not that Pfizer’s strategy failed. It didn’t, by the available alternatives. The lesson is that a Commodity Oral archetype facing multiple ANDA filers has a ceiling on how much defensive investment can modify the erosion trajectory. Capital deployed in Lipitor’s defense in 2011 generated marginal returns. Capital deployed four years earlier in lifecycle management or pipeline replacement would have generated substantially more.
Plavix’s LOE is the case study for what happens when the legal forecast diverges from the commercial forecast. In August 2006, Apotex launched a clopidogrel generic at risk, before patent litigation was resolved, flooding the market for 23 days before a court injunction halted sales. That 23-day window caused enormous market disruption: pharmacies stocked up, patients were switched, and downstream demand for the generic was pulled forward in a way that created chaos in the brand’s sales data for months.
The Plavix saga demonstrates that for drugs with active Paragraph IV litigation, the single most important variable in the erosion forecast is not the number of ANDA filers or the formulation complexity. It is the probability distribution of legal outcomes. What is the probability the core composition-of-matter patent is upheld on appeal? What are the likely settlement terms, and which entrants are likely to settle first versus litigate to judgment? A commercial forecast that doesn’t model legal scenarios with explicit probabilities is blind to the primary risk driver.
23 days
Duration of Apotex at-risk launch
Aug 2006
Apotex at-risk entry date
Paragraph IV litigation drove the primary commercial risk, not formulation or ANDA count.
AbbVie built the defining patent thicket in modern pharmaceutical history. Over 250 patents protecting Humira, filed over a 20-year period, covered the molecule, formulations (including the high-concentration citrate-free formulation used in the later years), dosing regimens, manufacturing processes, and methods of treatment across its many approved indications. Settlement agreements with every major biosimilar developer in the U.S. delayed all commercial entry until January 2023, roughly a decade after the original composition-of-matter patent would have expired. This is the most consequential patent thicket outcome in biologic drug history, worth an estimated $100 billion or more in protected revenues.
When biosimilars did arrive in January 2023, there were nine of them, across two pricing tiers: high-list/high-rebate products designed to compete on formulary the way Humira itself competed, and low-list/low-rebate products targeting a smaller segment of cash-pay or low-rebate payers. Biosimilar volume share in the first year was under 2%. AbbVie maintained formulary position by offering rebates that made Humira cost-equivalent or cheaper to payers on a net basis than the biosimilars.
The brand won the volume battle and lost the price war. Forecasters who modeled Humira post-LOE on the basis of biosimilar volume uptake curves were largely correct in their volume predictions and completely wrong in their revenue predictions. Analysts who modeled it as a net-price-erosion event, with volume holding but gross-to-net discount widening dramatically, were closer to the actual outcome. That distinction separates a Commodity Oral forecast methodology from a Contested Biologic forecast methodology.
Gleevec’s LOE in 2016 illustrates a third erosion mechanism: active payer-driven demand substitution. Generic imatinib entered the U.S. market in February 2016, and initially the price drop was slow, taking nearly two full years to compress substantially. Left to physician inertia and passive formulary dynamics, the erosion would have been gradual. But payers didn’t leave it to passive dynamics.
Step-edit protocols became the primary tool. Health plans established clinical policy requiring newly diagnosed CML patients to initiate therapy on generic imatinib. Only demonstrated intolerance or treatment failure allowed access to the branded second-generation TKIs, dasatinib (Sprycel, BMS) and nilotinib (Tasigna, Novartis), that competed in the same therapeutic space. This utilization management approach effectively created a mandatory generic substitution policy for new patients while allowing existing stable patients to remain on branded therapy.
The forecast implication: the Gleevec case requires modeling not just competitor entry but payer utilization management uptake. A drug facing LOE in a therapeutic class with branded successors will have payers actively managing the transition in ways that accelerate new-patient generic uptake. Any model that doesn’t account for step-edit probability and timing will underestimate new-patient erosion for specialty oral oncology products.
Feb 2016
First U.S. generic imatinib entry
2 years
Lag before major price compression
Step-edit protocols drove new-patient erosion faster than passive substitution would have produced. Section 05 — Drugs Facing LOE 2025–2030
Which Drugs Face the Largest Revenue Cliffs Through 2030
The current pipeline of LOE events is dominated by oncology and immunology biologics with revenues in the tens of billions. Each represents a distinct archetype test, and the forecasting challenges differ substantially across the group.
Keytruda (pembrolizumab, Merck) — Why Merck’s LOE Is a Category Problem
Keytruda was the top-selling drug globally in 2023 and 2024, with revenues exceeding $25 billion annually. Its core composition-of-matter patent protection in the U.S. extends to approximately 2028, with secondary patents potentially providing meaningful competitive insulation through the early 2030s. The biosimilar development landscape for pembrolizumab is active: Samsung Bioepis, Celltrion, and multiple other developers have biosimilar programs in clinical development.
The strategic complexity for Merck is that Keytruda is approved in more than 40 indications across 18 tumor types. A biosimilar approved for one indication is structurally positioned to compete across all. Merck’s LOE strategy almost certainly includes next-generation PD-1/PD-L1 combinations, subcutaneous formulations, and its own co-formulation development pipeline. The authorized biologic or portfolio evolution question is: can Merck migrate a sufficient portion of its Keytruda patient population to a successor product before biosimilar entry that would otherwise be Merck’s own revenue at risk?
~2028
Keytruda (pembrolizumab) core U.S. patent expiry. Multiple biosimilar developers in Phase I/II. Revenue at risk: $25B+ annual.
~2028–2029
Eliquis (apixaban, BMS/Pfizer) U.S. patent protection cliff. Oral Factor Xa inhibitor for AFib and VTE. Revenue at risk: $12B+. Multiple ANDA filers active.
Ozempic / Wegovy (semaglutide, Novo Nordisk) patent protection window. GLP-1 agonist LOE will be one of the highest-stakes events of the decade given the obesity indication volume.
Eliquis (apixaban) — How BMS and Pfizer Are Preparing for a Contested Small-Molecule LOE
Apixaban is an oral Factor Xa inhibitor co-marketed by BMS and Pfizer for atrial fibrillation and venous thromboembolism. Its U.S. revenue runs above $12 billion annually, making its LOE one of the most commercially significant events in the current patent cliff. As a small molecule, it falls in the Commodity Oral archetype, but with substantial complicating factors: patent litigation has been active, BMS and Pfizer have engaged in aggressive Paragraph IV defense, and the gross-to-net discount structure for Eliquis is already complex given its formulary positioning against rivaroxaban (Xarelto).
Multiple ANDA filers have cleared the litigation path through settlement agreements that include delayed entry dates. The erosion curve for apixaban generics, when they do arrive, will follow the classic Commodity Oral trajectory. The variable forecasting question is the precise timing of first generic entry, which remains a function of the settlement terms embedded in ongoing patent disputes.
Ozempic and Wegovy (semaglutide) — Why GLP-1 Biosimilar Entry Will Be Structurally Different
Semaglutide represents the highest-stakes future LOE event visible on the current patent horizon. Novo Nordisk’s revenues from Ozempic and Wegovy have reached and likely exceeded $20 billion annually across their type 2 diabetes and obesity indications. The drug is a GLP-1 receptor agonist peptide delivered via subcutaneous injection, placing it squarely in the biologic regulatory pathway for any follow-on product.
What makes semaglutide’s LOE analysis unusual is the manufacturing demand constraint already visible in the market. Novo Nordisk and Eli Lilly (with tirzepatide, Mounjaro/Zepbound) have both faced significant supply limitations for their GLP-1 products. The manufacturing complexity, particularly the peptide synthesis and formulation in delivery devices, is high. Biosimilar developers will need to demonstrate both the molecular equivalence of the GLP-1 peptide and the device comparability, a regulatory path that is demanding even by 351(k) standards. The forecast question for semaglutide LOE is not primarily how many biosimilars will enter, but how quickly they can manufacture at sufficient scale to take meaningful market share. Manufacturing-constrained biosimilar markets behave differently from manufacturing-abundant ones. Section 06 — Forecasting Methodology
How to Actually Build a Market Share Erosion Forecast
Three modeling approaches structure the analytical toolkit: statistical/econometric models that identify causal relationships; time-series models that extrapolate historical trends; and machine learning models that identify non-linear patterns invisible to classical methods. Each has a distinct role and a distinct failure mode.
Regression Analysis: Quantifying the Value of Each Strategic Lever
Regression models in pharmaceutical forecasting do two things: they identify which variables statistically explain past erosion outcomes, and they quantify the magnitude of each variable’s effect. The landmark Ridley and Régnier regression on pharmaceutical market share identified promotional share as a significant predictor, with each percentage point of promotional spending share associated with roughly 0.46 percentage points of additional peak market share. The same model quantified the penalty for later market entry, showing consistent stepdown in expected share from third-entrant to fourth-entrant position.
The strategic value of a well-specified regression is not the point prediction it generates. It is the coefficient on each variable, which functions as a quantified ROI multiplier for strategic investments. If the regression coefficient for DTC advertising spend is 0.46, and the marginal cost of additional promotional share is known, the model produces a direct ROI calculation for pre-LOE marketing investment. The same logic applies to the coefficient on authorized generic deployment, new formulation launch, or new indication approval. Regression makes the trade-offs between strategic options financially explicit.
Time-Series Methods and Where ARIMA Models Fail in LOE Contexts
ARIMA and its variants are appropriate for establishing a momentum-based baseline: what is the trajectory of brand sales or market size absent a structural break? They are useful for the two to three years before LOE when the primary uncertainty is in the current trend, not in post-LOE competitive dynamics. Their primary failure in LOE forecasting is the structural break problem. Patent expiry and first generic entry are regime-changing events. A model calibrated on pre-LOE time-series data will extrapolate the pre-LOE trend into the post-LOE period, which is exactly wrong. ARIMA models need to be complemented with scenario-based competitor entry models that are not time-series-derived.
Machine Learning in LOE Forecasting: XGBoost, LSTM Networks, and NLP Competitor Surveillance
Gradient-boosted tree models, particularly XGBoost, have emerged as top-performing methods in pharmaceutical sales forecasting competitions because they handle mixed data types, identify complex interaction effects between variables, and produce variable importance rankings that explain the model’s behavior. For LOE forecasting, XGBoost is most useful for the competitor prediction problem: given a drug’s characteristics, therapeutic area, revenue level, and patent profile, how many ANDA or 351(k) filers are likely to enter, and in what timeframe?
Long Short-Term Memory neural networks are architecturally suited to multi-year time-series with long-range dependencies, making them theoretically well-matched to the multi-year erosion curves of contested biologics. The practical challenge is training data: LSTM models need substantial volumes of biologic LOE event data to learn from, and the post-2023 Humira biosimilar launch is only one data point in a sparse biologic LOE history.
Natural language processing applied to patent filings, ANDA databases, regulatory correspondence, and financial press releases is arguably the highest-ROI ML application in the LOE forecasting context. An NLP system trained to identify mentions of specific molecules in patent challenge filings, clinical trial registries, and investor calls can provide early-warning competitor intelligence 18 to 36 months before an ANDA or 351(k) appears in the public record. The value of that lead time, in terms of earlier strategic response, is substantial.
Monte Carlo Simulation: Moving from Point Estimates to Decision-Relevant Probability Distributions
The most consequential methodological shift in LOE forecasting over the past decade is the move from deterministic single-point forecasts to probabilistic scenario distributions. A deterministic model says: in our base case, we project 45% brand market share retention in year three post-LOE. A Monte Carlo simulation says: we project a 40th-percentile outcome of 30% share retention, a median outcome of 45%, and a 90th-percentile outcome of 62%, with the full probability distribution shaped by our assumptions about competitor count, payer formulary decisions, and IRA negotiation outcomes.
This distributional output changes what leadership can do with the forecast. They can set inventory safety stock at the 75th-percentile scenario rather than the median. They can evaluate the NPV of lifecycle management investments against the downside scenario rather than the base case. They can construct payer contracts with volume-based price adjustments that hold economics across a range of share outcomes. The point estimate is inadequate for these decisions. The probability distribution is the minimum viable output.
What Investors Are Watching in the Patent Cliff Through 2030
For equity analysts and portfolio managers, the patent cliff is not abstract revenue risk. It is a set of specific, datable events that require explicit treatment in financial models. The questions investors are asking have become more precise as the biologic LOE literature has grown.
Key Investor Questions Across the Current Patent Cliff
How much of Merck’s current market cap reflects Keytruda revenues that will be at risk post-2028? How much of the pipeline offsets that LOE?
For Bristol Myers Squibb, what is the sum of Opdivo and Eliquis LOE revenue exposure, and how does the pipeline NPV compare?
In AbbVie’s case, Humira LOE is already in progress. How well are Skyrizi and Rinvoq absorbing the volume, and at what net price relative to Humira?
What is the realistic net price trajectory for Keytruda biosimilars given the IRA negotiation parallel track?
For Novo Nordisk and semaglutide, how does manufacturing capacity constrain the speed of biosimilar market entry and thus the rate of revenue erosion?
Which generic and biosimilar developers have the manufacturing capabilities and regulatory track records to be credible first-entrant threats for each major drug?
How Paragraph IV Litigation Outcomes Change Pharma Equity Valuation
Paragraph IV certifications, in which an ANDA filer certifies that a brand’s listed patent is invalid or will not be infringed, directly trigger litigation under Hatch-Waxman. A successful Paragraph IV invalidation of a composition-of-matter patent can accelerate generic entry by years. A failed challenge, upheld by the courts, confirms the brand’s exclusivity timeline and increases investor certainty about the revenue horizon.
Equity analysts who track Paragraph IV litigation trends can identify early inflection points in a drug’s competitive landscape before they appear in consensus estimates. A Paragraph IV filing against a drug with $10 billion in annual U.S. revenue, if validated by subsequent ANDA acceptance, is a material event for the brand manufacturer’s equity. Tracking these filings through the FDA’s Orange Book and paragraph IV litigation registers is standard practice for specialist healthcare investors and should be integrated into any institutional pharmaceutical analysis process.
Revenue at Risk: How to Calculate LOE Exposure in a Pharma Portfolio
The standard approach to LOE revenue-at-risk analysis models the probability-weighted present value of revenues under three scenarios: no generic/biosimilar entry (patent upheld or no entrant), entry at the expected date (base case), and accelerated entry (Paragraph IV success or settlement breach). For each scenario, the relevant erosion curve, calibrated to the drug’s archetype, is applied to current revenue to generate a post-LOE revenue trajectory. The probability-weighted average of these trajectories, discounted to present value, represents the drug’s IP-adjusted asset value.
A portfolio of drugs can be aggregated across this framework to produce a total LOE exposure figure: the difference between the un-adjusted portfolio NPV (assuming no LOE erosion) and the IP-adjusted NPV (applying expected erosion to each asset). For large-cap pharma companies with $20 billion to $50 billion in revenue concentrated in three to five blockbusters, this exposure frequently represents 20% to 35% of total market capitalization when estimated using historically calibrated erosion rates. Section 08 — How Biosimilar Launch Timing Works
How Biosimilar Launch Timing Actually Works and Why It Is Not Predictable from Patent Data Alone
The conventional assumption, that a biosimilar enters the market when the reference product’s patents expire, is wrong often enough to be commercially dangerous. Biosimilar entry timing is a function of at least six distinct factors, each of which can add or subtract 12 to 36 months from the expected date.
Settlement Terms Embedded in Patent Litigation as the Primary Timing Variable
Patent litigation between biologic manufacturers and biosimilar developers frequently resolves through settlement agreements that include explicit market entry dates, revenue-sharing arrangements, or milestone-based entry rights. AbbVie’s settlement agreements with biosimilar developers including Amgen, Samsung Bioepis, Sandoz, and others contained specific U.S. entry dates that were commercially negotiated, not dictated by patent expiry timelines. Understanding these settlement structures, where public information exists, is the primary input for forecasting biosimilar entry timing.
Biosimilar Interchangeability Designation and Its Effect on Market Penetration Rate
FDA biosimilar interchangeability designation, which allows pharmacists to substitute a biosimilar for a reference biologic without physician intervention, is an additional regulatory milestone beyond biosimilar approval itself. As of 2025, only a handful of biosimilars have achieved interchangeability designation in the U.S. Boehringer Ingelheim’s Cyltezo (adalimumab-adbm) and Coherus BioSciences’ Yusimry (adalimumab-aqvh) were among the early adalimumab biosimilars to obtain interchangeability designation.
Interchangeability matters for market penetration because it enables the same pharmacy-level automatic substitution that drives rapid small-molecule generic uptake. A biosimilar without interchangeability designation requires active physician endorsement for each patient switch, materially slowing penetration. Forecasters should model biosimilar uptake with and without interchangeability designation as separate scenarios, with meaningfully different penetration curves.
Manufacturing Scale-Up as a Launch Rate Constraint
Biologic manufacturing requires validated cell banks, bioreactor capacity, and downstream purification processes that must be scaled from clinical production volumes to commercial launch volumes. This scale-up is not instantaneous. Biosimilar developers that secure FDA approval may face a 12- to 24-month period of constrained supply before they can service a national commercial launch at full volume. Supply-constrained biosimilar launches have a specific market penetration signature: initial uptake is faster than physician switching behavior alone would predict because formulary switches by large payer systems create demand spikes that the biosimilar manufacturer cannot fully meet, leading to shortages that force prescribers back to the reference biologic temporarily. Section 09 — Building the Institutional Capability
What a World-Class LOE Forecasting Function Actually Looks Like
The data foundation for a robust LOE forecasting capability has five components that must be integrated rather than maintained as separate data silos. Missing any one component produces systematic blind spots in the forecast output.
The Five-Layer Data Architecture for LOE Intelligence
Patent and exclusivity data at the full portfolio level, not just the lead composition-of-matter patent. This requires tracking secondary formulation patents, method-of-use patents, device patents, and manufacturing process patents, as well as all applicable FDA regulatory exclusivities, in an integrated timeline that produces a single effective exclusivity date. Sales and prescription data from IQVIA or Symphony Health, spanning branded and generic/biosimilar segments, at both national and regional levels. Competitive intelligence data tracking ANDA and 351(k) filings, Paragraph IV certifications, litigation outcomes, and clinical trial registrations. Payer and formulary data covering formulary tier status across major commercial and Medicare Part D payers, rebate structure trends where estimable, and utilization management policy changes. Policy and regulatory monitoring covering FDA draft guidance updates, EMA decisions, and legislative changes such as IRA implementation guidance that affect the competitive dynamics of specific drug classes.
The LOE Situation Room: Why the Analytical Process Must Be Cross-Functional
The forecasting function has a structural problem: the inputs it requires are distributed across five or six organizational functions that do not share data by default. The patent team knows the litigation status. Market access knows the payer contracts. Supply chain knows the manufacturing constraints. Brand knows the DTC spend plan. None of these functions, in isolation, has the full picture required to produce an accurate LOE forecast.
Best-practice companies establish a cross-functional LOE command structure 24 to 36 months before the expected LOE date. This structure has a mandate that includes access to information from all five functions, quarterly forecast updates as new data arrives, scenario adjustment authority when litigation outcomes or payer contract negotiations change the competitive landscape materially, and a direct reporting line to C-suite leadership given the revenue magnitude of the decisions being made.
The Forecasting Flywheel: Making the Model a Learning System
A forecast updated once per year before the annual planning cycle is a static document. A forecast updated quarterly, with real-world outcomes from the prior quarter feeding back into model calibration, is a learning system. The distinction matters enormously in the post-LOE period, when competitive dynamics can change faster than annual planning cycles can accommodate. A biosimilar entrant that deploys an unexpectedly aggressive pricing strategy, a payer that implements a step-edit protocol six months earlier than expected, or a litigation settlement that accelerates generic entry by 18 months, each of these events should trigger a model update and a strategic response within weeks, not quarters.
The flywheel structure is: observed outcome data feeds into model recalibration, recalibration produces updated scenario probabilities, updated scenarios inform tactical decisions, tactical decisions produce new market outcomes, which become new observed outcome data. The speed at which this cycle operates is a direct determinant of competitive advantage in a post-LOE market. Companies that update quarterly outperform companies that update annually. Companies with real-time payer and prescription data monitoring outperform companies running on 90-day-lagged data. Section 10 — FAQ
Common Investor and Analyst Questions on Drug Patent Expiry and Market Erosion
What is the difference between a patent expiry date and a loss-of-exclusivity date?
A patent expiry is a property right event: a specific USPTO patent expires on a specific date. Loss of exclusivity is a commercial event: the date on which the first generic or biosimilar competitor can legally enter the market. These dates can differ substantially. A drug may have a composition-of-matter patent expiring in 2026, but an active Paragraph IV litigation that delays first ANDA approval until 2028, and an FDA pediatric exclusivity extension adding six months to 2028.5. The LOE date is 2028.5. Any forecast built on the composition-of-matter expiry date of 2026 will be wrong by nearly three years.
How long before patent expiry should an LOE forecast model be initiated?
Four to five years before the expected LOE date is the industry standard for best-practice organizations. The first two years of that window are used for archetype classification, scenario framing, and lifecycle management investment evaluation. The middle year is for developing the quantitative model architecture and competitor intelligence program. The final 18 months are for refining the model with arriving competitive intelligence data, payer contract negotiations, and litigation outcomes. Initiating the process at 12 months before LOE is too late to influence archetype-shifting strategies and leaves the brand team in a purely reactive posture.
Does biosimilar interchangeability designation significantly change the market penetration forecast?
Yes, materially. A biosimilar with interchangeability designation can be substituted at the pharmacy level without physician intervention, producing a penetration curve that more closely resembles a small-molecule generic substitution than a traditional biosimilar uptake curve. Modeling biosimilar market penetration with and without interchangeability should produce meaningfully different year-one and year-two penetration curves, with interchangeable biosimilars penetrating perhaps two to three times faster in formulary-managed settings than non-interchangeable biosimilars. For high-volume retail-dispensed biologics like adalimumab, interchangeability is the single most important post-approval regulatory variable for the penetration forecast.
How does the Inflation Reduction Act’s Medicare drug price negotiation affect LOE forecasting?
The IRA introduces a pre-LOE price reduction event that changes the economics for generic and biosimilar entrants. If a drug selected for IRA negotiation has its Medicare net price reduced by 30% to 50% before patent expiry, a biosimilar or generic entering at 20% below that negotiated price is in a smaller total market than historical analogues would suggest. This may reduce the financial incentive for market entry, potentially producing fewer entrants than the drug’s revenue history would predict. For forecasters, the IRA means that high-revenue drugs selected for negotiation need a separate forecasting track: one that accounts for the IRA-mandated price reduction timeline and models entrant economics against the post-negotiation price rather than the historical launch-year WAC.
What is the most common forecasting error companies make in LOE planning?
Modeling the erosion curve shape before accurately forecasting the number of competitors. Every major study on post-LOE price dynamics confirms that competitor count is the primary explanatory variable for the depth and speed of erosion. A team spending significant resources on refining the curve algorithm while using an unsupported assumption about the number of entrants (e.g., assuming five generics will enter without tracking actual ANDA filings) will produce numbers with false precision. The highest-ROI analytical investment in any LOE program is a rigorous competitor intelligence model: ANDA filing tracking, manufacturing capability assessment for potential entrants, Paragraph IV litigation monitoring, and settlement agreement analysis.
How do you forecast the LOE erosion curve for a drug with no historical biosimilar analogs?
Analog selection under manufacturing and clinical constraint matching. Select historical biosimilar LOE events that most closely match the target drug on: biologic class (monoclonal antibody vs. peptide vs. fusion protein), route of administration, commercial channel (retail vs. specialty pharmacy vs. buy-and-bill), indication-driven prescriber switching behavior, number of expected entrants, and interchangeability status. A clustering algorithm applied to a structured dataset of biologic LOE events can generate a statistically validated analog set, which is more defensible than manual analog selection. The analog set defines the plausible range of outcomes; the model then weights scenarios by the specific features of the target drug that deviate from the analog mean.
The current patent cliff exceeds $200 billion in U.S. revenue at risk through 2030. It is dominated by complex biologics, not small molecules, which changes every material assumption in the forecasting model.
The number of generic or biosimilar competitors is the primary determinant of price erosion depth. Forecasting this number accurately, through ANDA/351(k) tracking and manufacturing capability analysis, is more valuable than refining the curve algorithm.
Biologic LOE events should be modeled primarily as net-price-erosion events, not volume-loss events. Humira’s first year demonstrates the distinction: volume held, net revenues did not.
Archetype classification before quantitative modeling is not optional. The erosion dynamics of a Contested Biologic and a Commodity Oral require entirely different model architectures, variable sets, and defensive strategy logic.
Paragraph IV litigation outcomes and biosimilar interchangeability designation are the two regulatory variables with the largest impact on forecast accuracy, yet both are frequently excluded from commercial LOE models.
The IRA’s Medicare price negotiation program introduces a pre-LOE price reduction event that breaks historical erosion analogues for affected drugs. Models need an explicit IRA track for any drug subject to MFP negotiation.
Monte Carlo simulation, not point-estimate forecasting, is the minimum viable methodology for decisions involving hundreds of millions of dollars in LOE strategy investment. Leadership needs the probability distribution, not the median.
Best-practice LOE planning begins 4 to 5 years before expiry. The goal at that stage is archetype-shifting lifecycle management, not defensive tactics. The archetype you are in at year minus one is largely the archetype you are defending at LOE.
This analysis synthesizes publicly available data from FDA regulatory filings, HHS ASPE, IQVIA Institute reports, peer-reviewed pharmaceutical economics literature, and company financial disclosures. Patent timelines and revenue figures are estimates based on available data and may change with litigation outcomes, regulatory decisions, or company strategic actions. This content does not constitute investment advice.
Data sources include: HHS ASPE Drug Competition Series; IQVIA LOE Rules analysis (2025); Association for Accessible Medicines Generic & Biosimilar Medicines Savings Report (2024); FDA Orange Book; PMC pharmaceutical economics research; DrugPatentWatch patent and litigation database.


")


