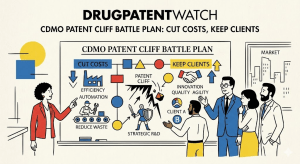
The pharmaceutical industry is currently facing a structural shift in how it calculates the value of its most successful assets. Between 2023 and 2028, branded drug sales totaling $356 billion are at risk due to patent expirations.1 This period, often called the patent cliff, signifies more than just the end of a monopoly. It represents a precipitous drop in revenue that can collapse the price of a drug by 95% once multiple generic competitors enter the market.2 For many pharmaceutical companies, the traditional model of internal manufacturing becomes a liability when margins shrink to fractions of a cent per tablet.
Contract Development and Manufacturing Organizations (CDMOs) are no longer just vendors in this environment. They are becoming the primary mechanism for sustaining the net present value (NPV) of a drug after it loses exclusivity (LOE). The global CDMO market reached a valuation of $238 billion in 2024 and is on a trajectory to hit $465 billion by 2032.3 This growth is not accidental. It is driven by the necessity for sponsors to convert massive capital expenditures (CapEx) into manageable operational expenditures (OpEx) while squeezing every possible efficiency out of the manufacturing process.4
The entry of generic competition triggers a race to the bottom. Data indicates that a single generic competitor typically slashes prices by 30% to 39%.2 When the number of competitors reaches six or more, the price erosion is so severe that only the most cost-efficient manufacturers can survive.2 This pressure is now compounded by the Inflation Reduction Act (IRA), which creates a new “loss of exclusivity” milestone in the United States. Medicare price negotiations now start at nine years for small molecules and 13 years for biologics, regardless of how much patent life remains.6 CDMOs must proactively offer process optimization and cost compression to help sponsors navigate this compressed commercial window.
Number of Generic Competitors
Average Price Reduction vs. Brand
1
30% – 39%
2
54%
6 or more
95%
2
Proactive Business Development Through Patent Intelligence
The most successful CDMOs do not wait for a Request for Proposal (RFP). They use patent data to identify opportunities years before a drug reaches the market or its patent expires. Business development teams are increasingly using platforms like DrugPatentWatch to map out the patent landscape of their target clients.3 By analyzing patent expiry dates, Paragraph IV challenges, and formulation complexities, a CDMO can tailor its pitch to solve specific manufacturing hurdles that a sponsor might not yet have realized are looming.
Mapping the 3-to-5 Year Outreach Window
For a CDMO to have a meaningful impact on a drug’s cost structure, the engagement must begin early. Strategic monitoring of patent data should start at least two to three years before anticipated expiration.8 This lead time allows for the implementation of process re-engineering and the navigation of regulatory hurdles that accompany manufacturing changes. Patent data reveals manufacturing challenges, drug delivery systems, and analytical methods that require specialized expertise.8
A CDMO that specializes in sterile injectables can monitor parenteral formulation patents to identify prospects whose products are approaching clinical manufacturing phases.8 By reaching out with a value proposition that addresses the known technical hurdles described in the patent filings—such as stability issues or complex crystallization requirements—the CDMO positions itself as a technical partner rather than a transactional vendor.
Identifying Technical Hurdles in Legal Filings
Patent filings often contain the blueprint of a drug’s manufacturing challenges. A CDMO analyzing these documents can identify opportunities for “chiral switching,” polymorphism studies, or new salt forms that could extend a drug’s life or reduce its production cost.9 These technical descriptions allow business development teams to lead with solutions. For instance, if a patent filing indicates a low-yield synthesis route, a CDMO can proactively offer a more efficient chemical process that utilizes greener solvents or fewer reaction steps.
Category of Patent Insight
Strategic Application for CDMOs
Expiration Dates
Defines the timeline for post-LOE cost compression.
Technical Claims
Identifies specific process hurdles like LNP formulation.
Legal Status
Tracks Paragraph IV challenges to predict generic entry.
Patent Families
Reveals geographic markets of strategic importance.
5
Using DrugPatentWatch helps CDMOs differentiate between “imminent” competition (within 24 months) and “distant” competition (beyond 60 months).11 This segmentation allows for a more targeted allocation of business development resources, focusing on assets where the sponsor is most desperate for a cost-saving manufacturing partner.
Biologics and the Physics of Titer
In the world of biologics, the cost of goods (CoGs) is dominated by the efficiency of the cell line. The primary metric for this efficiency is “titer,” which measures the amount of drug product produced per liter of bioreactor volume. A CDMO that can optimize a cell line to increase its titer from 2 g/L to 5 g/L effectively cuts the manufacturing cost in half.3
Intensified Fed-Batch and Perfusion Technology
Traditional fed-batch processes have reached a plateau in many applications. Modern CDMOs are turning to Intensified Fed-Batch (IFB) and perfusion technologies to drive yields higher. IFB uses perfusion to increase N-1 cell density, which then enhances the inoculation cell density in the production phase.12 This approach has demonstrated the ability to double yields across a wide range of projects.
These improvements are not just about the final number. They allow sponsors to use smaller bioreactors to achieve the same output, which significantly reduces the cost of raw materials and media. In an era where fill-finish capacity for GLP-1 drugs and other biologics is at a premium, these efficiency gains are a critical competitive advantage.3
The Relationship Between Scale and Unit Cost
Expanding the scale of production remains one of the most effective ways to compress costs. A CDMO-based cost model shows that increasing the production scale from 500 L to 2,000 L reduces the CoGs per unit of drug substance by approximately 50%.12 When the scale reaches 4,000 L, the unit cost falls to roughly 30% of the 500 L baseline.
Upstream Production Scale (L)
Relative CoGs per Unit of Drug Substance
500
100% (Baseline)
2,000
50%
4,000
30%
12
CDMOs that offer “scale-out” models—using multiple 2,000 L disposable bioreactors instead of a single massive stainless steel tank—provide sponsors with greater flexibility. This modular approach allows for rapid scaling in response to market demand fluctuations without the risk of massive underutilization if a product’s market share drops after generic entry.4
Small Molecules and the Pivot to Continuous Manufacturing
While biologics grab headlines, small molecules still represent 58% of the revenue in the sustainable manufacturing market.14 For these drugs, the primary driver of cost after patent expiry is manufacturing efficiency. The traditional batch manufacturing process is being challenged by Continuous Manufacturing (CM), which offers a significantly smaller footprint and lower operational costs.
Slashing the Manufacturing Footprint
A continuous manufacturing facility is at least 70% smaller than a traditional batch production facility.15 This reduction in size translates directly into lower energy costs, reduced labor requirements, and less environmental impact. CM processes are particularly beneficial for multi-step reactions that are common in the pharmaceutical industry. By integrating real-time sensors and Process Analytical Technology (PAT), CM allows for continued monitoring and feedback control, which improves product quality and reduces waste.15
Studies estimate that capital expenditures for a CM facility can be 20% to 76% lower than for a batch facility. For high-volume legacy drugs, the overall manufacturing costs can be 9% to 40% lower.15 Despite these benefits, adoption has been slow among generic manufacturers due to the high upfront investment and the need for highly skilled personnel.16 Proactive CDMOs that have already invested in CM platforms can offer this cost-saving technology to sponsors who cannot justify building their own facilities for off-patent assets.
Real-Time Release Testing (RTRT)
One of the most significant “hidden costs” in batch manufacturing is the time spent waiting for quality control samples to be tested in a laboratory between steps. Continuous manufacturing enables Real-Time Release Testing (RTRT), which shifts quality control from a reactive process to a proactive, in-line monitoring system.18 By eliminating the need for batch release delays, CDMOs can help sponsors become more agile and responsive to market changes or drug shortages.
Manufacturing Method
Facility Size Reduction
Cost Savings (Blockbuster)
Quality Control Model
Batch Manufacturing
0% (Baseline)
0% (Baseline)
Reactive (Lab-based)
Continuous Manufacturing
70%+
9% – 40%
Proactive (PAT/RTRT)
15
The Regulatory Maze of Post-Approval Changes
Any optimization of a manufacturing process after a drug has been approved requires a clear regulatory strategy. The “regulatory tax” of filing manufacturing changes can often outweigh the operational savings if not managed correctly. CDMOs must be experts in navigating the FDA’s Scale-Up and Post-Approval Changes (SUPAC) guidelines and the EMA’s Post-Approval Change Management Protocols (PACMP).
Navigating SUPAC Levels
The FDA categorizes manufacturing changes into three levels based on their potential to impact product quality. CDMOs must understand these boundaries to ensure that cost-saving optimizations do not trigger unnecessary and expensive bioequivalence studies.19
Level I Changes: These are minor modifications in components or composition that have a minimal potential to affect quality. They can be implemented immediately and reported in an annual report.19
Level II Changes: These are moderate changes in equipment or the manufacturing process. They typically require a “Changes Being Effected” (CBE-30) supplement, which allows the product to be distributed 30 days after the FDA receives the filing.21
Level III Changes: These are major modifications, such as a significant change in the synthesis of the drug substance. These require a Prior Approval Supplement (PAS) and often necessitate full bioequivalence data, which can take months to secure.19
A CDMO that can implement a 20% yield improvement while keeping the change within a Level I or Level II category provides a massive strategic advantage to a sponsor. By avoiding the time and cost of a PAS, the sponsor can begin realizing the financial benefits of the optimization much faster.
The European Advantage: PACMP
In Europe, the EMA utilizes Post-Approval Change Management Protocols (PACMP) to streamline the submission of manufacturing changes. A PACMP is a prospectively written plan that describes the specific changes a company wants to implement and how the impact will be verified.23
An approved PACMP allows a company to “downgrade” the category of a change. For example, a major “Type II” variation might be reported as a “Type IB” or “Type IA” notification if it follows the agreed-upon protocol.23 This predictability reduces the risk of supply interruptions and allows for the rapid implementation of cost-saving measures across multiple global manufacturing sites.
Regulatory Mechanism
Scope
Primary Benefit
FDA SUPAC
Post-approval manufacturing changes.
Defines data requirements based on risk levels.
FDA CBE-30
Moderate changes.
Allows distribution 30 days after filing.
EMA PACMP
Pre-agreed protocol for changes.
Downgrades reporting category for faster approval.
ICH Q12
Lifecycle management.
Enables a science-based approach to variations.
19
Digital Maturity as a Competitive Lever
The digital maturity gap between CDMOs is becoming a primary factor in client selection. According to recent industry reports, while 60% of pharmaceutical companies view AI as critical for process optimization, only 28% of CDMOs have prioritized it.3 CDMOs that invest in digital manufacturing, electronic batch records, and real-time analytics can offer a level of transparency and efficiency that justifies their pricing.
The ROI of Paperless Batch Records
The most immediate financial benefit of digital automation comes from the elimination of paper-based systems. Manual batch records are the primary source of documentation-related deviations, which are expensive to investigate and resolve. A digital Manufacturing Execution System (MES) validates entries in real-time, preventing operators from moving to the next step if an error is detected.25
A case study of a CDMO implementing digital automation showed that slashing “right-to-left” time with paperless batch records redeployed 10 to 15 quality assurance personnel from “paper-checking” to high-value quality engineering. This single change resulted in estimated annual savings of $1.5 million to $2.5 million.25
Predictive Maintenance and Waste Reduction
Deviations and batch failures are the “silent killers” of profitability. AI-driven systems can monitor sensor data from equipment to predict failures before they happen. For example, if a gearbox on a bioreactor starts vibrating in a specific pattern, the AI can detect this three weeks before a catastrophic failure.25 This allows for proactive maintenance that prevents the loss of a $10 million batch of drug substance.
Area of Digital ROI
Estimated Annual Savings (CDMO Case Study)
Paperless Operations
$1.5 Million
QA Review by Exception
$2.0 Million
Deviation Reduction
$2.2 Million
Supply Chain Optimization
$1.0 Million
Total Direct Savings
$6.7 Million
25
With a total investment of $15 million, this digital transformation achieved a payback period of less than three years.25 CDMO business development teams that can present this kind of hard data on ROI are far more likely to secure long-term partnerships with skeptical biopharma sponsors.
The “BIOSECURE” Surcharge and Geopolitical Resilience
The CDMO market is currently navigating the “geopolitical premium.” The proposed BIOSECURE Act in the United States has made Chinese manufacturing sources a “toxic” asset for companies that rely on U.S. federal funding or market access.3 This has led to a massive reshuffling of the supply chain, as sponsors seek non-Chinese sources for their commercial manufacturing.
Reshoring as a Risk Management Strategy
While manufacturing in China has historically been 30% to 50% cheaper than in Western markets, the risk of decoupling has changed the math. Sponsors are now willing to pay a premium for “geopolitical resilience”.3 CDMOs located in North America and Western Europe are proactively pitching their ability to provide a stable, long-term manufacturing home that is immune to the vagaries of international trade disputes.
This resilience extends beyond geography to the integrity of the supply chain. CDMOs that manage their own raw material sourcing and have qualified second sources for all critical components are better positioned to guarantee continuity of supply.10 In an environment where a single missing $1,000 filter can put a $10 million batch on hold, this “operational shock absorber” role is a major selling point.25
Diversifying the Vendor Base
To mitigate the risks of tariffs and “just-in-time” vulnerabilities, CDMOs are adopting multi-facility strategies and expanding their vendor bases.26 This holistic supply chain transformation allows them to turn geopolitical complexities into a competitive advantage. By offering end-to-end support—from API manufacturing to finished dosage form distribution—integrated CDMOs reduce the number of handoffs and the risk of communication breakdowns that often occur when using multiple fragmented vendors.10
Procurement Transformation and the Power of Scale
The consolidation of the CDMO industry through mergers and acquisitions has created entities with immense buying power. When regional CDMOs merge, they can consolidate their procurement departments and address a total spend that often exceeds tens of millions of euros.29
The Merger of Regional CDMOs
In a case study from OCM Consulting, a CDMO formed by the merger of several regional players achieved 16% total savings by centralizing its procurement of 3,500 different raw materials.29 The foundation of this success was transparency. By understanding the dependencies across all SKUs, the central department could request worldwide quotations and force existing suppliers to offer more competitive rates.
Strategic Sourcing Levers
Centralized procurement departments use three primary levers to drive cost optimization:
Competition with Existing Suppliers: By consolidating volumes, the CDMO gains the leverage to negotiate seasonally predictable spot prices rather than fixed contracts.29
Direct Sourcing: Bypassing intermediaries and negotiating directly with manufacturers reduces the margins paid to middlemen. This also allows for volume commitments that improve production capacity utilization for the manufacturers, further lowering costs.29
2-Supplier Strategy: Moving from a single-source to a dual-sourcing model reduces procurement risk and provides a “bench” of qualified alternative suppliers for future price negotiations.29
Procurement Phase
Results Achieved
Trader Tendering
31% Savings
Negotiation with Existing Suppliers
7% Savings per year
Alternative Source Contracting
48% Savings (Pending qualification)
29
These savings are particularly relevant for legacy drugs, where raw material procurement can account for up to 50% of the total manufacturing cost.29 CDMOs that can pass these savings on to their sponsors are much more likely to retain high-volume, low-margin contracts after patent expiry.
Green Chemistry as a Financial Imperative
Sustainable manufacturing is transitioning from a “nice-to-have” ESG goal to a core financial strategy. The pharmaceutical industry is shifting from resource-intensive methods to practices that reduce waste and enhance cost-effectiveness.14 Companies that master sustainable operations benefit from lower costs, resource optimization, and improved market access.14
Solvent Recovery and Reuse
In small-molecule synthesis, solvents are the primary source of waste. AstraZeneca and GSK have integrated green chemistry practices that reduce solvent use by 30%.31 This reduction lowers both the cost of purchasing raw materials and the expense of hazardous waste disposal. Novartis achieved a $20 million operational saving over three years through solvent recovery and energy efficiency projects.31
Continuous Manufacturing and the Carbon Footprint
Continuous manufacturing is the dominant segment in the sustainable drug manufacturing market forecast.14 Because CM facilities are significantly smaller and more energy-efficient, they allow companies to rapidly adopt a lower carbon footprint. This alignment with ESG expectations also creates cost-saving opportunities through government grants and sustainability-linked bonds.14 For instance, Novartis issued a $2.3 billion sustainability-linked bond tied to carbon reduction targets, which effectively reduced its cost of capital.31
Sustainability Metric
Financial Impact (Case Studies)
Solvent Use Reduction
30% reduction in production costs.
Water Consumption
42% reduction at key sites.
Energy Efficiency
$20M savings over three years.
Circular Packaging
$18M savings in logistics and manufacturing.
31
CDMOs that offer green chemistry as a “built-in” feature of their process development allow sponsors to meet their environmental goals without incurring the high compliance costs of retrofitting their own aging internal facilities.31
The Technology Transfer Tax: Slashing Inefficiency
Moving a pharmaceutical process from one facility to another is never a simple “copy-paste” operation. This “Technology Transfer Tax” includes the hidden costs of engineering batches, analytical method validation, and administrative delays.3
The “Symphony” of Integrated CDMOs
Modern CDMOs bridge the gap between Contract Research Organizations (CROs) and Contract Manufacturing Organizations (CMOs). By providing a seamless continuum of services—from discovery through commercialization—they eliminate the logistical hurdles and knowledge gaps that occur when a project is handed off between separate vendors.10
A combined CDMO and CRO approach has the potential to reduce development timelines by 7 to 19 months.33 This speed-to-market is a crucial competitive advantage in crowded therapeutic areas where every day under patent protection is worth millions of dollars in revenue.4
Digital Tech Transfer and “Digital Twins”
To slash the time spent on technology transfer, advanced CDMOs are using digital platforms that allow for “digital tech transfer.” Instead of transferring paper binders, the sponsor’s process parameters are built as a “recipe” in the CDMO’s MES.25 This allows for real-time validation and reduces the number of engineering batches required to replicate the process at scale.
Tech Transfer Phase
Traditional Model Inefficiency
Integrated CDMO Benefit
Knowledge Hand-off
2-4 month delay between vendors.
0 delay; data remains in one system.
Process Replication
3-5 engineering batches required.
1-2 batches via “Digital Twin” simulation.
Analytical Validation
Separate validation at each site.
Harmonized methods across the network.
Overall Timeline
Standard development speed.
7-19 month reduction in time-to-market.
13
Pricing Models: From FTE to Outcome-Based
The traditional CDMO pricing models—Fee-for-Service (FFS) and Full-Time Equivalent (FTE)—are increasingly being replaced by sophisticated performance-based and risk-sharing agreements. FFS models often transfer the risk to the CDMO, but they also bake in a “risk premium” that inflates the initial budget.3
Performance-Based Payments
In a performance-based model, the CDMO accepts a lower base fee in exchange for “success fees” tied to specific outcomes, such as achieving a yield target or regulatory approval.3 This aligns the CDMO’s incentives with the client’s success. If the CDMO can optimize the process to reduce the cost per batch, they share in the financial reward.
Risk-Sharing Agreements (RSAs)
Risk-sharing agreements are commonly used to manage uncertainties in costs and clinical benefits. While these were historically used between payers and manufacturers, they are now being adapted for the CDMO-sponsor relationship.35 Under an RSA, the price of the manufacturing service is linked to the real-world performance of the drug or the achievement of specific manufacturing milestones.36 This model fosters a deeper, more strategic partnership that transcends the transactional “per-pill” model.4
Pricing Model
Pros for Sponsor
Cons for Sponsor
Fee-for-Service
High budget predictability.
CDMO may use change orders as profit levers.
Full-Time Equivalent
Maximum flexibility for R&D.
Client assumes productivity risk.
Performance-Based
Motivates efficiency and yield.
Requires clearly defined, measurable KPIs.
Risk-Sharing (VBC)
Aligns cost with commercial value.
High legal and management complexity.
3
Future Modalities: ADCs, CGTs, and mRNA
As the industry moves toward more complex modalities like Antibody-Drug Conjugates (ADCs) and Cell and Gene Therapies (CGTs), the role of the CDMO becomes even more critical. These therapies require specialized expertise and capital investment that few sponsors possess in-house.5
Manufacturing Complexity in Novel Modalities
CGTs are currently the most volatile pricing environment. The sector is projected to grow at a CAGR of 28% through 2034.3 However, the cost of manufacturing remains a significant barrier to access. Fully automated platforms have demonstrated a significant reduction in batch-to-batch variability and operator error, yielding higher product quality while reducing the need for highly trained staff and expensive cleanroom facilities.37
The Piling Up of “Hidden” Costs
For novel modalities, “hidden costs” can quickly derail a project’s P&L. These include stability storage, raw material markups (often 15% to 25%), and the “Shadow Team” cost of offshore management.3 Stability testing is mandatory and expensive; a 5-year study with multiple conditions can involve thousands of pull-points and tests, quietly accumulating costs over the product’s life.3 CDMOs that offer transparent, all-inclusive pricing for these services provide a more accurate Total Cost of Ownership (TCO) analysis, which is essential for making informed lifecycle management decisions.3
Key Takeaways
Patent Intelligence as a Sales Tool: CDMOs should use DrugPatentWatch to target clients 3-5 years before LOE, offering specific process optimizations described in patent claims to compress costs before generic entry.
The Yield Advantage: Increasing biologic titers from 3.9 g/L to 7.6 g/L can reduce CoGs by 40%. Intensified Fed-Batch and scaling to 4,000 L are the primary levers for this compression.
Digital ROI is Measurable: Transitioning to paperless batch records and AI-driven quality systems can save $6.7 million annually per facility with a payback period of less than three years.
Regulatory Mastery Saves Time: Understanding the boundaries of SUPAC and PACMP allows CDMOs to implement yield-improving changes without triggering months of PAS-related delays.
Geopolitical Resilience: Proactive CDMOs are leveraging the BIOSECURE Act to pitch reshored, non-Chinese supply chains as a “risk-free” alternative for U.S.-facing sponsors.
Sustainability is Profitable: Green chemistry practices, such as solvent recovery, have yielded $20 million in operational savings at firms like Novartis while reducing regulatory risk.
FAQ
How can a CDMO use patent data to identify cost-saving opportunities for a sponsor?
By analyzing technical descriptions in patent filings, CDMOs can identify inefficient synthesis routes or low-yield fermentation processes. They can then proactively offer better-performing alternatives—such as more stable polymorphs or optimized cell lines—years before the core patent expires, helping the sponsor maintain a competitive price floor.
What are the primary differences between the FTE and FFS pricing models?
In a Fee-for-Service (FFS) model, the sponsor pays a set price for a defined scope of work, which provides high budget predictability but often leads to costly “change orders.” In a Full-Time Equivalent (FTE) model, the sponsor pays for a dedicated team of scientists, which offers maximum flexibility for early-stage development but places the risk of productivity on the sponsor.
How does “Review by Exception” reduce the cost of quality assurance?
Review by Exception is a digital quality control strategy where QA personnel only review data that falls outside of pre-set parameters (exceptions). This is enabled by MES and LIMS platforms that validate entries in real-time. By automating the review of routine data, CDMOs can slash batch review times by 60-70% and redeploy QA staff to high-value process improvements.
What regulatory hurdles exist for scaling up a manufacturing process post-approval?
In the United States, scaling up is governed by SUPAC guidelines. Minor changes (Level I) only require an annual report, while moderate changes (Level II) require a CBE-30 filing. Major changes (Level III), such as a significant synthesis change, require a Prior Approval Supplement (PAS) and often full bioequivalence studies, which can be both time-consuming and expensive.
Why is “titer” the most important metric for biologics cost compression?
Titer is the concentration of the drug product in the fermentation broth. Increasing titer allows for the production of more drug substance using the same amount of bioreactor volume and media. Since media and capital equipment are the largest costs in biologics manufacturing, doubling the titer effectively cuts the unit cost of goods in half.
Guidance for Industry: CMC Postapproval Manufacturing Changes To Be Documented in Annual Reports – FDA, accessed February 26, 2026, https://www.fda.gov/media/79182/download
Environmental Sustainability Strategy of Active Pharmaceutical Ingredient Manufacturing: A Perspective from the American Chemical Society Green Chemistry Institute Pharmaceutical Roundtable – ACS Publications – ACS.org, accessed February 26, 2026, https://pubs.acs.org/doi/10.1021/acssuschemeng.5c01094
How Risky Is That Risk Sharing Agreement? Mean-Variance Tradeoffs and Unintended Consequences of Six Common Risk Sharing Agreements – PMC, accessed February 26, 2026, https://pmc.ncbi.nlm.nih.gov/articles/PMC7876771/