Why Most Cost-Cutting Advice Fails Employers and Plan Sponsors
Every benefits consultant in America will tell you the same thing: pharmacy spend is the fastest-growing line item on your benefits budget. What they won’t tell you is that most of the solutions they’re selling are cosmetic. Higher copays shift costs to employees but don’t reduce them. Narrow formularies generate grievances without delivering the structural savings that actually move the needle. Tiered benefit designs make your HR team miserable in open enrollment season without addressing the root cause of the problem — which is that American drug pricing is, at its core, an information asymmetry problem.
The employers, health plans, and pharmacy benefit managers (PBMs) that are genuinely cutting pharmaceutical costs — not by 3 percent but by 15 to 40 percent — share one characteristic: they understand the patent landscape. They know which drugs have generic or biosimilar competition available now, which ones will have competition in 12 months, and which ones manufacturers are using legally dubious patent strategies to protect from competition well past the point where competition should exist.
That knowledge is accessible. It’s public. And yet the majority of plan sponsors in the United States are making formulary and coverage decisions without it.
This article is about how you close that gap. It covers patent expiry analysis, biosimilar strategy, therapeutic interchange, reference pricing, international benchmarking, the mechanics of PBM contract reform, and the emerging model of direct-to-employer pharmacy. It draws on public patent filings, litigation records, and federal pricing data. It names the tools, the databases, and the methodologies that sophisticated health systems and large self-insured employers are already using.
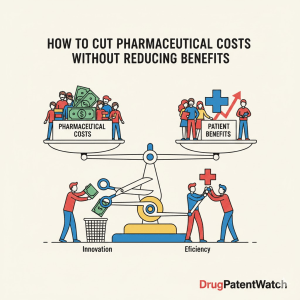
The goal is not to reduce your formulary. The goal is to stop paying brand prices for drugs that should, by any reasonable market logic, already be generic.
The Architecture of the Problem: How Drug Prices Stay High
Patent Cliffs, Patent Evergreening, and the Lifecycle Strategy
To cut pharmaceutical costs intelligently, you need to understand how drug companies manage their intellectual property portfolios — because their IP strategy is your cost structure.
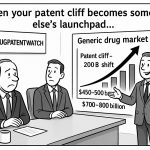
A pharmaceutical patent gives a manufacturer 20 years of market exclusivity from the filing date. In practice, because most drugs are patented years before they receive FDA approval, the effective patent life after approval is often closer to 10 to 12 years. When that clock runs out, generic manufacturers can enter the market, and prices typically drop by 80 to 90 percent within two years.
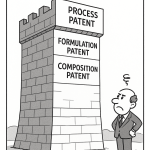
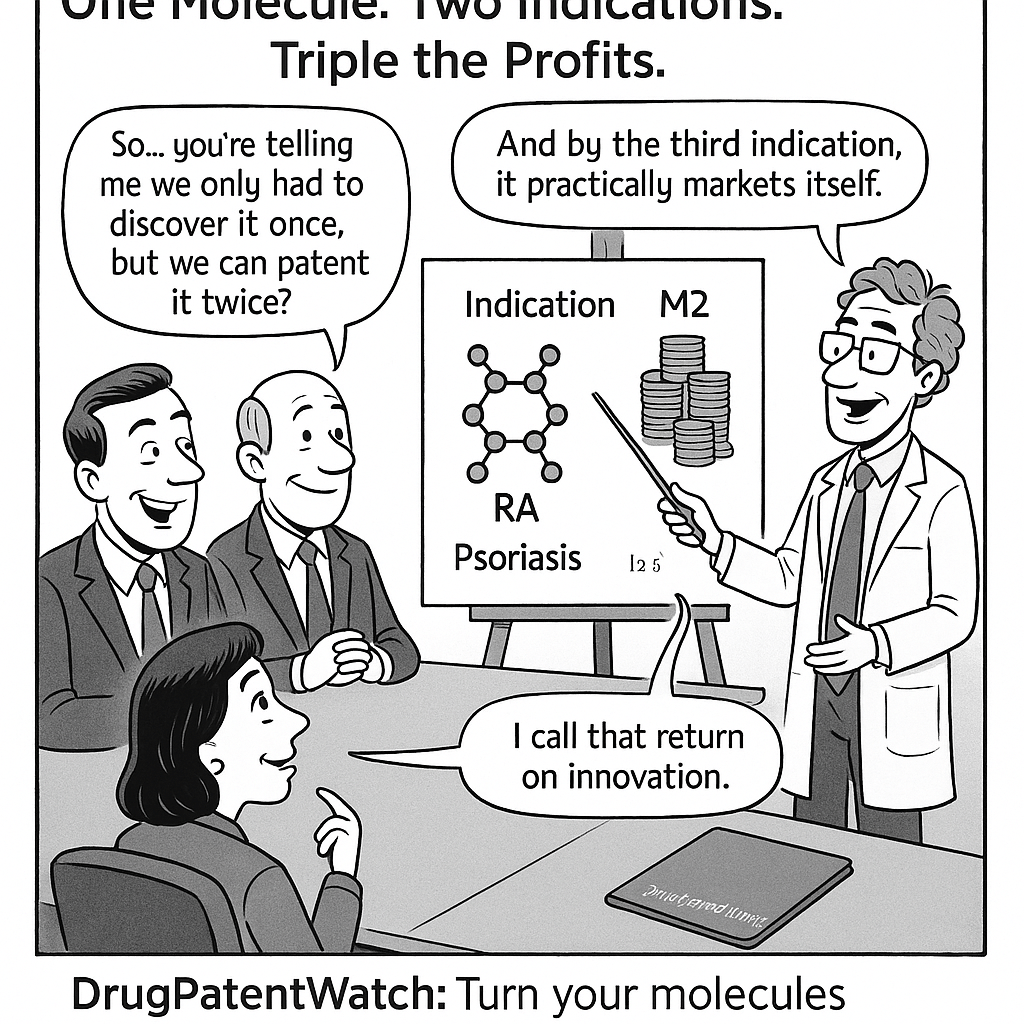
Drug companies know this. Their entire commercial strategy is built around extending the period of exclusivity as long as legally possible. The mechanism they use is called “evergreening” — filing additional patents on secondary attributes of a drug (new formulations, new delivery mechanisms, new dosing schedules, new manufacturing processes, or new indications) to effectively reset the exclusivity clock.
AstraZeneca’s Nexium is the case study every health economist uses. Esomeprazole — the active molecule in Nexium — is structurally almost identical to omeprazole, the active molecule in Prilosec, which went generic in 2002. AstraZeneca patented the S-enantiomer of omeprazole, launched it as a “new” drug, marketed it aggressively to physicians, and maintained significant brand market share for years while a chemically equivalent generic drug sat on the shelf at a fraction of the cost. The clinical literature found no meaningful therapeutic difference between the two molecules at equivalent doses.
That strategy wasn’t unique to AstraZeneca. It’s industry standard. Sanofi did it with Plavix. Abbott did it with TriCor. Allergan did it with Restasis — and got caught, leading to a now-famous attempt to transfer patents to the Saint Regis Mohawk Tribe to exploit sovereign immunity against inter partes review proceedings at the USPTO, a maneuver that the Federal Circuit ultimately rejected.
The Orange Book — the FDA’s official list of approved drugs and their patent protections — is the primary record of these layered patent strategies. But reading the Orange Book alone doesn’t tell you whether a listed patent is legally solid, whether it’s being challenged by a generic manufacturer, or when competition is actually likely to arrive. For that analysis, resources like DrugPatentWatch provide structured intelligence on patent status, litigation history, exclusivity expirations, and generic applicant filings — giving benefits analysts and formulary teams the granular data they need to make forward-looking coverage decisions.
The Role of Exclusivity Periods Beyond Patents
Patents are one layer of protection. The FDA also grants market exclusivity separately from patent protection, and the two systems interact in ways that can extend a drug’s monopoly period even after its core patents expire.
New Chemical Entity (NCE) exclusivity gives a brand-name drug five years of protection from the date of first approval, during which the FDA will not accept an Abbreviated New Drug Application (ANDA) for a generic version. New Clinical Investigation exclusivity grants three years when a sponsor submits new clinical data to support a supplemental application for a new indication, formulation, or population.
For biologics — the large-molecule drugs that have become the dominant growth category in pharmaceutical spend — the Biologics Price Competition and Innovation Act created a 12-year reference product exclusivity period, far longer than the five years granted to small-molecule drugs. This was a deliberate legislative choice, heavily lobbied for by the biotechnology industry, and it has had the predictable effect of keeping biosimilar competition out of the U.S. market for longer than the European market, where the analogous period is eight years.
Pediatric exclusivity adds another six months to any existing patent or exclusivity, which sounds minor until you realize that six months of exclusivity on a blockbuster drug generating $3 billion a year in annual U.S. revenue is worth $1.5 billion.
The cumulative effect of these overlapping protections — core composition patents, formulation patents, method-of-use patents, NCE exclusivity, pediatric exclusivity, and data exclusivity — is that the effective monopoly period for many drugs extends well beyond 20 years from the initial patent filing. The Initiative for Medicines, Access and Knowledge (I-MAK) published analysis finding that the top 12 best-selling drugs in the U.S. have, on average, 38 patents each, with an average monopoly period extending to 38 years.
That is not a market failure in the conventional sense. It’s a designed outcome of an IP system that was built under intense industry pressure and has never been comprehensively reformed.
Reading the Patent Landscape: A Practical Framework
The Orange Book as a Starting Point — and Its Limitations
Every cost-optimization strategy for pharmaceuticals begins with the Orange Book. Published by the FDA, it lists all approved drug products and their therapeutic equivalence evaluations. For each drug, it lists the patents that the innovator company has certified are relevant to the product, along with their expiration dates.
Here’s what the Orange Book does not tell you: it doesn’t tell you whether those patents are valid. It doesn’t tell you whether a generic company has filed a Paragraph IV certification challenging those patents. It doesn’t tell you which challenges are likely to succeed or fail. It doesn’t tell you whether a first generic filer is in a settlement agreement that delays their launch. And it absolutely does not flag the strategic settlements — known as reverse payment or pay-for-delay agreements — in which brand manufacturers have paid generic competitors to stay off the market.
For a benefits analyst or formulary manager trying to project when a specific drug will face generic competition, that missing context is decisive.
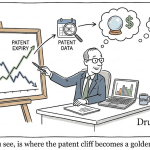
This is exactly the gap that structured patent intelligence tools fill. DrugPatentWatch aggregates patent expiry data, ANDA filing records, Paragraph IV certification letters, litigation outcomes, first-to-file exclusivity status, and settlement histories into a queryable database. A formulary analyst can look up any brand-name drug and see not just the listed patent expiry date, but the realistic competitive timeline — accounting for ongoing litigation, likely settlement patterns, and the history of similar cases.
That intelligence changes the nature of the formulary decision. If you know that a $40,000-per-year specialty drug will have its core patent successfully challenged within 18 months and a first-wave biosimilar or generic is likely to enter the market, you can make a short-term coverage decision — potentially with a higher cost-share during the brand-only period — rather than permanently restructuring your formulary around a drug that will soon be dramatically cheaper.
How to Identify Drugs Ripe for Generic Substitution
The practical methodology for identifying savings opportunities has four steps.
The first step is to pull your plan’s current drug spend data, sorted by total plan expenditure. You want the top 25 to 50 drugs by total cost, not by utilization count — because the savings opportunities in specialty pharmacy will almost never appear in a utilization-based sort but represent the bulk of your spend.
The second step is to run each of those drugs against a patent expiry analysis. For each drug, you want to know the expiration date of the primary composition patent, the expiration date of any secondary formulation or use patents, the status of any pending Paragraph IV challenges, and whether a first filer has exclusivity that could limit generic competition even after the initial launch.
The third step is to cross-reference the patent analysis against FDA approval records for any pending ANDAs or biosimilar applications. The presence of multiple ANDA filers for a given drug is a strong predictor that competition is coming. The absence of any ANDA filings, even with a near-term patent expiry, may indicate that the market size doesn’t support generic entry, that manufacturing complexity creates a barrier, or that a pay-for-delay agreement is in place.
The fourth step is to categorize your findings into three buckets: drugs with imminent competition (within 24 months), drugs with medium-term competition (24 to 60 months), and drugs with distant or uncertain competition (beyond 60 months or no filings visible). Your formulary strategy, step therapy protocols, and rebate negotiating position should all be calibrated to this timeline.
Paragraph IV Litigation as a Forward Indicator
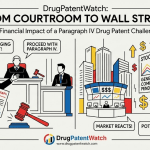
When a generic drug company files an ANDA and certifies that an Orange Book-listed patent is either invalid or will not be infringed by its product, the brand manufacturer typically has 45 days to sue for patent infringement. The filing of that lawsuit triggers an automatic 30-month stay of FDA approval for the generic — a feature of the Hatch-Waxman Act that was intended to protect legitimate IP rights but has been used systematically to delay generic entry.
The existence of a Paragraph IV challenge, and especially the outcome of the resulting litigation, is one of the most valuable forward indicators available to a formulary analyst. A successful Paragraph IV challenge — where a court finds the listed patent invalid or not infringed — eliminates that patent as a barrier to generic entry. An unsuccessful challenge reinforces the validity of the patent and extends the exclusivity timeline.
You don’t need a law degree to use this data. What you need is access to the litigation record — which is publicly available through PACER, the federal court filing system, and through commercial pharmaceutical patent databases. DrugPatentWatch tracks Paragraph IV filings and outcomes systematically, allowing benefits analysts to see which drugs are currently in litigation, which patents have been invalidated, and which generic manufacturers are positioned to launch.
For a formulary team, this data has immediate practical applications. A drug whose core patent has been ruled invalid in Paragraph IV litigation is a near-term generic candidate, even if the listed expiry on the Orange Book shows a distant date. A drug with no Paragraph IV challengers, despite an ostensibly near-term expiry, warrants a harder look at whether secondary patents or exclusivity protections are extending the realistic competitive timeline.
The Biosimilar Opportunity: Still Largely Untapped
Why Biosimilars Have Not Delivered the Savings They Should
The Biologics Price Competition and Innovation Act was signed into law in 2010 with the explicit goal of creating a competitive market for biologic drugs — the large-molecule, highly complex drugs that include monoclonal antibodies, insulin products, and other biologics that have become the single largest category of pharmaceutical spend for most employer plans.
More than 15 years later, the biosimilar market in the United States has delivered meaningful savings in some therapeutic categories and essentially nothing in others. The gap between the potential and the actual is large, and understanding it is essential for any serious cost-reduction strategy.
The structural barriers are well documented. Brand manufacturers have used every available tool to slow biosimilar uptake: filing extensive patent thickets that make “patent dance” negotiations under the BPCIA extraordinarily lengthy, entering into rebate agreements with PBMs and health plans that make it financially irrational for them to prefer a biosimilar over a rebated brand, using patient assistance programs and co-pay cards to suppress patient-level price sensitivity, and engaging in exclusionary contracting practices.
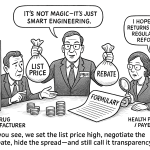
The rebate system deserves particular attention because it is the mechanism most directly within the control of plan sponsors. A brand manufacturer of a biologic with significant biosimilar competition can offer a health plan or PBM a rebate of 50 to 60 percent of the list price — conditioned on the plan maintaining the brand’s preferred formulary position. The net effective price of the brand drug, after the rebate, may then be lower than the list price of the biosimilar, which is paying little or no rebate.
This is economically perverse — but it is the logical outcome of a system where rebates flow to PBMs and plan sponsors, not to patients, and where PBM compensation is often structured as a percentage of list price (which means higher list prices generate higher PBM revenue, regardless of the rebate). The result is a marketplace in which list price competition from biosimilars can actually harm a plan sponsor’s bottom line under a traditional rebate-based contract structure, because the biosimilar’s lower list price generates less rebate revenue without a proportional reduction in net cost.
The Insulin Case: A Microcosm of Systemic Dysfunction
No case illustrates the dysfunction of the biosimilar market more clearly than insulin. The United States has one of the highest insulin prices in the world by an enormous margin. Insulin is not a new drug — it was first purified in 1921. The active molecules in most modern insulin products are in the public domain. Yet American patients have historically paid 10 times what Canadian patients paid for the same insulin formulations from the same manufacturers.
The mechanism of this price maintenance was complex. Manufacturers filed patents on delivery devices (insulin pens), on formulation concentrations, on manufacturing processes, and on new analogues with marginal clinical differences. PBMs preferred products with higher rebates, which drove list price inflation. Insurance designs that tied patient cost-share to list price before the deductible made patients acutely sensitive to the cost — creating political pressure that the industry managed by launching patient assistance programs rather than reducing prices.
The outcome changed meaningfully when three factors converged. The IRA’s $35 insulin cost-share cap for Medicare beneficiaries created direct political pressure. Several states enacted their own insulin cost caps. And biosimilar insulin products began entering the market with significantly lower list prices.
Civica Rx, a nonprofit generic drug manufacturer founded by a consortium of health systems, launched biosimilar insulin at $35 per vial or $55 per pen — compared to brand insulin prices that had reached $300 to $400 per vial. For self-insured employers and health plans willing to bypass traditional PBM formulary structures and contract directly with Civica or through alternative distribution channels, the savings were immediate and substantial.
The insulin case is a template. It shows that the path to lower pharmaceutical costs runs through formulary independence, alternative distribution models, and a willingness to make coverage decisions based on clinical equivalence rather than rebate optimization.
Formulary Strategies That Actually Accelerate Biosimilar Uptake
Health plans and employers that have successfully driven biosimilar utilization share several characteristics in their formulary design.
They place biosimilars on Tier 1 or Tier 2 with the lowest patient cost-share, rather than equivalencing the brand and its biosimilar at the same tier. This matters because physicians and patients respond to out-of-pocket cost signals, and a biosimilar that costs the same as the brand will not displace it through price competition alone.
They implement step therapy protocols that require a trial of the biosimilar before a brand biologic is covered — except in clinical circumstances that genuinely warrant brand preference. Step therapy for biologics requires careful clinical design to avoid creating access barriers for patients who are stable on existing therapy, and several states have enacted right-to-override laws that constrain step therapy implementation. But where properly designed and legally compliant, step therapy is among the most powerful formulary tools available.
They communicate transparently with prescribers. Physician education about biosimilar efficacy, safety, and interchangeability designations is a prerequisite for effective biosimilar formulary policy. The FDA’s interchangeability designation — granted when a biosimilar meets a higher evidentiary standard demonstrating that pharmacists can substitute it for the reference product without prescriber intervention — has been assigned to a growing number of biosimilars, particularly in the insulin space. Educating prescribers about which biosimilars carry this designation, and what it means clinically, reduces the friction that slows substitution at the point of dispensing.
They align incentives between the plan and the patient. Co-pay accumulator programs that prevent manufacturer co-pay cards from counting toward deductibles can increase effective patient cost for biosimilars (which often have less robust co-pay support programs than brand manufacturers). Some plans have restructured their cost-share design to apply lower patient out-of-pocket costs specifically for biosimilars and generics, making the biosimilar the financially rational choice for the patient as well as the plan.
PBM Reform: The Lever You’re Probably Not Pulling Hard Enough
How PBM Contracts Create Hidden Costs
The pharmacy benefit manager sits at the center of most employer drug spending — and for most employers, the PBM contract is the least-understood document in their benefits portfolio. Understanding how PBM compensation works is not optional if you’re serious about cost reduction.
Traditional PBM contracts create compensation through multiple revenue streams, some transparent and some not. The transparent components are the administrative fee and the dispensing fee. The less transparent components include: spread pricing (the difference between what the PBM charges the plan for a drug and what it pays the pharmacy, which the PBM retains as revenue); rebate retention (the portion of manufacturer rebates that the PBM keeps rather than passing through to the plan); DIR fees (Direct and Indirect Remuneration fees collected from network pharmacies, predominantly in Medicare Part D but analogous structures exist in commercial plans); and clinical program fees charged by PBM-affiliated specialty pharmacies that often have no competitive alternative in the network. <blockquote> “The average employer plan sponsor has no idea what their PBM is actually being paid. We’ve reviewed contracts where the PBM was retaining 30 to 40 percent of total rebates. On a plan spending $10 million a year on pharmaceuticals, that’s potentially $500,000 or more going to the PBM that the employer thought was being passed through.” — Pemberton Health Advisors, independent PBM audit firm, 2024 employer survey </blockquote>
The spread pricing problem is particularly acute for generic drugs. A PBM might reimburse a pharmacy $8 for a generic drug and charge the plan $22 — retaining $14 in spread. Across thousands of generic claims, this spread accumulates into millions of dollars in hidden PBM revenue that never appears as a line item on plan reporting.
The rebate retention problem is most significant for specialty drugs. Manufacturer rebates on high-cost specialty products can exceed 50 percent of list price. When a PBM retains 35 to 50 percent of those rebates rather than passing them through to the plan, the effective cost to the plan is substantially higher than it would be under a fully transparent pass-through arrangement.
What Pass-Through Pricing Actually Means — and How to Audit It
A “pass-through” PBM contract, in theory, eliminates spread pricing and rebate retention. The PBM charges the plan the actual ingredient cost (typically the amount the PBM paid to the pharmacy or wholesaler), plus a transparent administrative fee. All manufacturer rebates flow directly to the plan.
In practice, “pass-through” is one of the most abused terms in PBM contracting. Contracts that describe themselves as pass-through often contain provisions that create non-transparent revenue streams through different mechanisms: performance fees tied to formulary placement that function economically like rebate retention, ownership of specialty pharmacy subsidiaries that charge above-market dispensing fees, and audit rights language that makes independent verification practically impossible.
The only reliable way to verify whether a pass-through contract is genuinely performing as represented is through a comprehensive independent PBM audit. Employers and plan sponsors have statutory audit rights under most PBM contracts, though those rights are often subject to procedural limitations that make meaningful audit access difficult. Independent PBM audit firms — not actuarial firms with existing PBM relationships — can forensically examine claims data, rebate reconciliation reports, and pharmacy payment records to quantify the gap between stated and actual pass-through performance.
The audit findings reported by independent consultants in recent years have been striking. A 2023 actuarial analysis by Milliman found that employers using traditional spread-pricing PBM contracts were paying, on average, 20 to 30 percent more for pharmacy benefits than employers using genuinely transparent pass-through arrangements. Given that the average employer-sponsored health plan spends roughly $2,500 to $4,000 per employee per year on pharmaceuticals, the implied savings from contract reform can be substantial.
The Growing Market for Independent PBMs and Direct Manufacturer Contracts
The three largest PBMs — CVS/Caremark, Express Scripts (Cigna), and OptumRx (UnitedHealth) — control an estimated 80 percent of the U.S. pharmacy benefit market. Their scale creates real advantages: negotiating leverage with manufacturers and pharmacies, clinical program infrastructure, and administrative capabilities that smaller organizations can’t easily replicate. It also creates structural conflicts of interest, because all three are vertically integrated with specialty pharmacy operations, health insurers, and, in CVS’s case, retail pharmacy chains.
A growing number of large self-insured employers have moved toward independent “transparent” PBMs — organizations like Capital Rx, Navitus Health Solutions, and SmithRx — that operate on pure administrative-fee models with 100 percent rebate pass-through and no affiliated specialty pharmacy. Others have moved toward “carve-out” models in which specialty pharmacy is administered separately from the PBM, allowing the plan to competitively bid the specialty formulary independently.
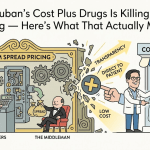
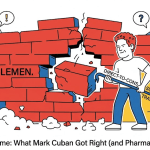
The most aggressive approach is direct employer-manufacturer contracting, which bypasses the PBM entirely for specific high-cost drugs. Mark Cuban’s Cost Plus Drugs, though primarily a retail pharmacy model, demonstrated that direct-to-consumer generic drug pricing without PBM intermediation could dramatically undercut traditional retail pricing. Employer versions of this model — where self-insured plans contract directly with drug manufacturers, or with wholesalers, to obtain drugs at cost plus a fixed margin — are now being piloted by a handful of large, sophisticated employers and health systems.
Walmart’s 2019 move to become the first major retailer to offer generic drugs at $4 per prescription under its own retail program was an early example of what happens when a large buyer with purchasing scale decides to bypass traditional distribution models. More recent employer initiatives in specialty pharmacy — including direct contracting arrangements for specific biologics like adalimumab (Humira) — show that the principle can be extended to the highest-cost category of drugs.
Therapeutic Interchange: Saving Money Without Changing Benefits
What Therapeutic Interchange Is — and What It Is Not
Therapeutic interchange is the practice of dispensing a therapeutically equivalent drug in place of the prescribed drug. It is distinct from generic substitution, which replaces a brand drug with its bioequivalent generic. Therapeutic interchange involves substituting a drug with the same clinical effect but a different molecular entity.
Done well, therapeutic interchange is invisible to the patient and transparent to the prescriber. Done poorly, it creates prescriber friction, patient confusion, and occasionally clinical problems. The clinical evidence on therapeutic interchange in well-managed programs is overwhelmingly positive for most drug classes — the differences in efficacy and tolerability within therapeutic classes (statins, ACE inhibitors, beta blockers, proton pump inhibitors, SSRIs) are generally small or nonexistent for most patients.
Done without clinical governance, therapeutic interchange is a cost-shifting exercise dressed up as clinical management. Formularies that force patients to higher cost-share drugs simply to capture lower plan costs are not therapeutic interchange — they’re adverse financial incentives wearing clinical clothing. The distinction matters legally, clinically, and ethically.
True therapeutic interchange is a pharmacist-physician collaborative process. It requires: a clinical equivalence determination by a pharmacy and therapeutics (P&T) committee, a defined protocol for how and when substitution occurs, transparent communication to prescribers and patients, an appeals mechanism for patients with documented clinical reasons to remain on the originally prescribed drug, and outcomes monitoring to confirm that clinical equivalence is maintained in practice.
Where Therapeutic Interchange Delivers the Best Returns
The drug classes where therapeutic interchange programs have delivered the best ROI for employers and health plans share certain characteristics: large numbers of clinically similar agents, significant price variation within the class, and robust clinical evidence demonstrating class-level rather than agent-level efficacy for most indications.
Proton pump inhibitors are the classic example. Omeprazole, esomeprazole, pantoprazole, lansoprazole, and rabeprazole are all members of the same drug class. For the vast majority of patients with GERD, peptic ulcer disease, or H. pylori eradication regimens, they are clinically interchangeable. Omeprazole’s generic is available for $10 to $15 per month. Esomeprazole (Nexium) brand still commands $200 or more per month without insurance. Therapeutic interchange protocols that move patients from brand esomeprazole to generic omeprazole — or even to generic esomeprazole, which is now widely available — generate immediate, substantial savings with essentially zero clinical downside for the majority of patients.
The statin class is another high-yield target. Rosuvastatin (Crestor) brand lost its core patent in 2016 and generic rosuvastatin is now widely available, but some plans are still paying brand statin prices for patients on Crestor prescriptions that were never updated after the generic launched. Generic atorvastatin, simvastatin, pravastatin, and rosuvastatin are all available at dramatically lower prices than any branded statin. A formulary that places generic statins on Tier 1 and brand statins on Tier 3 or Tier 4 effectively accomplishes therapeutic interchange through financial incentives rather than pharmacist substitution.
Diabetes medications are a more complex category because the clinical differences between agents are more clinically meaningful — particularly in patients with cardiovascular disease, where SGLT2 inhibitors and GLP-1 agonists have documented cardiovascular and renal outcomes benefits that older agents lack. But even within the GLP-1 class, there is price variation (and now biosimilar competition beginning to emerge) that creates interchange opportunities.
Specialty biologics used in inflammatory conditions (rheumatoid arthritis, psoriasis, inflammatory bowel disease) are the highest-return therapeutic interchange target, and also the most clinically complex. TNF inhibitors — adalimumab, etanercept, infliximab — are the drugs most commonly used in these conditions, and all three have biosimilars. Switching patients who are stable on a brand TNF inhibitor to a biosimilar equivalent, or managing new-start patients to the lowest-cost TNF inhibitor biosimilar available, can save $10,000 to $30,000 per patient per year with no expected clinical difference in outcomes.
Managing Prescriber Relations During Interchange Programs
The biggest practical barrier to therapeutic interchange is prescriber resistance. Physicians tend to prescribe what they know, what their EMR defaults to, and what their patients ask for by name. Brand advertising to patients and samples distributed to physicians have historically aligned prescriber behavior with brand preferences, and those preferences are sticky.
The most effective prescriber engagement strategies combine data, education, and relationship. Data-driven outreach — showing a prescriber their prescribing patterns compared to peers, and the cost implications for their patients — is more persuasive than formulary mandates. Education on the clinical evidence for interchange, delivered by clinical pharmacists or medical directors who have credibility with the physician audience, is more effective than administrative notices.
Formulary design can do a significant amount of work without requiring direct prescriber intervention. Prior authorization requirements for high-cost brand drugs when a generic or lower-cost alternative exists create prescriber awareness of the formulary preference without requiring proactive communication. EMR-integrated formulary alerts that flag when a prescribed drug has a lower-cost alternative on the plan’s formulary at the point of prescribing are among the highest-ROI technology investments available to a formulary management program.
Reference Pricing: Using Market Benchmarks to Set Drug Costs
What Reference Pricing Means in the U.S. Pharmacy Context
Reference pricing, as used in European drug reimbursement systems, means setting the price the public health system will pay for a drug based on a reference — typically the price in another country, or the price of the lowest-cost drug in a therapeutic class. Germany, France, and Australia all use versions of this model. The United States has historically resisted formal reference pricing at the federal level, though the Inflation Reduction Act’s negotiation provisions for Medicare represent a partial move in this direction.
For commercial payers and self-insured employers, reference pricing in a pharmaceutical context typically means one of two things: external reference pricing (benchmarking drug costs against international prices or against a standard index such as AWP minus a defined discount) or internal reference pricing (setting the plan’s maximum covered amount for a therapeutic class based on the cost of the lowest-cost agent in the class, with patients responsible for any difference).
Internal reference pricing for pharmaceuticals works most cleanly in classes where true therapeutic equivalence is well established. The University of California’s employee health plan pioneered reference pricing for medical procedures in 2011 and later extended the concept to pharmaceuticals, capping coverage for therapeutic classes at the cost of the lowest-cost equivalent in the class. The result, documented in JAMA Internal Medicine and Health Affairs, was a meaningful shift in utilization toward lower-cost agents with no documented deterioration in clinical outcomes.
International Reference Pricing and the IRA’s Medicare Negotiation Model
The Inflation Reduction Act, signed in August 2022, gave Medicare the authority to negotiate drug prices directly with manufacturers for a defined set of high-expenditure drugs. The first ten drugs selected for negotiation were announced in 2023, including Eliquis, Xarelto, Jardiance, Januvia, Farxiga, Entresto, Enbrel, Imbruvica, Stelara, and NovoLog — together accounting for billions of dollars in annual Medicare Part D spending.
The negotiated prices, announced in August 2024, represented discounts of 38 to 79 percent off the list prices of the selected drugs. The discounts were largest for insulin and smallest for cancer drugs, but the negotiated prices were, in every case, substantially below what Medicare had been paying under the pre-IRA reimbursement system.
For commercial payers, these negotiated prices have immediate strategic significance. They establish a public benchmark for what these drugs can be purchased for when the buyer has sufficient leverage. They expose the magnitude of the gap between U.S. commercial pricing and government-negotiated pricing. And they create political pressure for commercial payers to demand similar treatment — both directly and through the contracting leverage that comes from being able to reference a publicly available negotiated price in negotiations with manufacturers.
The international reference pricing context is even more starkly illustrative. The RAND Corporation’s 2021 analysis of pharmaceutical pricing across 32 OECD countries found that U.S. drug prices were, on average, 2.56 times higher than prices in 32 comparator countries. For brand-name drugs specifically, the ratio was even more extreme — U.S. prices averaged 3.44 times the international comparator. The implication is that drugs purchased by plan sponsors in the United States are, on average, 244 percent more expensive than the same drugs in comparable developed economies.
Employer coalitions and large health systems have begun exploring import arrangements under the FDA’s personal importation policy and, more significantly, state bulk importation programs under Section 804 of the Federal Food, Drug, and Cosmetic Act. Florida received the first FDA authorization for a state importation program in 2023. The program, which imports drugs from Canada, is narrow in scope and applies only to a limited set of drugs, but it represents the first step toward systematic international reference pricing in commercial drug procurement.
Specialty Pharmacy Management: Where the Real Money Is
Why Specialty Pharmacy Deserves Its Own Strategic Framework
Specialty pharmacy drugs — broadly defined as complex drugs that require special handling, administration, or monitoring — represent approximately 2 to 3 percent of prescriptions dispensed in the United States but 50 to 55 percent of total pharmaceutical expenditure for most commercial health plans. The absolute numbers are staggering. The average self-insured employer plan now spends more on specialty pharmacy alone than it spent on all pharmaceuticals combined a decade ago.
The reasons for this concentration are structural. Specialty drugs treat chronic, high-severity conditions — cancer, inflammatory diseases, HIV, hepatitis C, rare genetic conditions, multiple sclerosis — where the cost of treatment is high and the clinical consequences of inadequate treatment are severe. The manufacturers of specialty drugs face a different kind of formulary negotiation than manufacturers of primary care drugs, because health plans and employers face intense pressure not to restrict access to oncology drugs or to treatments for rare diseases with no alternatives.
Managing specialty pharmacy spend requires a different playbook than managing traditional pharmacy spend. The standard tools — generic substitution, therapeutic interchange within broad therapeutic classes — have limited applicability in conditions where the patient is on a drug with no direct equivalent. The relevant tools are: site-of-care optimization, specialty pharmacy contracting, biosimilar substitution within the small number of specialty classes that have biosimilar competition, and utilization management programs that ensure drugs are being used for their approved (and evidence-based) indications.
Site-of-Care: The Biggest Single Lever in Specialty Pharmacy
Many specialty drugs can be administered in two settings: the hospital outpatient department (HOD) and the physician’s office or infusion center (the professional or ambulatory setting). From a clinical standpoint, for most drugs and most patients, the site of administration makes no difference to outcomes. From a cost standpoint, the difference is enormous.
Hospital outpatient departments are reimbursed for specialty drug administration under the facility fee structure, which allows them to charge substantially more than a physician office or independent infusion center for the same drug and the same administration service. Multiple studies have documented price differentials of 50 to 100 percent or more between HOD and professional setting administration for infused specialty drugs.
The RAND Corporation’s analysis of claims data from large employer plans found that the average plan could save 28 to 33 percent on its infused specialty drug costs by implementing a site-of-care management program that directed patients from hospital outpatient settings to lower-cost ambulatory alternatives. On a plan with $5 million in infused specialty drug spend, that is a potential savings of $1.4 to $1.65 million annually with no change in the drugs covered or the clinical protocols governing their use.
Implementing site-of-care management requires network design changes (ensuring the plan’s network includes competitive independent infusion centers in each market), benefit design changes (applying differential cost-share for HOD versus ambulatory administration of the same drug), and member and prescriber communication (explaining that the plan covers the same drug in a lower-cost, clinically equivalent setting). It also requires attention to exceptions — patients with genuine medical complexity who require HOD administration due to clinical need should be accommodated through a defined prior authorization exception process.
Rare Disease and Orphan Drug Spend: The Hardest Category to Manage
Orphan drugs — drugs approved under the Orphan Drug Act for conditions affecting fewer than 200,000 Americans — have become a significant and rapidly growing cost center for employer plans. The FDA granted 65 orphan drug designations in 2023, and the pipeline of gene therapies and other rare disease treatments represents the most rapid cost escalation on the horizon for any plan.
The average cost of an orphan drug is now over $200,000 per year. Gene therapies approved in the last five years carry price tags of $2 million to $3.5 million per patient — and while these are often claimed to be one-time cures (and many are genuinely transformative), the actuarial exposure to a single claim of this magnitude can be devastating for a small or mid-size self-insured plan.
Stop-loss insurance — also called reinsurance — is the primary risk-management tool for this exposure. A stop-loss contract establishes a specific attachment point (the per-claim threshold above which the stop-loss carrier pays) and an aggregate attachment point (the threshold for total claims across the plan). Managing the specific attachment point appropriately for the plan’s risk tolerance, and ensuring that gene therapy and specialty pharmacy costs are covered without exclusion under the stop-loss contract, is a critical component of specialty pharmacy cost management.
Beyond stop-loss, a growing number of benefit consultants and specialty pharmacy vendors are offering outcomes-based warranty programs for certain high-cost treatments — arrangements in which the manufacturer refunds some or all of the treatment cost if a patient does not achieve a defined clinical outcome. These are not panaceas, and their administrative complexity is considerable, but for treatments with genuinely uncertain real-world efficacy, an outcomes-based contract shifts at least some of the financial risk back to the manufacturer.
Direct Primary Care and Integrated Pharmacy Models
How Direct Primary Care Reduces Prescription Costs
Direct Primary Care (DPC) is a membership-based primary care model in which patients (or their employers) pay a monthly fee directly to a primary care physician for a defined scope of primary care services, bypassing traditional fee-for-service billing. The average DPC membership fee runs from $50 to $100 per member per month for working-age adults.
The connection to pharmaceutical costs is underappreciated. DPC practices have several structural advantages in medication management that traditional fee-for-service practices lack.
First, DPC physicians have time — the DPC model typically limits patient panels to 600 to 800 patients versus 2,000 or more in fee-for-service practice. With smaller panels, DPC physicians spend more time per patient, which translates to more thorough medication reviews, more proactive management of polypharmacy, and more attention to therapeutic substitution opportunities.
Second, DPC practices often maintain an in-office dispensary of generic and commonly prescribed drugs, purchased directly from drug wholesalers at wholesale acquisition cost. The DPC physician can prescribe and dispense a 90-day supply of generic metformin, lisinopril, atorvastatin, or amlodipine for $10 to $15, bypassing the PBM and retail pharmacy entirely. For employees on multiple chronic-condition medications, the savings from DPC-dispensed generics can offset a significant portion of the DPC membership fee.
Third, DPC practices that have adopted formulary intelligence tools and drug pricing databases can identify, in real time, the lowest-cost retail or mail-order price for any prescription — including cash prices at discount programs like GoodRx, Cost Plus Drugs, or BidRx — and route the prescription accordingly. Patients on high-cost brand drugs that have gone generic often have no idea that a substantially lower-cost generic exists, and the traditional prescription routing system through PBMs and retail pharmacies has no structural incentive to inform them.
Value-Based Insurance Design: Aligning Cost-Share With Clinical Need
Value-Based Insurance Design (VBID) is a benefits architecture that adjusts patient cost-share based on the clinical value of the drug, rather than uniformly applying cost-share based on drug tier. The principle, developed by health economist A. Mark Fendrick at the University of Michigan, is that cost-sharing reduces utilization for both high-value and low-value services — and that the optimal benefit design would reduce cost-sharing for high-value services while increasing it for low-value ones.
In pharmaceutical benefit design, VBID most commonly takes the form of eliminating or reducing cost-share for high-value medications in patients with specific chronic conditions. Multiple rigorous studies have shown that even modest reductions in patient out-of-pocket costs for medications like statins, ACE inhibitors, beta blockers, and antidiabetic drugs in patients with established cardiovascular disease or diabetes substantially improve medication adherence — which in turn reduces hospitalizations, emergency department visits, and disease complications that are far more expensive than the drugs themselves.
The Pitney Bowes VBID program, one of the earliest and most studied employer implementations, found that removing all cost-sharing for medications managing cardiovascular risk factors reduced hospitalizations among that population significantly, generating a net savings for the plan despite the lost cost-share revenue. The Harvard Pilgrim VBID pilot, published in Health Affairs, showed similar results in a health plan population.
VBID also works in the opposite direction. Increasing cost-share for drugs with limited clinical evidence of added benefit — brand drugs with generic equivalents, drugs used for off-label indications with poor evidence bases — reduces utilization of those drugs with minimal clinical downside. The combination of lower cost-share for high-value drugs and higher cost-share for low-value ones optimizes the benefit structure for both clinical outcomes and total cost.
The Inflation Reduction Act: What It Changes for Employers
Medicare Negotiation and Its Commercial Market Ripple Effects
The IRA’s drug price negotiation provisions apply only to Medicare, not to commercial insurance. This limitation has led many employer benefits professionals to conclude that the IRA is irrelevant to their cost strategy. That conclusion is wrong.
The IRA creates several commercial market effects that are already materializing.
The first and most immediate effect is a pricing transparency benchmark. When the Centers for Medicare and Medicaid Services (CMS) announces a negotiated price for Eliquis of $295.02 per 30-day supply (compared to the pre-negotiation list price of approximately $590), that publicly disclosed negotiated price becomes a reference point for commercial contract negotiations. An employer or health plan that can demonstrate to a manufacturer that Medicare is paying $295 for a drug and demands comparable treatment has a fundamentally different negotiating posture than one operating without that benchmark.
The second effect is the IRA’s out-of-pocket cap and catastrophic coverage reforms in Medicare Part D, which reduce the financial catastrophe risk for Medicare beneficiaries on high-cost specialty drugs. For dual-eligible individuals and others who move between Medicare and commercial coverage, these changes affect plan behavior, manufacturer pricing strategies, and the political economy of drug price regulation in ways that will have downstream commercial implications.
The third effect is the IRA’s provisions on inflation rebates — manufacturers who increase Medicare drug prices faster than inflation must pay rebates to the federal government. This provision has already influenced brand manufacturer pricing strategies in the commercial market, where several companies have moderated their annual list price increases in anticipation of broader application of inflation penalty mechanisms.
The Small Molecule Drug Exclusion and its Strategic Implications
The IRA’s negotiation provisions apply, in the initial phase, primarily to small-molecule drugs with significant Medicare Part D or Part B spend. Biologics are subject to negotiation on a longer timeline, reflecting the 12-year exclusivity period in the BPCIA.
This creates a significant loophole that several manufacturers are reportedly exploiting: switching from small-molecule to biologic formulations of existing drugs specifically to reset the IRA negotiation clock. The policy community has flagged this as a concern, and it has already influenced how some plan sponsors are thinking about their formulary strategy for drugs in development — specifically, watching for whether a manufacturer with a popular small-molecule drug attempts a “molecule-to-biologic” switch that would delay the drug’s eligibility for Medicare negotiation.
For commercial payers, the small-molecule exemption from IRA negotiation is less critical than the biologic exemption, because the strongest biosimilar competition opportunities (adalimumab, infliximab, etanercept, ustekinumab) are already creating commercial cost savings independent of the IRA. But plan sponsors should monitor congressional efforts to extend IRA negotiation provisions, close the small-molecule loophole, and apply elements of the framework to commercial insurance — all of which have been proposed in various forms.
International Benchmarking and Import Strategies
What American Plans Can Learn From European Procurement Models
The United Kingdom’s National Institute for Health and Care Excellence (NICE) conducts cost-effectiveness analyses for new drugs before approving their coverage in the NHS. The standard threshold — roughly £20,000 to £30,000 per quality-adjusted life year gained — means that drugs with marginal clinical benefits are not covered at brand prices, regardless of what the manufacturer wants to charge.
The German AMNOG system (Arzneimittelmarktordnungsgesetz) requires manufacturers to submit a dossier demonstrating the “added benefit” of a new drug versus the standard of care within three months of launch. If the added benefit is not demonstrated to the satisfaction of an independent assessment body, the drug is assigned to a reference price group and covered only at the reference price, regardless of the manufacturer’s launch price.
American commercial payers are not NICE or AMNOG. They don’t set national price controls, and they face legal and institutional constraints that European health systems do not. But the analytical frameworks — cost-effectiveness analysis, comparative effectiveness research, added benefit assessment — are available to plan sponsors, and the most sophisticated health systems and large employer plans are already applying versions of these frameworks to formulary decision-making.
The Institute for Clinical and Economic Review (ICER) publishes independent cost-effectiveness analyses of new drugs in the United States, comparing the clinical value of new treatments against existing alternatives and estimating “value-based prices” — the price at which a drug would be cost-effective at standard thresholds. ICER analyses don’t carry regulatory force, but they provide a credible independent benchmark that formulary committees can use in negotiations with manufacturers and in benefit design decisions.
Several manufacturers have incorporated ICER recommendations into their U.S. launch pricing strategies, in part because payers have made clear that ICER assessments will influence formulary tier placement. This is not the European managed entry model, but it is a meaningful step toward value-based pricing.
State Importation Programs and the Path Forward
Florida’s FDA-authorized importation program, launched in 2024, imports a specific list of drugs from Health Canada-regulated facilities in Canada. The program covers drugs used to treat conditions including HIV, psychiatric disorders, diabetes, and inflammatory disease — drugs where the price differential between Canada and the United States is well documented and large.
The savings potential is substantial. A 2022 analysis by the Florida Office of Drug Importation estimated that drugs in the state’s importation program would save an average of 50 to 90 percent compared to U.S. wholesale acquisition cost. While the program’s current scope is limited to Medicaid and state agency purchases, the legal and logistical infrastructure it creates could be extended to commercial plans if Congress amends the current statutory framework to authorize broader commercial importation.
Colorado, Vermont, New Hampshire, and New Mexico have all passed legislation authorizing the development of importation programs. The FDA’s willingness to approve Florida’s program established the regulatory precedent. The expansion of state importation to commercial health plans would represent a structural change in the U.S. pharmaceutical pricing environment — one that sophisticated plan sponsors should be positioning for now, both by engaging in relevant state policy discussions and by building the contracting and compliance infrastructure that commercial importation would require.
Point-of-Sale Rebate Reform: Getting the Discount Where It Belongs
Why List Price Rebates Harm Patients and How to Fix It
The standard rebate model in U.S. pharmaceutical benefit design creates a perverse dynamic for patients with high-deductible health plans or cost-sharing arrangements based on list price. Under the traditional model, a manufacturer sells a drug to a PBM or wholesaler at (or near) the Wholesale Acquisition Cost (WAC). The PBM then negotiates a rebate with the manufacturer, paid retrospectively after the quarter or year ends. The patient pays their cost-share — typically a percentage of the drug’s list price — at the pharmacy counter, without the benefit of the rebate that the plan will later receive.
For a patient on a $500-per-month brand drug with a 20 percent cost-share, this means paying $100 per month out of pocket, even if the plan’s net cost after rebate is only $250. The patient’s effective cost-share is not 20 percent of net cost ($50) but 40 percent of net cost — because the rebate doesn’t flow through to the patient’s cost calculation.
This architecture has been defended by PBMs and plan sponsors on the basis that rebate pass-through at point of sale is administratively complex and creates different formulary incentive structures. The Trump administration’s HHS proposed a rule in 2019 that would have required rebate pass-through at point of sale for Medicare Part D; the rule was ultimately withdrawn, but not before stimulating significant industry debate about the feasibility of the model.
Point-of-sale rebate programs — in which the PBM and plan agree to pass through rebate amounts as discounts applied at the pharmacy counter when patients fill their prescriptions — are technically feasible and commercially available. Several PBMs now offer this structure. For patients with deductibles or coinsurance, point-of-sale rebates reduce out-of-pocket costs meaningfully, which improves medication adherence and reduces downstream utilization costs.
For plan sponsors, the decision to implement point-of-sale rebates involves a tradeoff: patients pay less at the counter, which reduces plan revenue from cost-sharing, but improved adherence reduces hospitalizations and other downstream costs. The clinical literature suggests that for patients on chronic disease medications with well-documented adherence effects — statins, antihypertensives, antidiabetics — the downstream cost savings from improved adherence likely exceed the lost cost-share revenue.
Building an Internal Pharmacy Cost Intelligence Capability
The Data Infrastructure Required for Systematic Cost Management
Most employer plans and health plans lack the internal data infrastructure required for systematic pharmaceutical cost management. Their pharmacy cost data lives in PBM reports formatted for opaque consumption, disconnected from medical claims data that would allow total cost-of-care analysis, and updated on quarterly cycles that make real-time intervention impossible.
Building a meaningful pharmacy cost intelligence capability requires four components.
The first is integrated data access. Drug spend data needs to be integrated with medical claims data so that total cost of care — including the downstream medical costs of pharmaceutical interventions or failures — can be assessed at the individual patient and therapeutic category level. Plans that only look at pharmacy costs in isolation systematically underinvest in high-value drug therapy that prevents expensive medical utilization.
The second is patent and competitive intelligence feeds. Understanding the current and forward patent landscape for the plan’s top-spend drugs requires ongoing monitoring of FDA approval actions, ANDA filings, Paragraph IV litigation outcomes, biosimilar approval decisions, and patent expiry calendars. Resources like DrugPatentWatch provide this monitoring infrastructure, allowing formulary teams to track competitive developments on a continuous basis rather than relying on periodic consultant reports.
The third is formulary analytics — the ability to model the impact of proposed formulary changes on total plan cost, patient out-of-pocket cost, and clinical outcomes metrics before implementation. Formulary modeling requires drug utilization data, price data, clinical equivalence data, and patient-level cost sensitivity analysis (because the impact of a formulary change varies substantially depending on how patients in the plan are distributed across deductible, cost-sharing, and out-of-pocket maximum thresholds).
The fourth is market pricing intelligence — access to real-time pricing data for drugs across channels, including AWP, WAC, 340B pricing, Medicare negotiated prices, and market transaction prices. A formulary analyst who can see that a drug is available at substantially different prices in different channels or procurement mechanisms has the information needed to identify whether the plan’s current purchasing arrangement is cost-competitive.
Using DrugPatentWatch for Formulary Intelligence
For benefit analysts, formulary managers, and pharmacy directors building out their patent and competitive intelligence capability, DrugPatentWatch is one of the primary structured resources for pharmaceutical patent data. The platform tracks patent expiry dates, ANDA filings and approval status, Paragraph IV certification history, litigation outcomes, first-filer exclusivity status, FDA approval actions, and biosimilar applicant information for the full universe of FDA-regulated drug products.
The practical application for a formulary team is systematic. You can use DrugPatentWatch to identify which of your top-spend brand drugs are within 24 months of a patent expiry with active generic filers — creating a list of near-term cost reduction opportunities. You can track ongoing Paragraph IV litigation to monitor whether a patent defending a high-cost brand drug is likely to be invalidated ahead of its scheduled expiry. You can identify drugs where multiple ANDA filers are positioned for competitive generic entry — which predicts rapid post-entry price deflation — versus drugs where a single first-filer exclusivity holder will control the generic market for six months.
The intelligence also supports PBM contract negotiations. A plan sponsor who knows — from DrugPatentWatch data — that a specific brand drug’s core patent is being challenged by multiple generic manufacturers in active Paragraph IV litigation can use that information in rebate negotiations with the manufacturer: current rebate levels reflect a monopoly position that may not persist, and the plan sponsor’s willingness to maintain preferred formulary placement for the brand product should be priced accordingly.
Employee Communication: Making Cost Savings Stick
Why Most Formulary Communication Fails
The gap between what a formulary is designed to achieve and what it actually achieves is often a communication gap. A formulary that places generic statins on Tier 1 and brand statins on Tier 3 will only generate savings if patients and prescribers know about the tier structure and respond to the cost incentives. A step therapy protocol that requires a generic antidepressant trial before a brand antidepressant is covered generates savings only if prescribers understand the protocol and write the appropriate initial prescription.
Most formulary communication fails because it is written for plan administrators, not for patients. Benefits communications written in regulatory language, buried in summary plan documents, or delivered once annually at open enrollment do not create the real-time decision support that drives behavior change.
Effective formulary communication is personalized, timely, and action-oriented. The most effective point of communication is at the pharmacy counter or at the physician visit — the moment when a prescribing or filling decision is being made. EMR-integrated formulary alerts that fire at the point of prescribing reach the physician at the decision moment. Pharmacy-level counseling by pharmacists trained to discuss cost-effective alternatives reaches patients at the filling moment. Mobile benefit apps that allow patients to search drug costs and find alternatives reach patients before the prescribing encounter.
Transparency Tools and Their Role in Drug Cost Reduction
A growing number of technology platforms — GoodRx, Cost Plus Drugs, RxSaver, NeedyMeds — provide patients with real-time drug price information across pharmacies and programs. The existence of these tools has fundamentally changed the information environment for drug purchasing: a patient who knows that their $150 copay for a generic drug at the retail pharmacy can be replaced by a $12 cash price at a discount program has the information needed to make a rational purchasing decision.
For plan sponsors, the relevant question is whether to integrate these tools into the benefit design or leave them as external resources that employees discover independently. Several large employers have embedded drug cost transparency tools into their benefits portals, allowing employees to search any drug and see the plan’s covered cost, the cash price at major discount programs, and the cost of therapeutic alternatives that might serve the same clinical purpose at lower cost.
The clinical and ethical boundaries of drug cost transparency matter here. Transparency tools should inform patients, not coerce them. A patient who is clinically stable on a specific drug and cannot tolerate alternatives should not be pushed toward a lower-cost substitute by a cost transparency tool that frames the clinical decision as primarily a financial one. The tool’s role is to provide information; the clinical decision remains with the patient and prescriber.
Long-Term Strategic Positioning: What the Next Five Years Look Like
GLP-1 Drugs, Gene Therapy, and the Next Wave of Specialty Cost Escalation
The pharmaceutical cost management landscape over the next five years will be dominated by two categories of drugs that are already reshaping employer benefit budgets: GLP-1 agonists for obesity and cardiometabolic conditions, and gene therapies for rare and ultra-rare genetic diseases.
GLP-1 drugs — semaglutide (Ozempic, Wegovy), tirzepatide (Mounjaro, Zepbound), and their competitors — have demonstrated clinical efficacy for weight loss, type 2 diabetes management, and cardiovascular risk reduction that is genuinely transformative. The clinical case for coverage is strong. The cost case is challenging: semaglutide for obesity (Wegovy) carries a list price of approximately $16,000 per year, and utilization for obesity treatment is, by definition, potentially very high in any employed population.
The GLP-1 coverage decision is fundamentally a population health actuarial problem, not just a formulary problem. An employer covering GLP-1 drugs for obesity needs to model the downstream medical cost savings from weight loss (reduced cardiovascular events, reduced joint replacement surgeries, improved diabetes management, reduced sleep apnea complications) against the drug cost, and understand that those downstream savings typically accrue over a 3 to 5 year or longer horizon. For self-insured employers with high annual member turnover, this actuarial math may not work — the savings accrue to whoever covers the member in future years, not necessarily to the employer making the current investment.
For the employers where the math does work — large self-insured plans with low turnover, union trust funds with stable long-term populations, or Medicare Advantage plans with predictable multi-year member retention — the strategic question is how to structure GLP-1 coverage to maximize clinical efficacy while managing cost. This means: clinical eligibility criteria that target coverage to members with the highest likelihood of clinical benefit and adherence; integration with behavioral health and lifestyle support programs that improve outcomes; and ongoing monitoring of adherence and outcomes to identify members who should be discontinued from therapy.
Gene therapy cost exposure is a different and more acute risk. A single gene therapy claim — for conditions like spinal muscular atrophy (Zolgensma, $2.1 million per dose), hemophilia B (Hemgenix, $3.5 million per patient), or sickle cell disease (Casgevy, approximately $2.2 million) — can be catastrophic for a self-insured plan without appropriate stop-loss coverage. Stop-loss insurers are actively revising their underwriting criteria and attachment points in response to gene therapy approvals, and employers should be in active dialogue with their stop-loss carriers about gene therapy exposure.
The Coming Biosimilar Wave: Drugs to Watch
The biosimilar pipeline is among the most actionable near-term cost management opportunities for commercial payers. Several major biologics face biosimilar competition that will materialize within the 2024 to 2027 window.
Ustekinumab (Stelara), the IL-12/23 inhibitor used for psoriasis, psoriatic arthritis, and inflammatory bowel disease, saw biosimilar approvals beginning in 2023 with competitive launches from Amgen, Fresenius Kabi, and others in 2025. Stelara’s list price was approximately $90,000 per year, and biosimilar competition is expected to drive the net cost down dramatically for plans that actively manage to biosimilar formulary placement.
Denosumab (Prolia/Xgeva), the RANKL inhibitor used for osteoporosis and cancer-related bone complications, has biosimilars entering the U.S. market after a complex patent thicket dispute. Given the large number of patients on Prolia specifically — a quarterly injection that is among the most widely used specialty injectables in rheumatology and endocrinology — biosimilar competition in this class represents a significant savings opportunity.
Pembrolizumab (Keytruda), the anti-PD-1 checkpoint inhibitor that is one of the highest-revenue drugs in the world, will face patent expiry beginning around 2028 to 2030. Biosimilar applications are already in development. For plans with significant oncology populations, the eventual arrival of pembrolizumab biosimilars will represent one of the largest single savings events in pharmaceutical history.
Tracking the development timelines, patent statuses, and litigation landscapes for these forthcoming biosimilars — using patent intelligence tools and FDA approval monitoring — allows formulary teams to begin preparing their contracting strategies, benefit design changes, and prescriber communication plans well in advance of the competitive launches.
Putting It All Together: A 90-Day Action Plan
Week One Through Week Four: Baseline Analysis
The first month of a pharmaceutical cost reduction initiative should be entirely diagnostic. The output of month one is a clear, data-based picture of where the money is going and where the largest opportunities exist.
Pull your plan’s pharmacy claims data for the trailing 12 months. Sort by total plan expenditure — not by utilization — and identify the top 50 drugs. For each of those 50 drugs, you want: current plan spend, current net cost per claim (after rebates if available), patient utilization count, therapeutic category, current formulary tier, and availability of generic or biosimilar alternatives.
Cross-reference the top 50 against a patent expiry and competitive intelligence analysis. For each drug, you want: the primary patent expiry date, the status of any Paragraph IV challenges, the number of ANDA or biosimilar filers, and the estimated realistic competitive entry timeline. This analysis will typically reveal a subset of three to eight drugs where generic or biosimilar competition is imminent and where a formulary intervention can generate measurable savings within 12 to 24 months.
Audit your PBM contract against current claims data. This requires either an in-house pharmacy analyst with PBM contracting expertise or an independent PBM auditor. At minimum, verify whether your contract is genuinely pass-through for both generic spread and specialty rebates, and whether the contract terms you negotiated are being executed as represented.
Assess your specialty pharmacy management program. What percentage of your specialty drug spend is going through the PBM’s affiliated specialty pharmacy? What site-of-care protocols, if any, are in place for infused specialty drugs? Are there biosimilar formulary management policies for the therapeutic categories where biosimilars exist?
Month Two and Month Three: Priority Interventions
Armed with the baseline analysis, identify your highest-priority interventions — those with the largest potential savings, the highest probability of success, and the shortest time to impact.
For most plans, the priority intervention list will include at least two of these four actions: a biosimilar formulary change for adalimumab (if not already done — adalimumab biosimilars launched in 2023 and plans that haven’t moved to biosimilar formulary preference by now are leaving substantial savings on the table); a site-of-care management program for infused specialty drugs; a generic substitution protocol for one or two specific high-spend brand drugs with available generics; and a PBM contract renegotiation or audit.
Each of these interventions requires a different implementation pathway. Formulary changes require P&T committee approval, benefit plan amendment, member and prescriber communication, and a defined effective date. Site-of-care changes require network expansion (adding independent infusion centers), benefit design revision (creating site-of-care differential cost-share), and member communication. PBM contract renegotiation requires legal support, benchmarking data, and negotiating leverage — which is most effectively assembled in the context of a contract renewal or a competitive bid process.
Build a governance structure that will sustain these interventions after the initial 90-day sprint. The most common failure mode for pharmacy cost management initiatives is the absence of ongoing accountability: the initial analysis creates momentum, a few interventions get implemented, and then the program loses organizational attention as other priorities intrude. A standing pharmacy cost management committee — meeting quarterly, with access to updated claims and financial data, and with explicit accountability for a defined cost reduction target — is the structural solution to this failure mode.
Key Takeaways
Drug pricing in the United States is fundamentally an information asymmetry problem. Manufacturers, PBMs, and specialty pharmacies have more data than plan sponsors and employers, and they use that advantage strategically. Closing that information gap is the first step in any serious cost reduction program.
Patent intelligence is operational intelligence for benefits managers. Knowing which drugs face imminent generic or biosimilar competition — and which ones are protected by patent thickets that will maintain brand pricing for years — directly informs formulary design, rebate negotiations, and coverage policy. Tools like DrugPatentWatch make this intelligence accessible without requiring a legal team.
Biosimilar savings are real but not automatic. The formulary and benefit design must actively direct utilization toward biosimilars. Passive biosimilar coverage at parity with the brand — same tier, same cost-share, no step therapy — does not generate meaningful savings.
PBM contract structure is as important as the rebate rate. A high rebate rate on a spread-pricing contract may generate less net value for the plan than a lower rebate rate on a genuinely transparent pass-through contract. Independent audits are the only reliable way to verify performance.
Site-of-care optimization for infused specialty drugs is among the most underutilized savings levers available to employer plans. The price differential between hospital outpatient and ambulatory infusion settings is large, well-documented, and clinically defensible to address.
The IRA’s Medicare negotiation provisions create commercial pricing benchmarks that sophisticated plan sponsors can use in their own negotiations. The negotiated Medicare prices are public. Use them.
GLP-1 drugs and gene therapies represent the next major cost challenges. Planning for their actuarial and clinical implications now — before utilization escalates — is far more effective than reactive benefit design changes after the budget impact materializes.
Frequently Asked Questions
Q: How do I know if my PBM is actually passing through 100 percent of manufacturer rebates?
A: The only way to verify this reliably is through an independent audit of your PBM’s rebate accounting against the underlying manufacturer agreements. Contractual representations of pass-through often contain definitional carve-outs — administrative fees classified as rebate offsets, performance payments routed through subsidiary entities, or specialty drug categories excluded from pass-through definitions. An independent PBM audit firm with forensic claims access can reconcile what your PBM reported in rebate payments against the actual manufacturer payments. Many employers who conduct these audits for the first time discover discrepancies ranging from modest to substantial.
Q: What is the clinical risk of moving employees from a brand biologic to a biosimilar?
A: For most biosimilars approved by the FDA, the clinical risk of switching from the reference product is low, based on both pre-approval clinical data and real-world evidence from European markets where biosimilar switching has been practiced for 15 or more years. The FDA’s interchangeability designation provides the highest standard of confidence for pharmacist-level substitution. For patients who are stable on a brand biologic, “non-medical switching” to a biosimilar is a reasonable formulary policy if it includes a defined exception pathway for patients with documented tolerability or efficacy concerns, and if it is implemented transparently with both prescribers and patients. The clinical literature does not support the common prescriber perception that biosimilar switching inherently risks disease flare or immunogenicity.
Q: If generic drugs are so much cheaper, why does our PBM formulary still include so many brand drugs on preferred tiers?
A: Because brand manufacturers pay rebates and generic manufacturers generally do not. A formulary placement decision under the traditional rebate model is not purely a cost-effectiveness or clinical equivalence decision — it’s a revenue optimization decision for the PBM and, to a lesser extent, the plan. The brand manufacturer pays the PBM for preferred formulary placement in the form of rebates; the generic manufacturer has no incentive to do so because its competitive advantage is already price. Reforming your PBM contract to truly incentivize clinical and cost optimization over rebate maximization — whether through pass-through contracting, fiduciary PBM arrangements, or carving out specific categories for independent management — is the structural solution.
Q: How can a mid-size employer (500 to 2,000 employees) access the same pharmacy cost intelligence that large self-insured plans use?
A: Mid-size employers typically cannot afford the dedicated pharmacy analytics staff and custom data infrastructure that large plans maintain internally. But they can access equivalent intelligence through three channels: joining an employer purchasing coalition that pools negotiating leverage and data analytics capacity across member organizations; retaining an independent pharmacy benefits consultant with access to commercial patent and pricing databases; or using direct pharmacy intelligence tools like DrugPatentWatch independently, which provide patent expiry, ANDA filing, and competitive entry data without requiring large-plan infrastructure. The key is having a defined process for translating that intelligence into formulary action — a quarterly formulary review meeting tied to the plan’s renewal cycle is a practical minimum viable program for a mid-size employer.
Q: What is the biggest mistake employers make when trying to reduce pharmacy costs?
A: Starting with employee cost-sharing rather than with the drug cost itself. Raising deductibles, adding more tiers, and increasing copays for brand drugs are common first responses to rising pharmacy spend — they are politically easy compared to PBM contract reform and visible in the short run. But they shift costs to employees without reducing the underlying pharmaceutical prices the plan is paying. For employees who are on essential medications for chronic conditions, higher cost-sharing reduces adherence — which leads to worse clinical outcomes and, typically, higher total medical costs over 12 to 24 months. The correct sequence is to reduce the underlying drug cost first, through patent intelligence, biosimilar adoption, PBM contract reform, and site-of-care management. Employee cost-sharing should then be calibrated to support adherence for high-value medications and create appropriate signals for lower-value ones — not used as the primary cost containment tool.
Data sources referenced include FDA Orange Book, DrugPatentWatch patent intelligence platform, RAND Corporation pharmaceutical pricing analyses, CMS Medicare negotiated price disclosures, Institute for Clinical and Economic Review (ICER) assessments, and peer-reviewed studies published in JAMA Internal Medicine, Health Affairs, and the New England Journal of Medicine.