1. The Structural Economics of Pharmaceutical Outsourcing
Why Vertical Integration Failed
The pharmaceutical industry did not arrive at its current outsourcing model by accident. For most of the twentieth century, major drug companies operated as closed systems. Discovery, formulation, manufacturing, packaging, and distribution all happened under one corporate roof. The business logic held as long as product pipelines were broad, manufacturing was relatively standardized around small-molecule oral solids, and patent moats were wide enough to protect margins through decades of exclusivity.
That logic collapsed under the weight of three simultaneous pressures.
The capitalized cost of bringing a new molecular entity to market has climbed to approximately $2.6 billion, a figure that absorbs the cost of the nine-out-of-ten candidates that fail before reaching patients. R&D productivity, as measured by new molecular entity approvals per billion dollars spent, has declined for decades. Big Pharma’s internal manufacturing networks, built for a world of blockbuster small molecules, became strategic liabilities when the industry pivoted toward targeted biologics, oncology high-potency APIs (HPAPIs), and gene therapies, each requiring entirely different facility types, containment categories, and scientific skill sets.
By 2024, an estimated 50% of the pharmaceutical industry’s roughly $300 billion annual R&D investment flowed to external partners. That figure represents not a tactical accommodation but a structural reset. The question facing every pharma and biotech company is no longer whether to outsource, but which capabilities to retain internally and which to permanently externalize.
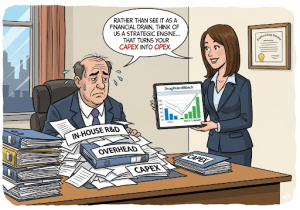
The CapEx-to-OpEx Conversion: Risk Architecture Explained
The financial case for outsourcing rests on one central concept: converting high-risk, large-block capital expenditures into manageable, stage-gated operational expenditures.
A company preparing to manufacture a Phase III candidate in-house must build or retrofit a cGMP facility before knowing whether the drug will gain regulatory approval. A biologics fill-finish suite can cost $200 million to $500 million to construct and validate. If the drug fails, that facility either sits idle or requires expensive repurposing. A CDMO absorbs that risk. The sponsor pays for capacity as needed, scaling volume with clinical progress and terminating contracts on failure without stranded assets on the balance sheet.
This architecture particularly matters for early-stage biotech companies, which collectively hold the majority of the industry’s early-phase pipeline. Most lack the balance sheet to build manufacturing infrastructure. CDMOs are the only viable path for these companies to produce cGMP material for Investigational New Drug applications and first-in-human Phase I studies.
Key Takeaways: Outsourcing Economics
The shift to outsourcing is not reversible. The economics of complex modality manufacturing, combined with the cost of failed in-house asset builds, structurally favor externalization for all but the most capital-intensive vertically integrated manufacturers. Companies that attempt to rebuild comprehensive in-house capability across small molecules, biologics, and advanced therapies simultaneously will face CapEx burdens incompatible with competitive R&D spending. The winning model pairs focused internal discovery and regulatory capability with a carefully managed network of external development and manufacturing partners.
For institutional investors, the durability of CDMO demand rests on the same structural factors that pushed pharma to outsource in the first place. Pipeline complexity is not declining. The share of biologics, gene therapies, and antibody-drug conjugates (ADCs) in late-phase development continues rising, and each of these modalities requires capital-intensive specialized manufacturing that few sponsors will build in-house. A CDMO that can credibly serve two or more of these high-complexity modalities with validated regulatory track records is a defensible asset. Look for revenue concentration risk (over-reliance on a single sponsor or program), facility regulatory history, and management track record in scaling up from clinical to commercial manufacturing as primary screening criteria.
2. API Classification, Manufacturing Architecture, and IP Valuation
The Active Pharmaceutical Ingredient: Definitional Precision
The active pharmaceutical ingredient (API) is the chemically or biologically active substance in a drug product responsible for its therapeutic effect. Excipients, the binders, fillers, coatings, and preservatives that make up the rest of a finished dosage form, carry no therapeutic activity. The API is the compound that interacts with biological targets: enzymes, receptors, ion channels, or nucleic acid sequences.
This distinction is commercially critical because API and excipient supply chains operate under entirely different regulatory and IP frameworks. An excipient supplier operates under USP or Ph. Eur. monograph standards. An API manufacturer operates under drug master file (DMF) requirements, cGMP inspections from the FDA’s Office of Pharmaceutical Quality, and country-specific registration requirements in every market where the finished drug is sold. Confusing these two supplier categories has resulted in costly audit failures and supply chain disruptions for drug developers who underestimated API regulatory complexity.
Small-Molecule APIs: Synthetic Routes, Polymorphism, and IP Strategy
Synthetic Chemical Pathways and the Process IP Layer
Small-molecule APIs, defined by molecular weights below approximately 1,000 daltons, are produced through discrete chemical synthesis reactions. A commercial synthesis route typically involves multiple steps, each producing an intermediate on the path to the final API. Route length matters commercially: a 15-step synthesis exposes the manufacturer to yield losses at each step and creates multiple opportunities for impurity formation, whereas a seven-step route is correspondingly more efficient and robust.
The chemistry also generates a distinct category of intellectual property entirely separate from the compound patent itself: process patents. An originator company holds composition-of-matter patents on the API structure, but the synthetic route to reach that structure is separately patentable. This has major implications for generic API manufacturers. A generic entrant must not only synthesize an API that meets compendial specifications but must do so via a route that does not infringe active process patents. Process patent circumvention is a distinct technical and legal challenge, and failure at this step has blocked otherwise-ready generic programs.
Polymorphism and Solid-State IP: The Evergreening Mechanism
Many small-molecule APIs exist in multiple crystalline forms, known as polymorphs, each with distinct physical properties. Polymorphs differ in melting point, aqueous solubility, hygroscopicity, and physical stability, all of which directly affect bioavailability in the finished dosage form. Regulatory guidance, including ICH Q6A, requires characterization of the solid-state form of an API and specifies acceptable polymorph control limits in manufacturing.
Originator companies routinely file separate patent applications on specific polymorph forms of their APIs, often after the original composition-of-matter patent has already been filed. A new polymorph patent can extend commercial exclusivity by a decade or more beyond the base compound patent. This is one of the most widely used evergreening strategies in the pharmaceutical patent system. AstraZeneca’s use of polymorph patents on omeprazole (the original Prilosec compound) to introduce esomeprazole (Nexium) as a branded successor product is the textbook example, generating approximately $5 billion in annual sales from what critics described as a single-mirror-image molecule repackaging. Whether that constitutes genuine innovation or evergreening depends heavily on who is paying the drug bill.
Generic companies challenging polymorph patents file Paragraph IV certifications with the FDA, asserting that the listed patent is invalid or will not be infringed by the generic product. Successful Paragraph IV challenges on polymorph patents have unlocked multi-billion-dollar generic markets. The 180-day exclusivity period awarded to the first successful filer provides a critical financial incentive for this litigation risk.
IP Valuation: Small-Molecule API Asset Framework
For M&A due diligence or licensing negotiations involving small-molecule API assets, valuation models should incorporate at least four IP-specific variables.
The first is patent estate depth, meaning the number and expiration dates of all patents covering the compound, its listed polymorph forms, its formulations, and its manufacturing processes. A drug protected by a single composition-of-matter patent expiring in 2027 has a fundamentally different risk profile than one protected by a compound patent expiring in 2027 plus polymorph patents running to 2033, a method-of-use patent to 2035, and an FDA-granted pediatric exclusivity period extending exclusivity by six months beyond the base patent expiration.
The second is DMF status. A Type II DMF filed with the FDA establishes the regulatory standing of an API manufacturing site. A DMF with zero outstanding deficiencies and a history of successful FDA inspections has concrete commercial value because it reduces the time and risk for a new drug product client to qualify that API source.
The third is Paragraph IV exposure. If a marketed drug faces active Paragraph IV litigation, any generic entrant winning that case and launching at-risk becomes a material event for the originator’s API supply projections. Patent databases and FDA Orange Book litigation records make this exposure fully visible.
The fourth is raw material and KSM concentration. An API whose key starting material (KSM) comes from a single-source supplier in a geopolitically sensitive region carries supply chain risk that depresses asset valuation even when the patent estate is strong.
Biologic APIs: Large Molecules, Living Systems, and a Different IP Calculus
The Taxonomy of Biologic Modalities
Biologics are therapeutic substances derived from or produced by living organisms. The category is broad enough to encompass monoclonal antibodies with molecular weights around 150 kilodaltons, plasmid DNA vectors measured in megabases, and autologous CAR-T cell therapies that cannot be assigned a single molecular weight at all. Each modality sits in a distinct regulatory and manufacturing universe.
Monoclonal antibodies (mAbs) are produced in Chinese Hamster Ovary (CHO) cell lines or other mammalian expression systems, purified through Protein A affinity chromatography followed by ion exchange steps, and formulated for subcutaneous or intravenous administration. The manufacturing complexity is substantially higher than for small molecules, and batch failures are more common and more expensive.
Oligonucleotide APIs, including antisense oligonucleotides (ASOs), small interfering RNA (siRNA) constructs, and microRNA mimics, are synthesized chemically using solid-phase phosphoramidite chemistry but share none of the biological manufacturing infrastructure used for protein therapeutics. Alnylam’s siRNA platform, anchored by inclisiran and patisiran, represents the commercial proof of concept for this modality, and Alnylam’s manufacturing strategy for its GalNAc-conjugated siRNA compounds has become a case study in API process development for oligonucleotides.
Cell and gene therapies sit at the far end of the complexity spectrum. CAR-T products such as Kymriah (tisagenlecleucel, Novartis) and Yescarta (axicabtagene ciloleucel, Gilead/Kite) involve lentiviral or retroviral vector-mediated gene transfer into patient-derived T cells, each batch manufactured for a single patient. The bulk process intermediate (BPI) concept, developed for biologics to capture the pre-purification cell culture product, applies here in a further complicated form: the BPI is a living, patient-specific cellular product with a finite expiration window measured in hours to days.
Biosimilar Interchangeability: The Regulatory Standard Explained
When a biologic’s reference product exclusivity and relevant patents expire, the pathway to market for a biosimilar requires demonstrating not just chemical equivalence (as with small-molecule generics) but biosimilar interchangeability. The FDA’s interchangeability designation, established under the Biologics Price Competition and Innovation Act (BPCIA), requires that a biosimilar produce the same clinical result as the reference product in any given patient and that switching between the biosimilar and the reference product does not increase safety or efficacy risks compared to using the reference product alone.
Achieving biosimilar interchangeability designation requires head-to-head switching studies, an additional data burden not required for the initial biosimilar designation. The commercial value of the interchangeability designation is that it allows pharmacists to substitute the biosimilar for the reference product at the point of dispensing without prescriber intervention, which drives formulary adoption and volume.
For API manufacturers and CDMOs supplying biosimilar developers, biosimilar interchangeability has direct implications for process control specifications. The analytical package required to support a biosimilar Biologics License Application (sBLA) includes extensive comparative analytical data demonstrating structural similarity to the reference product, including primary sequence, glycosylation pattern, higher-order structure, and functional activity assays. The rigor of this analytical requirement means that the cell line, upstream process parameters, and purification train used by the CDMO have to be locked earlier in development and held tighter throughout manufacturing scale-up than would be typical for a novel biologic program.
IP Valuation: Biologic API Asset Framework
Biologic assets require a different IP valuation model than small molecules. Composition-of-matter patents protect the specific antibody sequence or the therapeutic protein structure, but the patent thicket around commercially successful biologics is substantially denser. Humira (adalimumab, AbbVie) had over 100 patents protecting it at the time of biosimilar entry in the U.S. market, encompassing manufacturing processes, formulation compositions, dosing regimens, and device designs. This patent thicket delayed U.S. biosimilar entry until 2023, a full decade after European biosimilar entry, and AbbVie extracted an estimated $20 billion in additional U.S. sales during that window.
For valuation purposes, a biologic asset’s IP value depends heavily on the cell line generating the API. A proprietary CHO cell line with documented high-producing clones, validated bioreactor performance data, and cell banking protocols meeting ICH Q5D standards is a distinct intangible asset with commercial value independent of the drug program for which it was developed. CDMOs that develop cell lines internally under platform agreements may retain rights to the generating technology while the sponsor retains rights to the sequence, creating a layered IP structure that requires careful contractual definition.
Data package depth, meaning the extent of analytical characterization data generated during process development, is a second value driver for biologic API assets. A cell line with complete upstream process development data, including bioreactor condition matrices, media optimization results, and clarification performance profiles, is worth substantially more in a licensing or M&A context than one with minimal characterization documentation.
Key Takeaways: API Classification and IP
Every API carries a layered intellectual property structure that includes compound patents, process patents, polymorph and formulation patents, and regulatory exclusivity periods. These layers do not expire simultaneously, and understanding the precise expiration timeline for each layer is the foundation of competitive intelligence for generic and biosimilar entrants. For CDMOs, the IP status of a client’s API determines what manufacturing process documentation they can safely generate and what constraints exist on technology transfer to alternative manufacturing sites.
3. The CDMO Market: Data, Competitive Topology, and Regional Dynamics
Market Sizing: What the Numbers Mean
The global CDMO market was valued at approximately $238.9 billion in 2024, according to Fortune Business Insights. Projections converge on a range of $368 billion to $465 billion by 2032 to 2034, implying compound annual growth rates between 7.2% and 9.0%. The API contract manufacturing segment alone, which is the drug substance portion of the market excluding finished dosage form work, is projected to reach $136.1 billion by 2028 at a CAGR of 6.7%.
These figures encompass both small-molecule and biologic contract services, including drug substance manufacturing, drug product formulation, fill-finish, packaging, and analytical services. The IND-stage CDMO sub-segment, which covers early-phase clinical supply manufacturing, is projected to grow from $5.6 billion in 2025 to $10.3 billion by 2034 at a CAGR of approximately 6.9%, reflecting the continued growth in Phase I clinical trial initiations globally.
Investors should treat these headline figures as directional rather than precise. Market sizing methodologies for the CDMO sector vary substantially between research firms, with differences in scope (some include analytical CRO services, others do not), geographic coverage, and revenue recognition treatment for long-term supply agreements. The more reliable data signal is the consistency of the directional trend across multiple independent analyses.
Competitive Topology: Full-Service Leaders vs. Niche Specialists
Tier 1: Global Full-Service CDMOs
The top tier of the CDMO market is dominated by a small number of global platform organizations that can manufacture both small molecules and biologics from early development through commercial scale, with facilities across North America, Europe, and Asia. Lonza (Switzerland), Catalent (acquired by Novo Holdings in 2024), Samsung Biologics (South Korea), WuXi AppTec (China), and Thermo Fisher Scientific’s pharma services division (U.S.) represent the archetype. These organizations offer integrated drug substance and drug product services, extensive regulatory track records spanning multiple FDA and EMA inspections, and in many cases proprietary manufacturing technologies that generate defensible competitive moats.
The Novo Holdings acquisition of Catalent in 2024 for approximately $16.5 billion, which included the transfer of three Catalent fill-finish facilities to Novo Nordisk to support semaglutide manufacturing capacity, illustrates the strategic value these top-tier assets carry. Novo paid a substantial premium to secure dedicated manufacturing capacity for its GLP-1 receptor agonist franchise, a set of drugs generating over $20 billion annually. When a single drug program requires that level of manufacturing commitment, a CDMO with the right facility footprint becomes a strategic asset, not merely a service vendor.
Tier 2: Mid-Size Regional Specialists
The second tier includes CDMOs with strong regional presence and specialized capabilities in particular modalities or therapeutic areas. Recipharm (Sweden), Fareva (France), Bachem (Switzerland, peptide APIs), Albany Molecular Research (AMRI), and Asymchem (China) exemplify this tier. These organizations compete on depth in their chosen specializations rather than breadth. A biotech developing a GLP-1 peptide analog will look seriously at Bachem’s solid-phase peptide synthesis infrastructure before approaching a generalist Tier 1 CDMO, because Bachem’s peptide manufacturing process development expertise is genuinely differentiated.
Tier 3: Early-Phase and Niche CDMOs
The third tier includes organizations that focus on early clinical supply, specific dosage forms (softgels, inhalation products, ophthalmics), or specific therapeutic categories (oncology HPAPIs, controlled substances). These CDMOs serve a critical role in the ecosystem because they provide the specialized early-phase development support that Tier 1 platforms often do not prioritize for small programs. A virtual biotech with a Phase I asset generating 50 kilograms of API per year does not need a Lonza or Samsung Biologics relationship; they need a responsive, scientifically capable Tier 3 partner that will dedicate senior chemists to their project.
Regional Dynamics: Where Manufacturing Is and Where It Is Going
North America: Value Leadership Under Supply Chain Pressure
North America held 38.6% of the global CDMO market by revenue in 2024. The U.S. concentration of late-phase clinical trials (nearly 6,000 registered in 2024) generates sustained demand for domestic clinical supply manufacturing. American CDMOs command premium pricing, particularly for sterile injectables and biologics, where manufacturing complexity and regulatory scrutiny are highest.
The U.S. domestic CDMO capacity position has strengthened considerably since 2020. The COVID-19 pandemic exposed single-source API import dependencies, particularly for generic antibiotics and analgesics sourced predominantly from India and China. Subsequent federal investment in domestic pharmaceutical manufacturing, including provisions of the CHIPS and Science Act and specific pharmaceutical manufacturing resilience funding, has accelerated capacity builds at U.S.-based CDMOs. The proposed BIOSECURE Act (discussed at length in Section 8) adds further urgency to U.S. domestic capacity expansion.
Europe: Regulatory Credibility and Biologic Depth
European CDMOs, concentrated in Switzerland, Germany, France, Ireland, and the U.K., hold a disproportionate share of the complex biologics and sterile manufacturing market. Switzerland’s position as home to Lonza, Bachem, and Siegfried gives it outsized influence on the global peptide and biologic API supply chain. Ireland’s development as a pharmaceutical manufacturing hub, hosting manufacturing sites for AbbVie, Johnson and Johnson, Bristol Myers Squibb, and multiple CDMOs, reflects the country’s deliberate industrial policy investment in pharmaceutical sector talent and infrastructure.
European CDMO growth is projected at a CAGR of approximately 7.7% through the forecast period, driven by biosimilar manufacturing demand as major biologic reference products continue losing exclusivity in EU markets (where biosimilar entry has historically occurred earlier than in the U.S. due to more direct price negotiation frameworks).
Asia-Pacific: Volume Scale, Cost Advantages, and Geopolitical Headwinds
Asia-Pacific holds the largest market share by some analyses, primarily because of the enormous volume of generic API production in India and China. India produces approximately 20% of global generic drug supply by volume. Major Indian API manufacturers including Dr. Reddy’s Laboratories, Divi’s Laboratories, Aurobindo Pharma, and Laurus Labs operate at commercial scales that no Western CDMO can match for cost-sensitive generic API manufacturing.
China’s CDMO sector built itself into a global force over the 2010s. WuXi AppTec’s integrated chemistry, manufacturing, and biology (CRDMO) model, which covers everything from hit identification through commercial API manufacturing, achieved revenues exceeding $3.9 billion in 2023. WuXi Biologics’ cell culture-based biologic manufacturing capacity is among the largest globally. However, both companies now face existential strategic uncertainty from the BIOSECURE Act (see Section 8).
Key Takeaways: Market Dynamics
The CDMO market’s headline growth obscures significant internal stratification. Commodity small-molecule API manufacturing is a low-margin, high-competition business driven by scale economics and cost. Complex modality manufacturing (biologics, ADCs, gene therapy vectors, HPAPIs) commands premium pricing and is structurally supply-constrained relative to demand. CDMOs that have invested in building specialized capability in high-complexity modalities are in a fundamentally stronger competitive position than generalists competing on price alone.
Investment Strategy: CDMO Market Positioning
A useful analytical framework for evaluating CDMO investments is the modality-margin matrix. Map each CDMO’s revenue by manufacturing modality against the margin profile for that modality. Generic small-molecule API manufacturing typically carries EBITDA margins of 15% to 20%. Sterile biologic fill-finish operations run at 25% to 35%. Cell and gene therapy manufacturing, where batch sizes are small and per-patient pricing is high, can push above 40% EBITDA margins for operators with strong programs. A CDMO whose revenue base is migrating from the left side of this matrix to the right side has a compelling margin expansion story regardless of top-line growth rate.
4. Drug Development Lifecycle: Phase-by-Phase CDMO Engagement and CMC Strategy
The Regulatory Framework: IND, NDA, BLA, and ANDA
Understanding where CDMOs add value requires understanding the regulatory framework that governs drug development. The U.S. FDA’s drug development process divides into pre-clinical research, clinical investigation (Phases I, II, III), regulatory review, and post-market surveillance. For every phase, the Chemistry, Manufacturing, and Controls (CMC) section of regulatory submissions must describe the manufacturing process, controls, and quality specifications for both the API (drug substance) and the finished product (drug product).
The CMC package is the CDMO’s primary deliverable to its sponsor clients from a regulatory standpoint. A weak CMC package, characterized by insufficient process characterization data, poorly defined specifications, or analytical methods that lack validation, can delay an IND submission, trigger FDA information requests on an NDA, or result in a complete response letter requiring additional data before approval.
CDMOs that understand CMC strategy, not just manufacturing execution, are disproportionately valuable partners. The difference between a vendor who makes material and a true development partner who co-develops the CMC strategy is the difference between meeting a batch release date and building a regulatory filing that holds up to FDA scrutiny.
Preclinical and IND-Enabling Stage: Process Scouting and GMP Readiness
Before a drug candidate enters human trials, it must clear a series of toxicology and safety pharmacology studies under GLP (Good Laboratory Practice) standards. These studies require cGMP-quality API material, typically produced in kilogram quantities for small molecules or gram quantities for complex biologics.
The CDMO’s work at this stage centers on process scouting, which establishes the initial synthetic or bioprocess route; analytical method development, which creates the testing protocols for identity, purity, potency, and characterization; and the production of the first cGMP batches for IND-enabling toxicology studies.
The IND application to the FDA must include a complete CMC section describing the drug substance manufacturing process, controls, and specifications. Deficiencies in the CMC section of an IND are a common cause of clinical holds, which halt planned first-in-human dosing. CDMOs with experienced CMC regulatory affairs teams add concrete value by reducing the probability of IND clinical holds attributable to manufacturing documentation inadequacies.
HPAPI Containment: An Early-Stage Capability Screen
For oncology and cytotoxic drug candidates, the API will likely be classified as an occupational exposure limit (OEL) Category 4 or 5 compound, requiring engineering containment systems during manufacturing. Contained API suites with isolators, split-butterfly valves, and negative-pressure environments must be in place before the first cGMP batch can be produced. CDMOs without credible high-potency API containment capability are disqualified from this work regardless of other strengths. A sponsor developing an ADC payload, for example, must evaluate potential CDMO partners’ containment class capability as a primary screen before any technical or commercial discussion.
Phase I: First-in-Human Supply and Process Simplification
Phase I clinical trials require comparatively small material volumes, often tens of kilograms for small molecules or a few hundred liters of cell culture harvest for biologics. The manufacturing objective is to produce cGMP material of sufficient quality for human dosing while retaining maximum flexibility to change the process as knowledge accumulates.
This tension between flexibility and compliance is the central manufacturing challenge of Phase I. ICH Q8 and Q11 guidelines encourage quality-by-design (QbD) approaches, which systematically study the relationship between process parameters and product quality attributes. A CDMO that applies QbD principles during Phase I process development is laying the foundation for a more efficient and lower-risk scale-up to later phases, because the relationship between input variables and output quality is already understood rather than discovered under time pressure during a Phase III scale-up campaign.
Phase II and III: Scale-Up, Validation Readiness, and Commercial Threading
The transition from Phase I to Phase II manufacturing is the first significant scale-up event for most programs, typically representing a tenfold to thirtyfold increase in batch size. For biologics, this might mean moving from a 200-liter bioreactor to a 2,000-liter system. For small molecules, it typically means transitioning from lab-scale glassware to pilot-scale glass-lined or hastelloy reactors.
Phase III manufacturing must approach commercial process conditions closely enough that the batches produced can form the basis of the process validation data submitted in the NDA or BLA. This requirement, articulated in FDA’s Process Validation Guidance (2011), mandates that the commercial manufacturing process be the same process that produced the clinical material whose safety and efficacy supported approval. Late-stage process changes, if necessary, require comparability studies and potentially additional clinical data, creating significant delays.
The practical implication for CDMO selection is that a sponsor choosing a Phase III manufacturing partner is, in most cases, also choosing their commercial manufacturing partner. Switching CDMOs between Phase III and commercial launch requires a full technology transfer, comparability study execution, regulatory filing of the manufacturing site change, and potentially FDA inspection of the new site before commercial batches can ship. This is a 12 to 24 month exercise that can delay launch and cost tens of millions of dollars. Selecting a CDMO that has both the Phase III clinical supply capability and the validated commercial manufacturing capacity for the expected launch volume is a critical risk-reduction strategy.
Process Performance Qualification: The Regulatory Finish Line
Process Performance Qualification (PPQ) is the final and most rigorous stage of process validation. The FDA expects PPQ to demonstrate that the commercial manufacturing process consistently produces product meeting quality specifications across a minimum of three consecutive batches at commercial scale. PPQ batches must be manufactured under the same conditions as future commercial batches, with the same equipment, the same operators (properly trained), and the same release testing battery.
Failure in PPQ is catastrophic to a launch timeline. PPQ failures attributable to process understanding gaps that could have been addressed during Phase II development are among the most avoidable and expensive errors in pharmaceutical development. CDMOs with rigorous process characterization programs that systematically identify and control critical process parameters (CPPs) during development substantially reduce PPQ failure risk.
Commercial Manufacturing: Supply Chain Architecture and Redundancy
Commercial supply chain design is a strategic exercise distinct from development manufacturing. The central question is how much manufacturing redundancy to build into the supply chain and at what cost.
A single-source commercial manufacturing arrangement with one CDMO is the most cost-efficient option but creates catastrophic supply risk if that CDMO’s facility faces an FDA warning letter, a facility fire, or an unexpected quality event requiring shutdown. A dual-source strategy, with two validated CDMOs each holding a portion of commercial supply, eliminates single-point-of-failure risk but requires maintaining two concurrent technology transfers, two sets of regulatory filings, and two active CMO relationships.
For products with high revenue significance, annual sales exceeding $500 million, dual-source strategies are standard practice. For smaller revenue products, the cost of dual-sourcing often cannot be justified, and sponsors manage supply risk through strategic safety stock inventory levels instead.
Key Takeaways: Development Lifecycle and CMC
The CMC section of regulatory submissions is the primary technical deliverable linking a CDMO’s manufacturing work to regulatory approval. Every process change made during development creates a potential need for comparability studies or regulatory submissions. The CDMO relationship that begins at IND stage and continues through commercial launch, with a consistent and well-documented process history, is structurally superior to one that involves multiple handoffs between different manufacturing sites and organizations.
5. Patent Intelligence as a Business Development Weapon
Why Patent Data Is Structurally Superior to Other Market Intelligence Sources
Patent applications are public documents. They must be published within 18 months of filing under the Patent Cooperation Treaty framework that governs most pharmaceutical patent strategy. That 18-month publication lag creates a narrow but real window during which a pharma company’s R&D direction is visible to anyone with the analytical tools to read it.
Pipeline databases, analyst reports, and clinical trial registries are also publicly accessible, but they lag further behind than patent data. A company will file patent applications on a promising compound before it appears in any trial registry, before any press release, and usually before any investor communication. The compound may still be years away from an IND filing when the patent appears, but a CDMO that can identify it at that stage, analyze the technical demands of the synthesis route, and approach the potential client with a specific, technically informed proposal has a first-mover advantage that a competitor relying on press releases cannot replicate.
The Orange Book and Paragraph IV Filing: Two Linked Data Streams
The FDA’s Approved Drug Products with Therapeutic Equivalence Evaluations, universally called the Orange Book, lists every FDA-approved drug along with its associated patents submitted by the NDA holder and any outstanding exclusivity designations. Patents listed in the Orange Book are subject to Hatch-Waxman Act protections: any ANDA (abbreviated new drug application) filer must certify to the Orange Book-listed patents.
A Paragraph IV certification is a statement by an ANDA filer that a listed patent is invalid or will not be infringed by the generic product. Filing a Paragraph IV certification triggers a 30-month stay of ANDA approval (unless litigation is resolved faster), and the first ANDA filer with a Paragraph IV certification receives 180 days of exclusivity over all other generic entrants once the patent challenge succeeds.
For CDMO business development, active Paragraph IV litigation is a high-value signal. It indicates that one or more generic companies have determined a drug’s patent protection is legally vulnerable and have made substantial commitments to bringing a generic version to market. The successful generic launch of a drug with $500 million or more in annual branded sales creates immediate demand for cost-competitive API supply. The generic company filing the Paragraph IV needs an API source that is cGMP-compliant, has a filed DMF, and can scale to commercial volumes within the litigation timeline. A CDMO that tracks active Paragraph IV litigation against high-value branded drugs can build its commercial manufacturing pipeline years before generic launch.
Evergreening Patent Strategies: The Complete Technical Playbook
Evergreening refers to the set of patent strategies through which originator companies extend commercial exclusivity beyond the original composition-of-matter patent expiration. Understanding these strategies is essential for CDMO business development teams targeting generic and biosimilar manufacturing opportunities, because evergreening determines the true timeline of generic market entry, not just the nominal patent expiration date.
The most frequently used evergreening mechanisms include secondary polymorph patents (discussed in Section 2), metabolite patents (protecting the pharmacologically active metabolite of a prodrug), method-of-treatment patents (protecting specific dosing regimens or patient populations), formulation patents (protecting specific delivery systems, controlled-release matrices, or combination products), and device patents (protecting autoinjectors, inhaler devices, or other drug-device combinations attached to biologic or specialty products).
Salmeterol-fluticasone combination inhaler products from GlaxoSmithKline represent a multi-layer evergreening case study. The base compound patents expired, but device patents on the Diskus inhaler and process patents on the specific particle engineering technology required for the dry powder formulation created additional exclusivity barriers. Generic inhaler entrants had to develop alternative device platforms and particle engineering approaches that achieved comparable pharmaceutical performance without infringing device-specific patents, a manufacturing challenge that added years to development timelines.
For a CDMO, tracking evergreening strategy on high-revenue drugs in its target therapeutic areas provides a reliable 5 to 10 year advance signal of when the generic API market for each drug will open. Firms like DrugPatentWatch aggregate this data systematically, cross-referencing Orange Book listings, patent term extension certificates, exclusivity designations, and active Paragraph IV litigation to produce actionable timelines.
Using Patent Data to Build CDMO Business Development Pipelines
The practical workflow for patent-driven business development involves four discrete steps.
The first step is keyword and classification screening. A CDMO with HPAPI containment capability and oncology chemistry expertise should monitor CPC classification A61K31 (pharmaceutical preparations containing organic active ingredients) combined with keywords like ‘cytotoxic,’ ‘antibody conjugate,’ ‘camptothecin,’ or specific oncology target names. Monthly automated alerts on new patent publications matching these parameters create a continuous early-warning pipeline.
The second step is assignee profiling. When a new relevant patent appears, the assignee field identifies the company filing it. If that company is an existing client, the information can inform upsell or capacity planning conversations. If it is a prospect, it triggers an outreach strategy timed to the likely IND filing date (typically 12 to 24 months after patent publication for clinical-stage programs).
The third step is technical analysis. Reading the claims and examples sections of a pharmaceutical patent reveals the API’s structural characteristics, the synthetic route employed in the examples, key intermediates, and any specific analytical methods described. This technical reading allows a CDMO’s process chemistry team to pre-assess the manufacturing challenge, identify potential pitfalls (low-yielding steps, hazardous reagents, complex stereochemistry), and formulate a specific capability narrative to present to the prospect.
The fourth step is macro-trend extraction. Aggregating patent filing trends by molecule class or therapeutic area over rolling 24-month windows reveals which modalities are entering the R&D pipeline in volume. A sustained increase in patent filings for GalNAc-conjugated siRNA therapeutics is a forward indicator of demand for the specialized oligonucleotide manufacturing infrastructure required to produce them commercially. A CDMO that begins building that capacity when the patent trend first emerges will be positioned to serve the market when the clinical wave arrives two to four years later.
DrugPatentWatch: Platform Architecture and Business Development Applications
DrugPatentWatch integrates pharmaceutical patent data, Orange Book listings, exclusivity designations, Paragraph IV litigation records, active drug pipeline status, FDA inspection history for manufacturing sites, and ANDA filing data into a unified analytical environment. This integration matters because the business development value of any single data source is limited; the signal quality improves substantially when patent data is cross-referenced against pipeline stage, litigation status, and manufacturing site regulatory history simultaneously.
Specifically for CDMO business development, DrugPatentWatch enables four use cases that pure patent databases cannot support. First, it maps from a specific drug to its current API suppliers through DMF filer records, allowing a competing CDMO to identify which manufacturers hold approved supply relationships and what the switching opportunity looks like. Second, it provides patent expiration timelines correlated with existing ANDA filings, which allows a CDMO to prioritize generic API manufacturing opportunities by the probability and timing of market entry. Third, it tracks FDA warning letters and import alerts on existing API suppliers, which creates immediate outreach opportunities for alternative source qualification. Fourth, it monitors regulatory exclusivity periods including orphan drug exclusivity, pediatric exclusivity, and new chemical entity exclusivity, which affect the commercialization timeline for programs in a CDMO’s clinical pipeline.
Key Takeaways: Patent Intelligence
Patent data, read as a business intelligence signal rather than just a legal record, provides a 12 to 36 month lead on clinical pipeline movements that no other publicly available data source matches. The CDMOs that build systematic patent monitoring workflows into their business development processes convert market intelligence into pipeline visibility that competitors relying on press releases and conference announcements simply cannot replicate.
DrugPatentWatch and peer platforms represent a category of pharmaceutical business intelligence software that provides compounding value as subscriber teams build analytical workflows around the data. Evaluate these platforms on data coverage depth (number of countries, patent types, and linked data sources), refresh frequency (how quickly patent publications and Orange Book updates flow into the system), and analyst workflow features (alerting, custom searches, API access for programmatic use). For institutional investors, access to systematic patent landscape data improves the accuracy of loss-of-exclusivity (LOE) models for branded pharma holdings.
6. The CDMO Business Development Playbook
The Unique Value Proposition: Getting Specific or Getting Lost
A CDMO that claims to offer ‘high-quality cGMP manufacturing for small molecules and biologics’ has just described roughly 300 organizations. The business development problem is not resources or capability in the abstract; it is differentiation. Market research consistently shows that pharmaceutical and biotech R&D decision-makers evaluate CDMOs through a narrow initial screen based on two or three specific capability requirements for their project. If a CDMO’s positioning does not map clearly to those specific requirements, it is invisible during the initial selection phase regardless of its actual capability breadth.
Building a credible unique value proposition (UVP) requires internal honesty about where the organization’s technical performance is genuinely superior rather than merely competitive. A useful method is to analyze the last 30 to 50 projects the CDMO completed and categorize them by molecule class, stage of development, therapeutic area, dosage form, and regulatory outcome. The categories where win rates, project extension rates, and referral rates are highest reveal genuine competitive advantage. Those patterns should anchor the public UVP.
Content Marketing for Technical Audiences: Specificity Over Volume
Technical content for pharma and biotech audiences works only when it provides specific, actionable insight that the reader cannot readily obtain elsewhere. A blog post titled ‘Five Things to Know About HPAPI Manufacturing’ generates less qualified engagement than a post titled ‘Managing Genotoxic Impurity Risk in Palladium-Catalyzed Cross-Coupling Reactions: ICH M7 Compliance for Oncology API Synthesis.’ The second title addresses a specific technical challenge that process chemists and regulatory affairs professionals at oncology-focused biotech companies encounter routinely. It communicates, before the first paragraph is read, that the author understands the specific problem and is likely worth engaging.
Case studies carry disproportionate weight in CDMO business development because they prove execution capability rather than asserting it. A case study that walks through a specific process development challenge, the analytical and chemical approach taken to solve it, the timeline from problem identification to resolution, and the regulatory filing outcome provides the kind of concrete evidence that distinguishes a real technical partner from a marketing-first organization. Sponsors evaluating CDMOs often circulate relevant case studies internally to technical teams who never attend sales meetings; the quality of this content shapes the internal assessment.
Webinars and conference presentations at venues like CPHI, PharmaForum, and the AAPS National Biotechnology Conference serve a dual purpose: they provide a direct channel to technical decision-makers and generate discoverable content that appears in search results when prospects research specific manufacturing challenges months or years later.
Lead Qualification and Pipeline Metrics
CDMO sales cycles routinely run 12 to 24 months from first contact to executed manufacturing services agreement. This timeline reflects the multiple decision-makers involved (R&D leadership, regulatory affairs, quality assurance, procurement, and finance), the technical due diligence required (facility audits, analytical comparability studies, reference checks), and the contractual complexity of long-term supply agreements.
Given this cycle length, measuring business development performance purely on closed revenue in any quarterly window is misleading. A more useful set of pipeline metrics includes the number of qualified opportunities (defined by molecule class, stage, and estimated project value), proposal submission rate and proposal win rate segmented by opportunity type, average time from first contact to RFP receipt, and the ratio of first-phase projects (early clinical supply) that subsequently extended into later-phase work with the same client.
The Metrics Contract Services case study cited in the source article illustrates an important principle. A specialized outreach firm executing a high-volume contact program, averaging 45 touches per prospect before initiating a substantive conversation, generated $20 million in quoted projects and $4 million in closed business for a mid-size oral dosage form CDMO. The key takeaway is not the specific contact volume but the implication that organic, relationship-driven business development alone does not saturate the available opportunity set. Systematic prospecting, even for a relatively niche service category, generates quantifiable pipeline expansion.
Digital Presence: SEO Architecture for Pharmaceutical B2B
A CDMO’s website architecture should map directly to the decision-maker’s search behavior. Research buyers in pharma typically search for specific technical capabilities or therapeutic area expertise rather than broad service categories. Dedicated landing pages for each major service category (sterile injectables manufacturing, HPAPI synthesis, ADC manufacturing, oral solid dosage form development) with technical content specific to that service type outperform generic ‘our capabilities’ pages in both organic search ranking and conversion.
Keyword strategy for pharmaceutical B2B should prioritize long-tail technical terms with lower search volume but high intent specificity. A regulatory affairs professional at a biotech company searching for ‘ICH Q11 guidance development historicals small molecule’ is a more qualified prospect than someone searching for ‘CDMO services,’ even though the second term has dramatically higher search volume. Ranking for specific technical queries across 50 to 100 relevant search terms generates a more valuable inbound pipeline than competing for broad high-volume terms where search intent is far less qualified.
Trade Show and Conference Strategy
CPHI Worldwide, held annually in autumn, is the central global meeting point for the pharmaceutical contract services industry. BIO International Convention attracts primarily biotech C-suite executives who represent decision-makers for outsourcing strategy, though the business development ROI for CDMOs at BIO is often lower per meeting than at CPHI because the vendor-to-prospect ratio is high. DIA (Drug Information Association) Annual Meeting, AAPS, and CPhI North America are secondary venues with more focused technical audiences.
Conference business development ROI at these events correlates strongly with preparation quality rather than booth size or marketing spend. A pre-meeting outreach program that schedules 15 to 20 qualified one-on-one meetings before the conference begins consistently outperforms strategies that rely on booth traffic alone. The conversations that lead to RFPs at conferences almost never happen at the booth; they happen in side meetings and dinners where technical depth and relationship quality can be demonstrated.
Key Takeaways: Business Development
CDMO business development is a long-cycle, relationship-intensive process in which technical credibility, demonstrated through specific case studies and content, is the primary currency. Organizations that invest in patent-driven proactive prospecting, technical content marketing, and systematic pipeline metrics will outperform those relying on referrals and conference networking as their primary lead generation mechanisms.
7. CDMO Partner Selection: The Sponsor’s Due Diligence Framework
The Multi-Factor Evaluation Model
Selecting a CDMO partner is a multi-dimensional risk management exercise. The factors below operate as a weighted decision matrix in practice, with weights varying by the stage of development, the therapeutic area, the regulatory complexity of the program, and the sponsor’s own organizational capabilities.
Technical Capability Match
Technical capability evaluation must be specific to the program, not general. A CDMO with excellent lyophilization infrastructure and no relevant cell therapy capability is not a match for a CAR-T program, regardless of its overall regulatory track record. The due diligence process should begin with a technical questionnaire that requests documented experience with the specific molecule class, developmental stage, and dosage form in scope. Responses should be supported by capability data, characterization data from previous comparable programs, and references from clients who completed similar projects.
For novel or complex programs, a small paid feasibility study, sometimes called a ‘fit-for-purpose study’ or ‘development campaign,’ is a standard mechanism for evaluating a CDMO’s technical capability under realistic project conditions before committing to a full development agreement. These studies typically last four to twelve weeks and cost $50,000 to $250,000. The information they generate is worth multiples of that cost in de-risking a subsequent multi-million-dollar development agreement.
Regulatory History and Quality System Depth
A CDMO’s FDA and EMA inspection history is public record in the U.S. (FDA Warning Letters, Import Alerts, and Establishment Inspection Reports are available through FOIA requests and FDA databases) and partially public in Europe. A Warning Letter is the most serious form of FDA regulatory action short of a consent decree. Receiving one does not necessarily disqualify a CDMO permanently, but it requires understanding what the cited violations were, what corrective actions were taken, and whether re-inspection results show sustainable systemic improvement.
The quality system due diligence should go beyond inspection records. Direct questions about the CDMO’s deviation and investigation process, their out-of-specification (OOS) investigation completion times, their CAPA system effectiveness, and their internal audit frequency and findings tell more about the day-to-day quality culture than headline inspection results. A CDMO that closes OOS investigations within five days and has a CAPA effectiveness verification rate above 90% is operating a significantly more mature quality system than one that meets the same inspection record but with longer cycle times and recurring CAPA themes.
Scalability and Long-Term Capacity Planning
A CDMO must be able to support the full development lifecycle of a program, from early-phase clinical supply through commercial launch. The capacity planning discussion should cover the CDMO’s current utilization rate (a CDMO operating at 85% to 90% capacity has limited buffer for unplanned work or campaign extensions), their capital investment pipeline (are they adding capacity in the relevant modality or stage?), and their track record for technology transfers from clinical to commercial scale within their own network.
For programs with significant commercial potential (projected annual sales exceeding $200 million), the manufacturing agreement should include a right-of-first-negotiation for commercial supply even when the initial engagement is for clinical supply only. Without this provision, a sponsor who successfully develops a commercial drug may find themselves negotiating commercial supply terms from a weak position with a CDMO that now holds critical process knowledge and has no contractual obligation to offer favorable pricing.
Project Management Infrastructure
The project manager (PM) assigned to a program is the most important relationship the sponsor will have with the CDMO on a daily basis. A skilled pharmaceutical PM understands the science well enough to anticipate technical risks, can translate between business priorities and laboratory realities, and maintains a proactive communication rhythm that keeps the sponsor informed of project status without waiting for problems to escalate.
Evaluating PM quality before contract execution is possible. Asking to meet the specific project manager who will be assigned (not the business development representative who manages the sales process), reviewing their project management methodology, and requesting references from clients they have managed previously provides sufficient information to assess this critical variable.
Preferred Provider and Strategic Partnership Models
Large pharmaceutical companies have increasingly consolidated their CDMO relationships into preferred provider programs, in which a small set of pre-qualified CDMOs (typically three to eight) receive preferred access to new program RFPs. This consolidation benefits the CDMO with preferred status by providing more predictable volume and deeper client knowledge, but it requires demonstrating consistent performance across multiple programs rather than winning a single showcase project.
For CDMOs seeking preferred provider status with a major pharma company, the positioning strategy should focus on demonstrating organizational capabilities, quality systems, and project management rigor at the organizational level rather than showcasing individual projects. Preferred provider agreements are awarded to organizations, not to individual programs, and the evaluation process involves procurement, quality assurance, regulatory affairs, and senior R&D leadership simultaneously.
Key Takeaways: Partner Selection
The CDMO selection process has the same risk profile as a key hire: getting it right saves time, money, and significant organizational stress; getting it wrong at a critical development stage can cost years of program delay and tens of millions in rework and technology transfer. Investing adequately in upfront due diligence, including paid feasibility studies, reference checks, and facility audits, is consistently the higher-ROI strategy compared to selecting primarily on price and speed of proposal.
8. Geopolitical Disruption: The BIOSECURE Act and Supply Chain Restructuring
The Legislative Framework
The BIOSECURE Act, introduced in the U.S. Congress with bipartisan support, proposes to prohibit U.S. federal agencies and any company receiving federal contracts from using services, equipment, or technology from designated Chinese biotechnology companies of concern. The named companies in early legislative drafts include WuXi AppTec, WuXi Biologics, BGI Genomics, MGI Tech, and Complete Genomics.
The legislative rationale is national security: concerns that genomic and pharmaceutical data generated at Chinese-owned CDMOs and genomics companies could be accessed by the Chinese government under Chinese national security law, and that U.S. pharmaceutical supply chain dependence on Chinese-owned manufacturers creates strategic vulnerability. Regardless of the specific merits of these concerns as applied to individual companies, the legislative momentum has already materially changed pharmaceutical industry supply chain strategy.
The Scale of Exposure
An estimated 80% of U.S. biopharmaceutical companies have some direct or indirect commercial relationship with a China-based CDMO. WuXi AppTec alone had over 5,900 active clients in its 2023 annual report. The scope of potential supply chain disruption if the BIOSECURE Act passes with its current named entities is unprecedented in the modern pharmaceutical manufacturing industry.
The disruption timeline is asymmetric. Transferring a complex biologic manufacturing process from a Chinese CDMO to an alternative site in the U.S. or Europe takes 18 to 36 months under optimistic conditions, assuming the receiving site has the required equipment, infrastructure, and qualified personnel. For gene therapy vector manufacturing or advanced ADC conjugation, which require even more specialized equipment, the timeline extends further. Companies that began technology transfer planning in 2024 may be in an adequate position by 2026 to 2027, but those that waited will face a compressed and expensive scramble.
Reshoring and Friend-Shoring: The Strategic Opportunity
The BIOSECURE Act’s most important commercial effect may not be what it prevents but what it accelerates. U.S., European, Indian, South Korean, and Japanese CDMOs are the primary beneficiaries of the manufacturing displacement. Lonza, Samsung Biologics, Fujifilm Diosynth Biotechnologies, and several mid-sized U.S. CDMOs have publicly cited BIOSECURE Act tailwinds in investor communications.
India’s position as an alternative API supplier to China is structurally well-positioned. Indian CDMOs and API manufacturers already supply the majority of the U.S. generic drug market’s API requirements and are aggressively investing in the facility upgrades and analytical capabilities needed to serve more complex branded and biologic programs. The Indian government’s Production-Linked Incentive (PLI) scheme for the pharmaceutical sector, with disbursements specifically targeted at API manufacturing, is accelerating this investment.
South Korea’s Samsung Biologics and associated ecosystem companies have built biologic manufacturing capacity competitive with any Western CDMO and carry none of the regulatory uncertainty that Chinese-owned facilities now face for U.S. programs. Samsung Biologics’ total manufacturing capacity exceeded 620,000 liters of bioreactor volume in 2024, making it one of the world’s largest biologic manufacturers by capacity.
Supply Chain Risk Quantification for Sponsors
Pharmaceutical companies need a systematic method for quantifying BIOSECURE Act exposure before designing mitigation strategies. The relevant inputs for this analysis include the number of active programs that use named or potentially designated Chinese CDMO services, the development stage of each program (a Phase I program is easier to transfer than a Phase III program with multiple clinical batches of validated material in the regulatory filing), the estimated technology transfer timeline and cost for each program, and the regulatory filing implications of a manufacturing site change at each program stage.
Programs in late Phase II or Phase III are the highest-risk category because a manufacturing site change at this stage requires either completing the existing phase with the current site and transferring before NDA submission or amending regulatory filings mid-development, both of which create timeline and cost risk. Programs in Phase I or earlier can be transferred with substantially less regulatory impact.
Key Takeaways: Geopolitical Risk
The BIOSECURE Act, whether or not it passes in its current form, has permanently changed the risk calculus for U.S. pharmaceutical companies using Chinese CDMO services. The prudent strategic response is to begin supply chain diversification now, prioritizing highest-risk programs (late-phase, commercially significant) for alternative site qualification. CDMOs outside of China should treat this period as a multi-year capacity expansion opportunity, because the volume of displaced manufacturing work will sustain demand well beyond any single legislative cycle.
Investment Strategy: BIOSECURE Act Beneficiaries
The clearest investment signal from the BIOSECURE Act is capacity scarcity at CDMOs positioned to absorb displaced Chinese manufacturing. Look for CDMOs announcing material capacity expansions in biologics, gene therapy vectors, or ADC manufacturing with credible timelines and existing client relationships that can fill that capacity. Also watch Indian API manufacturers with U.S. FDA-approved sites for small-molecule generic API programs transitioning away from Chinese sources. The displacement volume is large enough to support sustained above-market revenue growth for well-positioned non-Chinese CDMOs for at least three to five years from the date of any enacted legislation.
9. Frontier Technologies: Cell and Gene Therapy, Continuous Manufacturing, and AI
Cell and Gene Therapy Manufacturing: The Technical Gauntlet
The ‘Vein-to-Vein’ Logistics Problem
Autologous CAR-T cell therapy manufacturing begins when a clinician draws blood from the patient at the hospital, processes it to isolate the T cells, and ships those cells to the manufacturing facility. The manufacturing steps include T cell activation, viral vector transduction (introducing the CAR gene into the T cells), T cell expansion in a bioreactor, harvest, formulation, cryopreservation, and shipment back to the clinical site for infusion. Total cycle time from apheresis to patient infusion is typically 16 to 22 days for current commercial products, and any break in the cold chain or delay in any manufacturing step can render the batch unusable.
CDMOs providing this manufacturing face a set of logistical, quality, and technical challenges that are qualitatively different from anything in conventional pharmaceutical manufacturing. Patient identity assurance, the chain of custody from patient to product and back, is a GMP requirement unique to autologous therapies. A mix-up between two patients’ products is not a recall event; it is a potentially fatal dosing error. Quality systems for autologous therapies require lot segregation, identity testing at every step, and chain-of-custody documentation that has no parallel in conventional batch manufacturing.
Technology Roadmap: Scaling Autologous Therapies
The current autologous manufacturing model is inherently limited in throughput. Each patient’s cells are processed in a separate, parallel manufacturing run. The clinical-stage Kymriah and Yescarta manufacturing models used semi-automated processes with substantial manual handling steps that limited the number of concurrent batches a facility could run.
The technology roadmap for the next five to ten years focuses on three parallel developments. First, platform automation, meaning closed-system bioreactor platforms like the Miltenyi CliniMACS Prodigy, Lonza Cocoon, and Cytovance biological manufacturing systems, reduces manual handling and allows higher batch concurrency. Second, decentralized manufacturing, where point-of-care facilities affiliated with major academic medical centers manufacture the cellular product locally, eliminates the shipping time and cold chain complexity of centralized manufacturing. Third, allogeneic CAR-T products, which use donor-derived T cells to create an ‘off-the-shelf’ product not requiring patient-specific manufacturing, could eventually displace autologous products in some indications if immunological tolerance challenges can be solved.
CDMOs that have invested early in specialized CGT manufacturing suites, viral vector production for gene therapy applications, and the quality systems required for autologous therapies are positioned to serve a market projected at a CAGR exceeding 18%, reaching an estimated $37 billion by 2034.
IP Valuation in CGT: Where Value Lives
The IP landscape in cell and gene therapy is concentrated in three areas. First, vector design patents protect specific viral capsid modifications (for AAV gene therapy) or lentiviral vector architectures (for CAR-T) that improve cell transduction efficiency or tissue targeting. These are foundational technology patents, and licensing access to them is often a prerequisite for program development. Second, manufacturing process patents protect specific upstream bioprocess conditions, vector purification methods, or cell expansion protocols that achieve commercially relevant yields. Third, cell line or vector production line patents protect the specific producer cell systems used to generate viral vector batches.
For CDMOs, the relevant IP risk is whether their manufacturing platform for CGT programs infringes third-party foundational patents. Extensive freedom-to-operate analysis is required before a CDMO builds a platform CGT manufacturing service, because offering that service to multiple clients could create a contributory infringement exposure if the underlying manufacturing process uses patented methods without a license.
Continuous Manufacturing: The Technology Transition
Continuous manufacturing (CM) replaces discrete batch operations with an integrated, uninterrupted production process where raw materials enter continuously and finished product exits continuously. The FDA has actively encouraged CM adoption since its 2019 guidance on the topic, recognizing the quality and supply chain reliability advantages of steady-state continuous processes over inherently variable batch operations.
The Roche/Genentech case study cited in the source article quantifies the benefit concisely: integrating continuous drug substance and drug product manufacturing reduced total lead time from 15 months to 50 hours for a specific program. The footprint reduction of 70% and cost reduction of up to 40% represent economic advantages that compound over the full commercial lifetime of a product.
The commercial adoption rate of CM remains low relative to its technical maturity. Janssen’s Prezista (darunavir) was the first FDA-approved drug manufactured via continuous processing (2016). Vertex Pharmaceuticals has implemented CM for its CF modulators. The industry is past proof-of-concept but well short of broad adoption, which means CDMOs that invest now in CM platform technology are entering a market where supply is limited and early-mover positioning can be established before competitors catch up.
The capital barrier to CM adoption is the primary limiting factor. A continuous tableting line with integrated dissolution monitoring, particle characterization, and real-time release testing capabilities requires $15 million to $30 million in equipment investment. For a CDMO, that investment needs to be justified by client demand that may not yet be contractually committed at the time of investment. CDMOs that build CM capability speculatively, betting on the technology adoption curve, take on meaningful capital risk that investors should price accordingly.
Artificial Intelligence: Current Applications and Realistic Horizon
Manufacturing Process Optimization
Machine learning applications in pharmaceutical manufacturing are currently most mature in process monitoring and anomaly detection. Multivariate statistical process control (MSPC) algorithms trained on historical batch data can detect deviations from normal process trajectories earlier than traditional univariate control charts, enabling intervention before a batch fails. Lonza, Pfizer, and several mid-size CDMOs have reported reduced batch failure rates and OOS investigation frequencies following implementation of MSPC-based monitoring systems.
Predictive maintenance applications use vibration sensors, thermal imaging, and process data streams to predict equipment failures before they cause unplanned downtime. For a CDMO running multiple concurrent clinical supply campaigns where schedule adherence is critical for sponsor milestones, eliminating even one unplanned equipment failure per quarter can prevent multiple clinical supply delays, each of which could cost the sponsor weeks of trial timeline.
Business Development and Market Intelligence
AI applications in CDMO business development are less mature but advancing rapidly. Natural language processing (NLP) tools that scan patent databases, FDA submission archives, and biotech press releases to extract structured signals about pipeline stage, manufacturing requirements, and decision timing are available from several specialized vendors. The commercial value of these tools is proportional to the quality of the underlying data sources and the analytical sophistication of the rule sets used to extract signals.
Generative AI tools have begun entering the proposal and content generation workflows of larger CDMOs. Generating a first draft of a technical capabilities document, adapting an existing case study to a new therapeutic area, or drafting the technical sections of a response to an RFP are tasks where generative AI can meaningfully reduce cycle time. However, the specialized technical and regulatory content in pharmaceutical CMC documentation requires expert review before client submission; AI-generated technical content without expert review creates regulatory risk.
The Agentic AI Horizon
Agentic AI, systems capable of autonomously executing multi-step workflows in response to environmental signals without step-by-step human instruction, is conceptually well-suited to pharmaceutical manufacturing supply chain management. An agentic system with access to real-time production scheduling data, raw material inventory levels, client demand signals, and regulatory filing timelines could theoretically optimize production scheduling across a multi-site CDMO network faster and more completely than human planners. The practical barriers to deployment at this level of autonomy, including system validation requirements for GMP applications, liability for agentic errors in drug manufacturing, and the data integration complexity of connecting legacy manufacturing execution systems (MES) with modern AI platforms, make this a realistic 5 to 10 year horizon for CDMOs rather than a near-term operational capability.
Key Takeaways: Frontier Technologies
The highest-margin, fastest-growing segments of the CDMO market require the largest upfront capital investments and the most specialized technical talent. CDMOs that have made these investments, specifically in CGT manufacturing suites, continuous processing platforms, and validated HPAPI containment infrastructure, have built moats that take competitors three to five years and hundreds of millions of dollars to replicate. The capital intensity is the point: it is also the source of pricing power and margin protection.
Screen CDMO investments for three technology-specific indicators. First, look for revenue from CGT manufacturing programs that is already booked or under long-term agreement; speculative capacity without contracted demand is a capital sink. Second, evaluate whether continuous manufacturing investment is being made in response to specific client demand with committed volume (high-confidence investment) or speculatively ahead of market adoption (higher-risk bet). Third, assess AI and digital investment in terms of where it appears in the P&L: process development AI tools that reduce cycle time and improve process success rates have a clearer ROI pathway than customer-facing chatbots that add marketing cost without operational benefit.
10. Investment Strategy for Institutional Analysts: A Structured Framework
Valuation Frameworks for CDMO Assets
CDMO businesses are typically valued on EBITDA multiples calibrated to growth rate, margin profile, revenue quality, and regulatory risk. The Novo Holdings acquisition of Catalent at approximately 12x trailing EBITDA reflects the premium assigned to scale, modality breadth, and strategic manufacturing scarcity in the GLP-1 manufacturing context. Mid-market CDMOs with narrower modality focus trade at 8x to 11x EBITDA depending on growth rate and client concentration.
Revenue quality is a particularly important variable in CDMO valuation. Long-term commercial supply agreements, where a CDMO has an exclusive or preferred supply relationship for a successfully launched drug, carry higher quality than early-phase clinical revenue that terminates if the drug fails. For valuation purposes, commercial supply revenue should trade at a premium to clinical revenue because it is both more recurring and more defensible (switching a commercial manufacturing site requires regulatory filings that take 12 to 24 months).
The inverse of commercial supply contract quality is client concentration risk. A CDMO generating 35% of revenue from a single commercial supply agreement is exposed to a cliff-edge risk if that drug loses market share, faces competition from biosimilars or generics, or if the sponsor vertically reintegrates manufacturing. Investors should discount EBITDA from highly concentrated revenue relationships and require a broader client base or a longer contract duration before assigning full multiple.
Due Diligence Checklist for Pharmaceutical Investors
Effective due diligence on a CDMO investment should cover at minimum the following areas: FDA and EMA inspection history for all active manufacturing sites, the revenue breakdown by molecule class and development stage (clinical vs. commercial), the forward contract backlog and its composition by client and program, capital expenditure plans and their relationship to client-committed volume, talent retention metrics (turnover rate for senior scientists and project managers is a leading quality system indicator), and IP ownership terms in development agreements (does the CDMO retain platform IP? who owns cell lines or manufacturing processes developed in collaboration?).
The LOE Calendar as a Signal Generator
Loss-of-exclusivity events for major biologic and small-molecule drugs generate predictable demand signals for CDMO services. When a drug worth $1 billion or more annually loses patent protection, at minimum several generic or biosimilar entrants need API supply, drug product manufacturing, and fill-finish services. The LOE calendar for the 2025 to 2030 period includes a number of major biologics whose composition-of-matter patents expire, including several monoclonal antibodies that have not yet experienced meaningful biosimilar competition in the U.S. market.
Tracking this calendar and mapping it to CDMOs with relevant manufacturing capability, validated regulatory track records, and existing client relationships in the generic or biosimilar development community allows investors to identify CDMOs likely to see revenue step-ups from LOE-driven volume before those contract commitments appear in public filings.
Key Takeaways: Investment Framework
The most durable CDMO investments share three characteristics: a defensible position in at least one high-complexity, capital-intensive manufacturing modality; a strong regulatory track record across FDA and EMA inspections; and revenue quality weighted toward long-term commercial supply agreements rather than early-phase clinical project work. Any of these criteria in isolation is insufficient. A CDMO with perfect FDA inspection records but exclusively early-phase clinical revenue has no earnings visibility. A CDMO with commercial supply revenue but a pending Warning Letter has regulatory risk that can disrupt that revenue overnight.
11. Frequently Asked Questions
What is the practical difference between a CMO and a CDMO, and when does the distinction matter?
A Contract Manufacturing Organization executes a manufacturing process provided by the client. A Contract Development and Manufacturing Organization provides both the process development and the manufacturing execution, with its own scientific teams participating in process design, optimization, and CMC regulatory strategy. The distinction matters most for early-stage programs where the manufacturing process has not yet been fully developed. A pure CMO relationship requires the sponsor to develop the process independently before engaging the manufacturer. A CDMO relationship places process development and manufacturing under one organization, enabling the continuous feedback loop between drug substance and drug product development that reduces development risk and accelerates timelines.
How does a Paragraph IV filing relate to CDMO business development opportunities?
A Paragraph IV certification indicates that a generic applicant has challenged one or more Orange Book-listed patents protecting a branded drug, asserting invalidity or non-infringement. If the challenge succeeds, the generic product can launch, creating immediate demand for API supply, drug product manufacturing, and fill-finish services. CDMOs that track active Paragraph IV litigation against high-revenue drugs can anticipate this demand 18 to 36 months before generic market entry, build relationships with likely generic entrants, and secure manufacturing agreements that generate commercial revenue coinciding with successful patent challenges.
What does ‘evergreening’ mean in practical terms for a CDMO’s business development timeline?
Evergreening refers to originator companies’ use of secondary patents (on polymorphs, metabolites, formulations, methods of use, or devices) to extend commercial exclusivity beyond the original composition-of-matter patent. For CDMOs targeting generic API manufacturing opportunities, evergreening means the actual opening of the generic API market may be substantially later than the compound patent expiration date suggests. A CDMO relying only on compound patent expiration dates to project generic manufacturing opportunities will systematically overestimate the speed of market opening. Accurate LOE modeling requires analysis of the full patent estate, including all secondary patents and any remaining exclusivity designations.
What is ‘biosimilar interchangeability’ and why does it affect how CDMOs develop biologic manufacturing processes?
The FDA’s biosimilar interchangeability designation allows pharmacists to substitute a biosimilar for its reference product without prescriber involvement, materially improving formulary adoption. Achieving this designation requires head-to-head switching studies and a more rigorous analytical comparability package than standard biosimilar approval. For the CDMO manufacturing the biosimilar API (the biologic drug substance), this means the cell line, upstream process parameters, and purification platform must be locked earlier and held more tightly during development and scale-up than for a standard novel biologic program. Process drift that would be acceptable in a novel biologic development program may generate analytical signals of non-comparability in a biosimilar interchangeability data package.
How should a biotech company think about CDMO selection at the earliest stages of a program?
The earliest CDMO selection decision, typically at the point of IND-enabling manufacturing, has longer-lasting consequences than it appears. The CDMO that produces the first GMP batches of an API will generate the reference analytical data, establish the initial process parameters, and produce the comparability baseline against which all future process changes will be measured. Changing CDMOs later in development requires a full comparability exercise. Selecting an early-phase partner with the technical depth to support late-phase development, even if the sponsor does not immediately intend to use them for late-phase work, preserves the option to continue with a single manufacturing history rather than managing comparability studies attributable to a CDMO switch.
What role does DrugPatentWatch play in CDMO business development workflows?
DrugPatentWatch aggregates pharmaceutical patent data, FDA Orange Book listings, Paragraph IV litigation records, ANDA filings, DMF filer records, exclusivity designations, and pipeline stage data into a unified platform. For CDMOs, the platform enables proactive lead identification by tracking new patent filings from potential clients, monitoring LOE timelines to anticipate generic API manufacturing opportunities, and identifying FDA regulatory actions against existing API suppliers that create alternative-source qualification opportunities. The platform’s integration of multiple data types into a single analytical environment means business development teams can move from patent publication to a fully contextualized prospect profile, including estimated pipeline stage, likely manufacturing requirements, and existing supplier relationships, in a single research session rather than across multiple disconnected databases.
This analysis reflects publicly available market data, regulatory records, and industry reporting. Specific market projections are sourced from Fortune Business Insights, BioSpace, Grand View Research, Precedence Research, and Towards Healthcare. All figures should be treated as directional estimates rather than precise forecasts.