In January 2022, Mark Cuban launched a pharmacy that listed drug prices on a public website. That alone was unusual. What nobody fully appreciated at the time was that he had also built one of the most revealing competitive intelligence databases the pharmaceutical industry has ever accidentally produced.
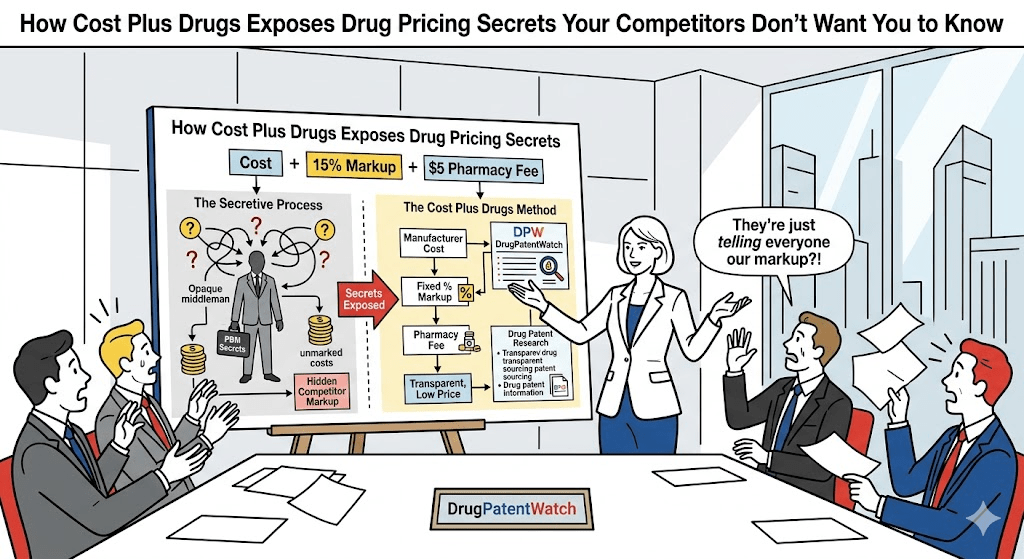
Cost Plus Drugs — officially Mark Cuban Cost Plus Drug Company — posts its pricing formula for every drug it sells: manufacturing cost plus a 15% markup, a flat $3 pharmacy dispensing fee, and a $5 shipping charge [1]. The formula is public. The prices are public. The drug list is public. And sitting inside that public data, if you know how to read it, is a roadmap of margin structures, generic entry timelines, and market positioning decisions that brand-name manufacturers spend millions trying to obscure.
This article is about how to use that data — and tools like DrugPatentWatch — to build genuine competitive intelligence about the companies fighting for market share in the spaces where Cost Plus Drugs competes. It is also about what Cost Plus Drugs’ very existence tells us about the broken pricing architecture that made its model not just viable, but embarrassing to the incumbents.
We are going to get specific. Real drugs, real price deltas, real litigation histories, and real business conclusions.
The Accidental Intelligence Machine
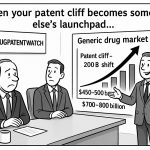
Most competitive intelligence in pharma requires access you don’t have: internal pricing memos, formulary negotiations, rebate contracts, PBM data. Cost Plus Drugs eliminates the need for most of it in the generic market. When a company publicly prices imatinib — the generic of Novartis’ blockbuster leukemia drug Gleevec — at $17.10 for a 30-day supply [2], and the retail price for the same drug at a traditional pharmacy can exceed $9,000 for the same quantity [3], you no longer need a source inside Bristol Myers Squibb’s pricing department to understand what the patent cliff did to that drug’s economics.
The gap between Cost Plus pricing and retail pricing is not noise. It is signal. It tells you, with reasonable precision, how much margin the incumbent supply chain was extracting — and by extension, how much room a generic entrant has to compete, how aggressively a PBM is likely to negotiate, and how long before payer pressure pushes a branded drug toward formulary exclusion.
The mechanism works because Cost Plus buys at or near true manufacturing cost. Its disclosed cost for manufacturing imatinib is $14.87 per 30-day supply. The active pharmaceutical ingredient (API) for imatinib is produced primarily in India and China, where manufacturing efficiencies have driven costs down substantially since generic entry in 2016 [4]. When you see Cost Plus’ cost disclosure, you are seeing the approximate floor of what anyone sourcing at scale should be paying for that molecule. Everyone above that floor is capturing margin that, in a competitive market, is theoretically available for disruption.
The implications extend far beyond any single drug.
Reading the Catalog: What’s Listed and What That Means
As of mid-2025, Cost Plus Drugs carries over 2,500 medications [5]. The selection is not random. Cuban and his team have made deliberate choices about which drugs to stock, and those choices encode a theory about where generic pricing is most dysfunctional. Understanding the selection logic is itself a competitive intelligence exercise.
The Gleevec Effect: When Patent Cliffs Create Pricing Canyons
Imatinib is the canonical example of what happens when a high-value branded drug loses patent protection but the incumbent pricing infrastructure doesn’t reset. Gleevec’s U.S. patents began expiring in 2015. Novartis fought generic entry through a combination of additional patent filings, authorized generics, and patient assistance programs [6]. By 2016, generics had entered, but retail prices at traditional pharmacies remained extraordinarily high — a phenomenon the academic literature calls “generic paradox” pricing, where the entry of generics does not produce the expected price collapse because PBM rebate structures incentivize continued use of branded or high-list-price alternatives [7].
Cost Plus Drugs’ entry into this market does something analytically useful: it establishes a genuine cost baseline. The $14.87 manufacturing cost figure for imatinib, when set against the median retail price of approximately $2,100 to $9,000 depending on dosage and source [3], reveals that the drug’s supply chain was absorbing between 99.3% and 99.8% of the retail price before it reached the patient. That is not a statement about Novartis specifically — the branded drug had its own pricing logic, driven by clinical development costs and market exclusivity. It is a statement about what happened to the generic version after patent expiration: the incumbent pricing architecture captured the savings that were supposed to flow to payers and patients.
For a competitor mapping the imatinib market today, the Cost Plus data tells you something specific and actionable: any manufacturer selling imatinib generics above approximately $30 per 30-day supply to cash-pay customers is operating in a segment that will compress. The question is when, not whether.
Atorvastatin: The Lipitor Story Nobody Finished Telling
Pfizer’s Lipitor lost patent exclusivity in 2011. By any standard measure, it should have become one of the most affordable drugs in America within two years. Atorvastatin — the generic — became the most prescribed drug in the United States [8]. And yet, even a decade after patent expiration, cash prices for atorvastatin at traditional pharmacies remained highly variable, with GoodRx showing prices from roughly $10 to over $300 for a 30-day supply of the same dose at different pharmacies in the same metropolitan area [9].
Cost Plus Drugs lists atorvastatin 20mg at $7.50 for a 90-day supply — roughly $2.50 per month [10]. The manufacturing cost it discloses is $6.49 for 90 tablets.
What does a $6.49 manufacturing cost for a 90-day supply of one of the world’s most common drugs tell you about the competitive landscape? It tells you that any pharmacy, PBM, or payer claiming that distribution and dispensing costs justify prices above $15 to $20 for a 90-day supply of atorvastatin is not accurately attributing costs. It tells you that the price variation in the retail market — from $10 to $300 for the same product — is not a function of underlying cost variation. It is a function of information asymmetry, formulary design, and patient inability to shop effectively across pharmacy channels.
For pharmaceutical competitors, this has direct strategic implications. Any company that has built a market position around atorvastatin pricing above roughly $20 per 30-day supply for cash-pay customers should model the scenario in which Cost Plus Drugs expands its pharmacy network — currently direct-to-consumer online — into retail or employer-sponsored pharmacy benefit channels. That scenario is not theoretical. It is a strategic question of timing.
The Patent Layer: Where DrugPatentWatch and Cost Plus Data Intersect
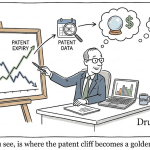
The full competitive picture requires layering patent data onto the pricing data. This is where a tool like DrugPatentWatch becomes essential. DrugPatentWatch aggregates FDA Orange Book data, Paragraph IV certification filings, litigation records, and patent expiration schedules to create a structured view of the generic entry timeline for any drug on the market [11].
When you cross-reference a Cost Plus Drugs listing with DrugPatentWatch’s patent data, you can build a forward-looking model of where Cost Plus is likely to expand its catalog next — and by extension, where generic pricing compression is coming for the drugs in your own portfolio.
Paragraph IV Certifications as Early Warning Signals
Under the Hatch-Waxman Act, a generic manufacturer filing an ANDA with a Paragraph IV certification is asserting that the brand’s listed patents are either invalid or will not be infringed by the generic product [12]. The brand manufacturer then has 45 days to sue, triggering an automatic 30-month stay on FDA approval. This litigation creates a public record — and that public record, tracked through DrugPatentWatch, functions as a leading indicator of generic entry timelines.
The strategic logic is straightforward: drugs with active Paragraph IV litigation and an approaching patent cliff are the drugs most likely to appear in Cost Plus Drugs’ catalog within 18 to 36 months of litigation resolution. If you are a brand manufacturer in that position, or a specialty pharmacy that has built revenue around a drug approaching that inflection point, the Cost Plus catalog is not just a pricing curiosity. It is a preview of your market in 24 months.
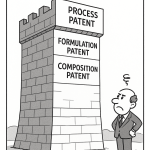
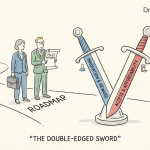
Consider the case of Humira (adalimumab), AbbVie’s blockbuster rheumatoid arthritis drug. AbbVie maintained U.S. market exclusivity for adalimumab through a complex patent portfolio — DrugPatentWatch lists more than 70 Orange Book patents for adalimumab — that kept biosimilar competition out of the U.S. market until 2023, nearly a decade after biosimilars were available in Europe [13]. The litigation complexity was extreme: Amgen, Samsung Bioepis, and Sandoz all filed Paragraph IV challenges at various points; AbbVie ultimately settled with most biosimilar manufacturers through licensing agreements that delayed U.S. entry [14].
Cost Plus Drugs has not yet listed adalimumab biosimilars as of this writing, in part because biosimilar pricing dynamics differ from small-molecule generics — the manufacturing complexity is orders of magnitude higher, and the cost floor is correspondingly higher. But the directional logic applies: as biosimilar entry matures and manufacturing scale increases, the same pricing compression dynamic that hit imatinib will, over time, pressure adalimumab.
‘The average brand-name drug costs about 85 times more than its generic equivalent in the United States, while in other developed countries that ratio rarely exceeds 3 to 1.’ —USC Schaeffer Center for Health Policy and Economics, 2021 [15]
The 180-Day Exclusivity Window and Its Strategic Implications
Under Hatch-Waxman, the first generic manufacturer to file a Paragraph IV certification earns 180 days of market exclusivity before other generics can enter [12]. This creates a predictable pricing pattern: the first generic typically enters at a price meaningfully below the brand, captures market share rapidly, and then faces a second price compression when the 180-day window closes and additional generics enter.
Cost Plus Drugs typically enters markets after the 180-day window has closed and multiple generic manufacturers are competing. This is when API costs have been driven down by competition among API suppliers — predominantly in India and China — and when manufacturing contracts are available at scale pricing.
For competitive strategists, this identifies a specific vulnerability window: the period between first generic entry and the end of 180-day exclusivity is when the incumbent brand and the first generic coexist with significant pricing power. After that window closes, Cost Plus-style pricing becomes the relevant benchmark. Building revenue assumptions that depend on pricing power past the end of 180-day exclusivity, in a drug class that Cost Plus covers, is the kind of strategic error that only becomes visible when the next annual plan comes in 30% below forecast.
Case Study: Metformin, the Diabetes Pricing Scandal in Plain Sight
Metformin is the world’s most prescribed diabetes drug. It has been generic for decades. Its manufacturing cost is negligible. Cost Plus Drugs lists metformin 500mg, 90-count, at $5.10 — a manufacturing cost of $4.43 [10].
The American Diabetes Association guidelines recommend metformin as first-line therapy for type 2 diabetes [16]. Approximately 37.3 million Americans have type 2 diabetes, and a substantial fraction of them take metformin [17]. The out-of-pocket cost for metformin at traditional pharmacies, for patients without insurance or with high-deductible plans, has historically ranged from $10 to $25 per 90-day supply through discount programs, and considerably more without them.
That spread — $4.43 manufacturing cost versus even $10 at retail — tells you something important about the economics of a “commoditized” drug. The margin on a $4.43-cost, $10-retail transaction is 126%. In a drug that is prescribed to tens of millions of Americans as standard of care for a chronic disease, that margin is not trivial in aggregate, even at a per-unit level that seems small.
For pharmaceutical companies competing in the diabetes space, the Cost Plus metformin price sets a floor that anchors patient expectations for the entire oral diabetes market. A patient paying $5.10 per month for metformin who is then prescribed an SGLT2 inhibitor at $400 per month is going to notice the gap. That price sensitivity creates formulary pressure, drives prior authorization utilization, and makes payer negotiations for newer diabetes drugs increasingly difficult.
The broader lesson: the Cost Plus catalog does not just compete with the drugs it lists. It changes the reference point against which all drugs in a class are evaluated.
What the Pricing Formula Reveals About Manufacturing Economics
Cost Plus Drugs’ stated formula — manufacturing cost plus 15%, plus $3 dispensing, plus $5 shipping — is simple enough that it can be reverse-engineered from any listed price. If a drug lists at $18.58 for a 90-day supply, the implied manufacturing cost is approximately $8.35 per 90 tablets. That is a testable number. It can be compared against published API cost data, manufacturing cost literature, and the prices at which API suppliers quote comparable molecules.
This creates an unusual analytical opportunity. In most industries, manufacturing cost is proprietary. In pharma, it is buried under layers of transfer pricing, PBM rebates, wholesaler margins, and pharmacy markups that make it effectively invisible. Cost Plus Drugs removes those layers.
API Sourcing and the India-China Supply Chain
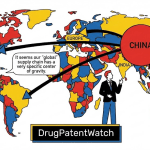
The manufacturing costs that Cost Plus Drugs discloses are consistent with API prices from Indian and Chinese manufacturers — the dominant global suppliers for most generic small-molecule drugs. India’s pharmaceutical export industry supplies API for approximately 40% of generic drug formulations sold in the United States [18]. Companies like Sun Pharmaceutical, Dr. Reddy’s Laboratories, Cipla, and Aurobindo Pharma manufacture both API and finished dosage forms that feed the generic supply chain that ultimately determines Cost Plus’ cost floor.
For a brand manufacturer watching Cost Plus Drugs expand its catalog, the relevant question is not simply ‘what is the current cost floor for my drug after patent expiration’ but ‘where is that cost floor going as Indian and Chinese manufacturers add capacity in response to generic demand?’ The answer, historically, has been down — sometimes dramatically.
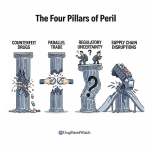
The FDA’s drug shortage database and import alert records, cross-referenced with ANDA approval data from DrugPatentWatch, give a partial picture of supply chain concentration risk. When three manufacturers supply 80% of the API for a generic drug, as is the case for some generic molecules, any disruption to that supply chain can create temporary price spikes that complicate the Cost Plus model. But over a five-year horizon, the directional trend for mature generics is cost compression, not cost inflation.
Specialty Drugs: Where the Model Has Limits
Cost Plus Drugs’ model works best for small-molecule generics with commoditized API. It works less well for biologics, biosimilars, and specialty drugs with complex manufacturing requirements. AbbVie’s adalimumab example is instructive: even after biosimilar entry, the manufacturing cost for a biologic is high enough that the Cost Plus formula — manufacturing cost plus 15% — would still produce a price that most patients cannot afford out of pocket.
Humira listed at approximately $6,900 per month at U.S. retail prices at peak [19]. The lowest-cost biosimilar currently available, Cyltezo (adalimumab-adbm), listed around $1,400 per month when it entered the market — a significant reduction, but still orders of magnitude above metformin. The manufacturing economics of biologic drugs create a different cost floor than small molecules.
For specialty pharmaceutical companies, this means that Cost Plus Drugs is not, currently, an existential competitive threat in the same way it is for commodity generic manufacturers. It is, however, a proof of concept that patients and payers are willing to use a transparent-cost model when it saves money — and that proof of concept will eventually attract capital and infrastructure investment aimed at the specialty segment.
The PBM Problem: Why Cost Plus Works and Why the Industry Hates It
To understand why Cost Plus Drugs is a competitive intelligence goldmine, you need to understand what it is disrupting — specifically, the Pharmacy Benefit Manager (PBM) model that intermediates between drug manufacturers, insurers, and pharmacies.
The three largest PBMs — CVS Caremark, Express Scripts (Cigna), and OptumRx (UnitedHealth Group) — process approximately 80% of all U.S. prescription drug claims [20]. They negotiate rebates from drug manufacturers in exchange for formulary placement. Those rebates, which the PBMs are not required to fully disclose under current law, can reach close to of drug’s list price for preferred formulary status.
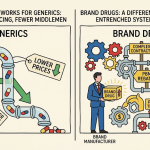
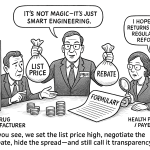
The rebate system creates a perverse incentive: PBMs earn higher rebates on higher-priced drugs. A manufacturer that keeps its list price high while offering a large rebate for preferred placement extracts more from the system than one that simply offers a lower list price. The system rewards complexity. It penalizes transparency. And it is completely invisible to the patient standing at the pharmacy counter.
Cost Plus Drugs bypasses this system entirely. It does not accept insurance, does not work with PBMs, and does not participate in rebate negotiations. Its prices are its prices. This is the source of both its appeal and its limitation: it works brilliantly for patients paying cash, and it is structurally incompatible with the insurance-based system that covers most Americans’ drug costs.
What This Means for Competitive Positioning
The PBM model’s opacity is a competitive moat for incumbent pharmaceutical companies — but only for as long as the opacity holds. The FTC’s 2024 interim report on PBM practices identified specific concerns about vertical integration between PBMs and their affiliated pharmacies, the pass-through of rebates to plan sponsors, and the impact of spread pricing on Medicaid programs [22]. Congressional pressure on PBM transparency has been bipartisan and sustained.
For pharmaceutical companies that have built their pricing strategies around the assumption that rebate opacity will persist, the relevant scenario to model is one in which PBM practices are partially reformed — requiring, for example, full pass-through of rebates to plan sponsors and patients. In that scenario, the effective price that patients and employers pay for drugs currently receiving large rebates would look much more like the list price that the manufacturer charges, not the net price after rebates. Drugs with high list prices and high rebates would see formulary positioning deteriorate as payers reoptimized.
Cost Plus Drugs has not caused this dynamic — it is a symptom of the same underlying dysfunction. But its catalog, and the price transparency it enforces, is accelerating the political and commercial pressure for reform.
Competitive Intelligence by Drug Class: A Framework
The most practical application of Cost Plus Drugs data for pharmaceutical competitive intelligence is a drug-class-level analysis. The methodology is straightforward:
First, identify every drug in a class that Cost Plus Drugs lists. Note the manufacturing cost and the listed price. Second, pull the Orange Book patent data and ANDA approval history from DrugPatentWatch for each drug in that class. Identify the date of first generic entry, the number of approved ANDAs, and any pending Paragraph IV litigation. Third, compare the Cost Plus price to current retail prices, Medicare Part D negotiated prices (for drugs subject to the Inflation Reduction Act’s price negotiation provisions), and wholesale acquisition cost (WAC) data from sources like Medi-Span or Red Book. Fourth, model the pricing trajectory for drugs in the same class that have not yet reached the Cost Plus catalog — either because they remain under patent or because generic entry is recent and API costs have not yet fully compressed.
This framework produces an actionable competitive map: where you are, where the floor is moving, and how fast.
Oncology Generics: The Next Wave
Oncology drugs represent some of the most striking examples in the Cost Plus catalog because the price delta between manufacturing cost and retail price is largest in this category. Imatinib is the headline case, but it is not alone.
Erlotinib (generic of Tarceva, used in non-small cell lung cancer) lists on Cost Plus at prices dramatically below traditional pharmacy retail. Dasatinib (generic of Sprycel, used in CML) is similar. These are drugs that were prescribed at $10,000 to $15,000 per month at brand pricing, where the generic versions’ manufacturing costs — as implied by Cost Plus pricing — are measured in tens of dollars per month.
For oncology drug manufacturers developing next-generation treatments, this context matters. Payers who are watching erlotinib generics fall to Cost Plus price levels are going to apply that reference point when negotiating access for new EGFR inhibitors. The question they will ask — and are already asking — is not ‘what does it cost you to manufacture this?’ but ‘what would this cost if it were a generic tomorrow?’ That counterfactual is no longer hypothetical. It has a public price on a website.
DrugPatentWatch’s patent cliff calendar for oncology drugs is particularly alarming for companies that have built revenue projections around current pricing. Among the oncology drugs with significant patent expirations in the 2025 to 2030 window are formulations of ibrutinib (Imbruvica, AbbVie/Janssen), palbociclib (Ibrance, Pfizer), and lenalidomide (Revlimid, Bristol Myers Squibb) [23]. Revlimid’s generic, lenalidomide, has already entered the market in 2022 under a settlement-based entry timeline — and its pricing trajectory, toward eventual Cost Plus-level pricing, has begun.
Psychiatry and Neurology: High Volume, Compressed Prices
The Cost Plus catalog includes a substantial number of psychiatric and neurological drugs — antidepressants, antipsychotics, ADHD medications, and anticonvulsants. Many of these drugs have been generic for years or decades. Their presence in the Cost Plus catalog is less analytically interesting from a patent-cliff perspective, but highly relevant for anyone competing in the specialty pharmacy or psychiatric formulary space.
Sertraline (generic Zoloft) costs approximately $6.88 for a 90-day supply at Cost Plus [10]. Escitalopram (generic Lexapro) is similarly priced. For specialty pharmacy chains that have built revenue models around dispensing psychiatric medications to patients with commercial insurance plans, the existence of a $6.88 sertraline price creates a specific competitive pressure: employer clients who discover that their employees are paying $50 or $100 co-pays for sertraline through a PBM-administered plan when they could buy it cash at Cost Plus for $6.88 are going to ask questions. Those questions will flow upward to HR benefits directors and then to plan design consultants, with predictable consequences for incumbent PBM relationships.
The Insulin Exception: Why Cost Plus Drugs Matters Most Here
No Cost Plus Drugs story is complete without discussing insulin. The company entered the insulin market with Civica Rx, a nonprofit drug manufacturer, to produce biosimilar insulin at $30 per vial — a fraction of the prices charged by Eli Lilly, Novo Nordisk, and Sanofi for their branded analog insulins [24].
Insulin pricing in the United States has been a documented scandal for two decades. The price of insulin increased approximately 700% between 1999 and 2019 [25], driven by a combination of patent strategies, manufacturing concentration among three dominant manufacturers, and a PBM rebate structure that incentivized list price increases paired with large rebates for formulary placement.
The three major insulin manufacturers responded to public pressure — and political threat — by announcing voluntary list price caps in 2023. Eli Lilly capped its out-of-pocket insulin costs at $35 per month [26]. Novo Nordisk and Sanofi followed with similar announcements. These caps came after years of the Cost Plus/Civica model demonstrating that insulin manufacturing cost is not the constraining variable in pricing — market power is.
For competitive analysts, the insulin story illustrates a specific dynamic that applies to other high-concentration therapeutic categories: when a transparent-cost competitor enters a market and demonstrates that the manufacturing cost is a small fraction of the retail price, the political and reputational risk for incumbents shifts from ‘we might lose some market share’ to ‘Congress is going to act.’ Voluntary price caps are a defensive maneuver, not an act of generosity.
What drugs are next? Look for therapeutic categories with three or fewer dominant manufacturers, high list prices, sustained evidence of patient rationing or non-adherence due to cost, and API manufacturing costs that are low relative to retail price. Diabetes technology (CGMs, insulin pumps), certain respiratory biologics, and some cardiovascular drugs share these characteristics.
The Inflation Reduction Act: A New Pricing Floor From a Different Direction
Cost Plus Drugs operates from the cost side — it demonstrates how low prices can go when margins are removed from the supply chain. The Inflation Reduction Act of 2022 operates from the demand side — it gives Medicare the authority to negotiate drug prices directly for a set of high-expenditure drugs [27].
The first 10 drugs subject to IRA negotiation were announced in August 2023. They included Jardiance (empagliflozin, Eli Lilly/Boehringer Ingelheim), Xarelto (rivaroxaban, Janssen), and Farxiga (dapagliflozin, AstraZeneca), among others [28]. The negotiated prices, which took effect in 2026, represent the first time Medicare has directly negotiated drug prices in the program’s history.
The strategic interaction between the IRA’s negotiated prices and Cost Plus Drugs’ transparent pricing is not well understood in the industry but is analytically important. The IRA’s negotiated prices create a ceiling in the Medicare market. Cost Plus Drugs’ prices create a floor for the cash-pay market. For commercially insured patients — the largest segment — neither ceiling nor floor applies directly. But both benchmarks are changing the reference points that plan sponsors, HR benefits consultants, and consumer advocates use when evaluating drug costs.
A pharmaceutical manufacturer pricing a new drug at $200,000 per year, in a category where a competing therapy’s generics will cost $200 per year within a decade, is not just making a near-term pricing decision. It is making a political statement that will be cited in the next round of Congressional hearings, the next FTC report, and the next employer benefit consultant presentation to a Fortune 500 client.
Using DrugPatentWatch Alongside Cost Plus Data: A Practical Workflow
For pharmaceutical professionals doing systematic competitive intelligence, the combination of Cost Plus Drugs’ public price list and DrugPatentWatch’s patent and litigation database creates an analytical framework that would have been impossible to construct from public sources a decade ago.
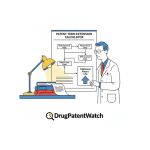
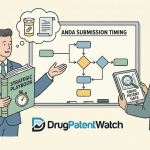
The workflow involves several steps. Start with a therapeutic area. Pull every approved ANDA for drugs in that class from DrugPatentWatch, sorted by first approval date and number of approved generics. Drugs with more than 10 approved ANDAs and more than five years since first generic entry are likely candidates for Cost Plus-style pricing pressure if they are not already listed. Next, check the Cost Plus catalog. If a drug is listed, note the manufacturing cost disclosure. If it is not listed, model what the Cost Plus price would be based on manufacturing cost estimates from published literature or from comparable drugs in the same class.
Then map the patent landscape for drugs in the same class that are still under protection. DrugPatentWatch’s Orange Book monitoring and Paragraph IV certification tracker give you a forward-looking view of generic entry timelines with considerable specificity. A drug facing 15 Paragraph IV challenges, with the first ANDA filed three years ago and the 30-month stay expiring in 18 months, is a different competitive risk than one with a clean patent portfolio through 2031.
The output is a price pressure timeline: when each drug in your competitive landscape is likely to face Cost Plus-level pricing, and what that means for your own drug’s pricing power in the years leading up to that transition.
Monitoring Orange Book Listings and Patent Expirations
The FDA’s Orange Book lists the patents associated with each approved drug product. Orange Book listings are not comprehensive — manufacturers can list patents that do not actually block generic entry, and they can list patents that are later invalidated in litigation — but they are the starting point for any patent cliff analysis.
DrugPatentWatch tracks not just the Orange Book listings but the litigation outcomes, including Paragraph IV challenge success rates, settlement terms (where public), and FDA approval timelines for challenging ANDAs. This litigation data is essential for understanding how aggressive a brand manufacturer has been in defending its patent estate — and how successful those defenses have been.
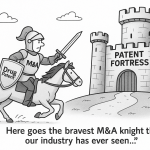
AbbVie’s defense of Humira’s patent estate is the most studied example: DrugPatentWatch documents more than 130 patents listed in the Orange Book for adalimumab across various formulations, use patents, device patents, and manufacturing patents [13]. The breadth of that patent thicket — and the litigation strategy that accompanied it — kept biosimilar competition out of the U.S. market for years. But the strategy has limits. Once patent thickets are cleared, or once biosimilar manufacturers accumulate the litigation and regulatory capital to navigate them, the underlying manufacturing economics reassert themselves.
The Employer Benefits Market: Where Cost Plus Is Actually Going
Cost Plus Drugs began as a direct-to-consumer pharmacy serving patients paying cash. But the strategic direction of the company since 2022 has been toward the employer benefits market — specifically, toward employer self-insured health plans that have both the incentive and the contractual flexibility to bypass traditional PBM arrangements for generic drugs.
In 2023, Cost Plus Drugs announced a partnership with Elevance Health (formerly Anthem) to provide drug pricing through the Cost Plus model to Elevance members [29]. This was a significant shift: from cash-pay individual transactions to employer-sponsored benefit plans with millions of covered lives. The Elevance partnership demonstrated that the Cost Plus model could scale beyond the niche of uninsured or underinsured patients and into the mainstream commercial market.
For pharmaceutical companies tracking the competitive implications, the employer benefits channel represents a different order of magnitude than the individual cash-pay market. When a self-insured employer plan with 50,000 covered employees switches its generic drug purchasing to a Cost Plus-adjacent model, the volume impact on traditional generic distributors and PBMs is substantial. Multiplied across thousands of employers, the channel shift becomes strategically significant.
The companies most exposed to this channel shift are not brand pharmaceutical manufacturers — they are specialty pharmacy operators, PBM-affiliated dispensing pharmacies, and generic manufacturers that have built distribution agreements premised on the continued opacity of the PBM model. A specialty pharmacy that has negotiated an exclusive dispensing arrangement for a high-volume generic drug with a PBM is sitting on an asset whose value is inversely correlated with Cost Plus Drugs’ growth in the employer benefits channel.
The Formulary Design Implications
Formulary design — the decision about which drugs to cover, at what tier, with what cost-sharing — is one of the most consequential decisions a health plan makes. For generic drugs, formulary tier assignment has historically been a function of PBM contracts, rebate levels, and therapeutic equivalence ratings. Cost Plus Drugs’ price transparency introduces a new variable: the cost-transparency benchmark.
A formulary designer who can see that metformin costs $4.43 to manufacture and is sold at $5.10 by Cost Plus Drugs has a different negotiating posture with a PBM than one who only knows that the PBM is offering a “preferred pricing” arrangement for metformin at $8 per 30-day supply. The transparency creates negotiating leverage — and negotiating leverage creates price compression.
For pharmaceutical companies, this has an important implication for launch strategy for new drugs. The reference point against which a new drug’s price is evaluated is no longer just the current branded competitor and the previous standard of care. It is also the Cost Plus price for the drug that the new drug will eventually displace. A drug developer launching a new SGLT2 inhibitor knows that dapagliflozin’s generic will eventually cost a few dollars per month. If the new drug cannot demonstrate efficacy differentiation sufficient to justify a price premium over that eventual generic, its commercial trajectory is constrained from day one.
The Regulatory Environment: IRA, FTC, and What Comes Next
The regulatory environment for drug pricing has shifted more in the three years since Cost Plus Drugs launched than in the previous two decades. The Inflation Reduction Act’s Medicare negotiation provisions, the FTC’s PBM investigation, bipartisan Congressional interest in drug pricing transparency, and state-level drug pricing transparency laws have collectively created a regulatory environment in which the opacity that enabled the traditional PBM model is under sustained pressure.
For pharmaceutical competitive intelligence, the relevant question is not whether regulatory change will occur — that debate is largely settled — but at what pace and through which mechanisms. The IRA’s negotiated prices affect Medicare Part D specifically; they do not directly constrain commercial market pricing. The FTC’s PBM investigation could lead to structural remedies — potentially including requirements for rebate pass-through or PBM divestiture of affiliated pharmacies — but those remedies are years away from implementation even in a favorable regulatory environment.
The shorter-term competitive implication is reputational and political rather than directly economic: pharmaceutical companies that are visibly profiting from the opacity that Cost Plus Drugs is dismantling face a different political risk profile than they did before January 2022. Congressional testimony citing the Cost Plus price for a drug alongside the retail price has become a standard rhetorical move in drug pricing hearings. That move is effective precisely because the Cost Plus price is public, verifiable, and shocking to people who did not previously know what drug manufacturing costs.
State-Level Transparency Laws
Alongside federal action, a growing number of states have enacted drug pricing transparency laws requiring manufacturers to report on price increases, R&D spending rationales for high-priced drugs, and supply chain cost components [30]. California, Colorado, Maine, and Oregon have among the most comprehensive such requirements.
The state-level data, when combined with Cost Plus Drugs’ voluntary cost disclosures and DrugPatentWatch’s patent timeline data, creates a richer picture of drug pricing economics than any single source alone provides. For a competitive intelligence analyst tracking a specific drug or therapeutic category, integrating these data sources — federal Orange Book data, state transparency filings, and Cost Plus manufacturing cost disclosures — produces a significantly more accurate model of a drug’s long-term pricing trajectory than relying on WAC data alone.
Biosimilars: The Next Frontier for Cost Plus-Style Disruption
The Cost Plus model’s application to biologics and biosimilars is the most consequential near-term frontier for pharmaceutical competitive intelligence. Biosimilars have had a difficult commercial history in the United States — multiple approved biosimilars have failed to capture meaningful market share because PBM formulary structures and manufacturer rebate strategies effectively blocked their uptake [31].
The adalimumab market is the test case. Between July 2023 and early 2024, seven Humira biosimilars received FDA approval and entered the U.S. market. Despite the availability of lower-priced alternatives, Humira maintained a substantial market share through PBM rebate agreements that placed it on preferred formulary tiers and effectively penalized biosimilar substitution [32].
Cost Plus Drugs has not yet entered the adalimumab biosimilar market at the time of writing. Civica Rx, the nonprofit manufacturer that partners with Cost Plus for insulin, has expressed interest in biosimilar manufacturing for additional products. If a Cost Plus-Civica partnership were to produce a transparently-priced adalimumab biosimilar, the competitive impact on AbbVie’s Humira franchise — which still generated approximately $14 billion in global revenue in 2024 despite biosimilar entry [33] — would be a function not of manufacturing cost but of formulary access and PBM negotiating dynamics.
This is the core tension in the biosimilar market: the Cost Plus model demonstrates that price transparency can work for small-molecule generics, but the PBM formulary system creates structural barriers that prevent transparent pricing from translating into market share for biosimilars. Resolving that tension requires either regulatory intervention (formulary transparency requirements, biosimilar substitution mandates) or market structure change (employer plans bypassing PBMs for biosimilar purchasing, as some large self-insured employers have begun to do).
The International Price Comparison Problem
One persistent challenge in pharmaceutical competitive intelligence is the difficulty of comparing U.S. drug prices to prices in other developed markets. The PBM rebate opacity that makes U.S. list prices unreliable also makes international comparisons analytically treacherous: a U.S. list price of $200 per month with a 60% rebate is effectively $80, which may be comparable to an ex-U.S. regulated price of $75 — or may not, depending on what other value-based components are in the international pricing framework.
Cost Plus Drugs’ manufacturing cost disclosures partially solve this problem. Manufacturing costs for small-molecule generics are largely independent of regulatory jurisdiction. API from an Indian manufacturer costs roughly the same whether the tablet is ultimately sold in the United States, Germany, or Japan. When Cost Plus discloses a manufacturing cost of $14.87 for imatinib, that figure is a global benchmark — it is what the drug costs to make, not what any particular market system prices it at.
This makes Cost Plus data useful for international competitive intelligence as well. A company evaluating the pricing trajectory of an oncology drug in multiple markets can use Cost Plus manufacturing cost data as a lower bound for the cost-of-goods-sold component of any market’s eventual generic pricing — and can model the timeline to that floor in each market based on local patent expiration and generic entry data.
What Smart Competitors Are Actually Doing With This Data
The pharmaceutical companies that have responded most effectively to the Cost Plus Drugs competitive environment are not the ones trying to compete directly on price in the generic space — that is a battle they cannot win by definition. They are the ones using the Cost Plus data as a strategic planning input in three specific ways.
The first is portfolio triage. Companies with large generic drug portfolios are using Cost Plus pricing as a signal to identify drugs that are candidates for divestiture or de-emphasis. If a drug in your portfolio is approaching Cost Plus pricing levels — either because it is already listed, or because the patent cliff analysis suggests it will be within 24 months — the margin contribution from that drug will compress regardless of what you do. Holding that product in the portfolio longer than necessary ties up commercial and operational resources that could be deployed elsewhere.
The second is pricing defense preparation. For brand manufacturers with drugs approaching patent expiration, the Cost Plus price for comparable generics gives a concrete target for the ‘authorized generic’ strategy — a brand manufacturer launching its own generic at patent expiration to capture market share before competition drives prices to the Cost Plus floor. The economics of an authorized generic strategy are defensible only if the entry price is competitive with the eventual market floor, not just with the first wave of generic competitors.
The third is innovation investment prioritization. At board level, the Cost Plus data is increasingly being used to make the case for R&D investment in areas where differentiation — and therefore pricing power — can be maintained. Drugs with durable clinical differentiation, orphan disease designations, or mechanism-of-action novelty that is genuinely difficult to replicate maintain pricing power beyond the generic entry point. Drugs that are ‘me-too’ in mechanism but first in timing face a different trajectory: the Cost Plus floor is visible on the horizon from day one of commercial launch.
Building the Competitive Intelligence Stack
For pharmaceutical professionals serious about using Cost Plus Drugs data as a competitive intelligence input, the practical toolkit involves layering several data sources:
The Cost Plus Drugs price list, updated regularly at costplusdrugs.com, provides the manufacturing cost and current price for every drug in the catalog. This is the foundation layer — the cost floor reference for any drug in the catalog, and a signal for what is coming for drugs not yet listed.
DrugPatentWatch provides Orange Book patent data, Paragraph IV certification tracking, litigation outcomes, and ANDA approval timelines. For any drug in the Cost Plus catalog or approaching generic entry, DrugPatentWatch is the tool for understanding how that drug got to its current market position and when comparable drugs will follow. The combination of Cost Plus pricing data and DrugPatentWatch patent timelines creates a remarkably complete picture of the generic pharmaceutical landscape.
The FDA’s Orange Book (accessdata.fda.gov/scripts/cder/ob/) provides official patent and exclusivity data, cross-referenced against DrugPatentWatch for litigation history. IQVIA market share data, where accessible, provides the volume context for pricing analysis. And state drug pricing transparency databases — for states with reporting requirements — provide the cost structure disclosures that manufacturers must make under state law.
The output of combining these sources is not just a snapshot of where drug prices are today. It is a forward-looking model of where they are going — which is the only kind of competitive intelligence that actually changes decisions.
The Limits of the Model: What Cost Plus Drugs Cannot Tell You
Any analytical framework has limits, and intellectual honesty requires acknowledging them.
Cost Plus Drugs’ manufacturing cost disclosures are based on the company’s specific sourcing arrangements. Its purchasing scale — substantial but not comparable to the largest generic manufacturers or PBMs — means that its disclosed costs may not reflect the absolute lowest achievable manufacturing cost at maximum scale. A generic manufacturer producing 10 billion tablets annually will have API sourcing power and manufacturing efficiency that Cost Plus cannot match. The Cost Plus cost floor may, in some categories, be higher than the true competitive floor.
The model also does not capture the full cost of bringing a generic drug to market. FDA ANDA filing costs, bioequivalence study costs, and regulatory compliance costs are real — they are simply modest relative to the retail prices Cost Plus is disrupting. For a manufacturer with a single ANDA in a small-volume drug category, the economics may look different than Cost Plus’s catalog-level disclosure suggests.
And Cost Plus Drugs’ model is entirely a cash-pay, direct-to-consumer model. It does not tell you anything specific about how a drug is priced within the PBM-administered commercial insurance channel, which remains by far the largest channel for drug purchasing in the United States. The signal it sends is about market direction and cost structure — it is not a substitute for channel-specific competitive intelligence.
The Political Economy of Transparency
Mark Cuban did not build Cost Plus Drugs as a competitive intelligence tool. He built it as a business — one that he explicitly designed to expose and profit from what he has called a ‘corrupt’ pharmaceutical pricing system [34]. The competitive intelligence utility of the company’s public pricing data is a byproduct of that transparency mission.
But the political economy of what Cost Plus Drugs has created is significant beyond the business itself. By making drug manufacturing costs public — and by making the comparison between those costs and retail prices visible to consumers, journalists, and policymakers — Cost Plus has changed the terms of the drug pricing debate in ways that are difficult to reverse.
Before January 2022, a pharmaceutical executive defending a drug’s price could point to the complexity of the supply chain and the opacity of rebate structures as reasons why a simple cost-plus calculation was not appropriate for drug pricing. That defense is now much harder to make for generic drugs. The Cost Plus catalog demonstrates, publicly and specifically, that for hundreds of drugs the manufacturing cost is a small fraction of the retail price and that the supply chain margin structure — not R&D cost recovery — is driving the gap.
For brand manufacturers defending the prices of drugs still under patent, the Cost Plus comparison is also increasingly uncomfortable. ‘Our drug costs $12,000 per month; the generic will cost $12 per month once our patent expires’ is a statement that is now routinely made in formulary negotiations, in state legislative testimony, and in employer benefit consultant presentations. The generic price — on the Cost Plus model — is no longer hypothetical. It is arithmetic.
Strategic Recommendations: What Pharmaceutical Professionals Should Do Now
For brand pharmaceutical manufacturers: conduct a Cost Plus price audit of your entire commercial portfolio. For every drug you sell, determine whether a generic is listed on Cost Plus, and if so, what the implied manufacturing cost and timeline to competitive pressure looks like. For drugs within 36 months of patent expiration, model the authorized generic economics against the Cost Plus floor, not just against the first-wave generic competitors.
For specialty pharmacy operators: the drugs in your dispensing mix that overlap with the Cost Plus catalog are assets whose value is declining at a quantifiable rate. The appropriate response is not to pretend the catalog does not exist but to model the channel shift timeline and reallocate operational resources toward drug categories where Cost Plus competition is structurally limited (complex biologics, specialty injectables, cold-chain products, and drugs requiring pharmacist-level patient management services).
For payers and plan sponsors: the Cost Plus catalog is a free formulary design benchmark. For every generic drug in your formulary, comparing your current member cost-sharing against the Cost Plus price is a straightforward quality check on whether your PBM arrangement is delivering competitive value. Where the gap is large, you have a negotiating data point.
For pharmaceutical investors: the companies most exposed to Cost Plus-style competitive pressure are those with large revenue contributions from mature generics priced substantially above the Cost Plus floor, and those with brand drugs approaching patent expiration in categories where generic entry historically produces rapid cost compression. The Cost Plus catalog, read alongside DrugPatentWatch’s patent cliff calendar, is an early warning system for where revenue compression is coming.
Key Takeaways
Cost Plus Drugs’ public manufacturing cost disclosures function as a reverse-engineering tool for pharmaceutical competitive intelligence. The gap between its disclosed cost and retail prices is a measure of supply chain margin extraction — not manufacturing cost variation.
The most analytically useful application is cross-referencing Cost Plus prices with DrugPatentWatch’s patent expiration and Paragraph IV litigation data to build a forward-looking model of where pricing compression is heading in a given therapeutic area.
The PBM rebate system’s opacity has historically insulated branded and high-priced generic drugs from cost-based competition. Cost Plus Drugs’ transparency mission is accelerating the political and commercial pressure for PBM reform — with specific implications for drugs priced substantially above their manufacturing cost floor.
Oncology generics, mature psychiatric drugs, and high-volume primary care generics represent the categories with the largest current gap between Cost Plus pricing and retail pricing — and the highest near-term competitive pressure from Cost Plus-adjacent models entering the employer benefits channel.
The model has real limits: it does not apply directly to biologics and biosimilars, it reflects a specific sourcing scale, and it does not capture channel-specific PBM pricing dynamics. But as a directional indicator of cost-floor pricing for mature small-molecule generics, it is the most transparent data source currently available in public markets.
Pharmaceutical executives who have not yet incorporated Cost Plus pricing into their competitive intelligence infrastructure are working from an incomplete picture of where their market is going.
FAQ
1. Can Cost Plus Drugs’ pricing model actually scale to replace traditional pharmacy benefit management for most Americans?
Not in its current form. Cost Plus Drugs operates as a cash-pay, direct-to-consumer model that bypasses insurance entirely. This works well for patients with high-deductible plans or no insurance, and it is increasingly attractive to self-insured employers for generic drugs. But the model does not currently address the insurance adjudication infrastructure that processes claims, manages formularies for hundreds of thousands of drugs, and handles the coordination between prescribers, payers, and dispensers. The more likely trajectory is that Cost Plus pricing benchmarks enter the employer benefits channel through direct contracting arrangements — as the Elevance Health partnership suggests — rather than Cost Plus Drugs itself becoming a universal pharmacy benefit solution. The disruption is real; it is incremental rather than revolutionary.
2. How do I know if Cost Plus Drugs’ disclosed manufacturing costs are accurate and comparable across drugs?
You cannot independently verify them with certainty, but there are cross-checks available. Published API pricing from Indian and Chinese manufacturers (available through platforms like Chemanalyst and the Indian Chemical and Petrochemical Manufacturers Association), IQVIA data on generic drug cost structures, and academic literature on manufacturing cost components for specific drug classes all provide reference ranges against which Cost Plus disclosures can be validated. In practice, Cost Plus’ disclosed costs are generally consistent with industry manufacturing cost estimates for comparable molecules — the company has a strong reputational interest in accuracy, since any significant inflation of ‘manufacturing costs’ to protect margins would be visible and destructive to its brand positioning.
3. How should a brand pharmaceutical company respond when a competitor starts comparing their drug’s retail price to the eventual Cost Plus generic price in sales conversations?
The most effective response is clinical, not economic: if the brand drug has differentiated efficacy, safety profile, convenience, or indication scope relative to generic alternatives, that differentiation is the appropriate competitive ground. Defending a price premium on purely economic grounds — arguing that supply chain costs justify the gap — is increasingly untenable in the Cost Plus era. The most exposed brands are ‘me-too’ drugs with no meaningful clinical differentiation from their eventual generic competitors; for those, the Cost Plus comparison is accurate and the strategic response is either lifecycle management (reformulation, new indications, combination products) or managed portfolio transition.
4. What is the relationship between Cost Plus Drugs’ model and the Inflation Reduction Act’s Medicare price negotiation provisions?
They operate through different mechanisms but are directionally aligned. The IRA’s negotiated prices create a government-set ceiling in the Medicare market for specific high-expenditure drugs; Cost Plus creates a market-set floor in the cash-pay market for generics. The strategic interaction is indirect: IRA negotiated prices apply to drugs still under manufacturer control (brand drugs and biosimilars in their exclusivity periods), while Cost Plus pricing applies primarily to drugs post-patent expiration. But both create pressure against high drug prices from different directions, and together they are changing the reference frame against which all drug prices are evaluated by payers, employers, and policymakers. The companies caught in the middle — brand drugs approaching the end of exclusivity, or drugs subject to both IRA negotiation and impending generic competition — face the most compressed pricing environment in the history of the U.S. pharmaceutical market.
5. Is there a risk that Cost Plus Drugs’ competitive pressure could actually reduce pharmaceutical innovation by compressing margins?
This is the pharmaceutical industry’s standard response to all drug pricing reform proposals, and it deserves a precise answer. Cost Plus Drugs competes in the generic market — drugs that have already completed their period of market exclusivity during which R&D cost recovery occurs. The margin compression that Cost Plus introduces is occurring after the innovator company has already had, typically, 10 to 20 years of protected pricing. The argument that generic price compression reduces innovation incentives conflates the economics of the brand market with the economics of the generic market. The more accurate concern is that Cost Plus pricing benchmarks, adopted as reference points in brand drug formulary negotiations and IRA price-setting, could reduce expected returns on future innovation — but that transmission mechanism is indirect and subject to the policy design of programs like the IRA, which explicitly exempts small biotech companies from negotiation in their early years to protect innovation incentives. The empirical evidence on the relationship between drug pricing policy and pharmaceutical R&D investment is contested and context-dependent; it is not a settled argument in either direction.
References
Mark Cuban Cost Plus Drug Company. (2022). About our pricing. costplusdrugs.com. Retrieved from https://costplusdrugs.com/about/
Mark Cuban Cost Plus Drug Company. (2025). Imatinib pricing. costplusdrugs.com.
Hernandez, I., Good, C. B., & Shrank, W. H. (2020). The price of imatinib in the United States over time. JAMA Internal Medicine, 180(9), 1258–1259. https://doi.org/10.1001/jamainternmed.2020.1871
Mark Cuban Cost Plus Drug Company. (2025). Drug catalog. costplusdrugs.com.
Gupta, R., Kesselheim, A. S., Downing, N., Greene, J., & Ross, J. S. (2017). Generic drug approvals since the 1984 Hatch-Waxman Act. JAMA Internal Medicine, 177(1), 124–125.
Grabowski, H., Long, G., & Mortimer, R. (2014). Recent trends in brand-name and generic drug competition. Journal of Medical Economics, 17(3), 207–214.
Iqvia. (2023). Medicine use and spending in the U.S.: A review of 2022 and outlook to 2027. IQVIA Institute for Human Data Science.
Sagonowsky, E. (2023, July). After years of delay, U.S. Humira biosimilar launches could finally be about to take off. Fierce Pharma.
Cubanski, J., & Neuman, T. (2021). Prices for brand-name drugs under selected federal programs. USC Schaeffer Center for Health Policy and Economics / KFF.
American Diabetes Association. (2024). Standards of care in diabetes — 2024. Diabetes Care, 47(Suppl. 1), S1–S321.
Centers for Disease Control and Prevention. (2024). National diabetes statistics report. U.S. Department of Health and Human Services.
U.S. Food and Drug Administration. (2023). Drug imports from India and China: Supply chain overview. FDA Drug Shortages Task Force.
AbbVie Inc. (2022). 2022 annual report. North Chicago, IL: AbbVie.
Federal Trade Commission. (2024). Pharmacy benefit managers: The powerful middlemen inflating drug costs and squeezing main street pharmacies (Interim Staff Report). Washington, DC: FTC.
Federal Trade Commission. (2024). Pharmacy benefit managers: The powerful middlemen inflating drug costs and squeezing main street pharmacies. Washington, DC: FTC.
Civica Rx. (2023). Civica Rx and Mark Cuban Cost Plus Drug Company to produce biosimilar insulin [Press release].
Herkert, D., Vijayakumar, P., Luo, J., Schwartz, J. I., Rabin, T. L., DeFilippo, E., & Lipska, K. J. (2019). Cost-related insulin underuse among patients with diabetes. JAMA Internal Medicine, 179(1), 112–114.
Eli Lilly and Company. (2023, March 1). Lilly caps insulin out-of-pocket costs at $35 a month [Press release]. Indianapolis, IN: Eli Lilly.
Inflation Reduction Act of 2022, Pub. L. No. 117-169, 136 Stat. 1818 (2022).
Centers for Medicare & Medicaid Services. (2023, August 29). HHS selects the first drugs for Medicare drug price negotiation [Press release]. Washington, DC: CMS.
Elevance Health. (2023). Elevance Health and Mark Cuban Cost Plus Drug Company announce collaboration [Press release].
National Academy for State Health Policy. (2024). State drug pricing laws: A 50-state survey. NASHP.
Sarpatwari, A., Choudhry, N. K., Makanji, S. S., & Kesselheim, A. S. (2019). Challenges and opportunities for increasing biosimilar uptake in the United States. Health Affairs, 38(9), 1505–1513.
Yoo, S., & Davio, K. (2024). Humira biosimilars capture 25% market share. The American Journal of Managed Care.
AbbVie Inc. (2025). 2024 annual report and fourth quarter financial results. North Chicago, IL: AbbVie.
Cuban, M. (2022, January 19). Why I started a pharmacy [Interview]. CNBC Squawk Box.