When Paragraph IV filings hit the docket, they set off a chain of financial events most analysts only half-understand. Here is the quantitative framework that separates the guesswork from the signal.
The ledger of pharmaceutical patent disputes is not just a legal record. It is one of the most data-rich sources of commercial intelligence in the drug industry, encoding the settlement terms, judicial tendencies, and revenue-protection strategies of every major innovator company from AbbVie to Pfizer to Merck. For pharma IP teams and institutional investors alike, parsing this data is what separates anticipatory positioning from reactive surprise.
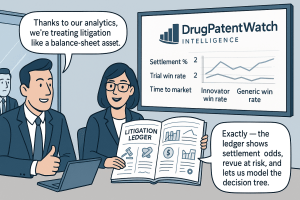
In 2024, innovator companies prevailed on contested issues in approximately 20% of terminated Hatch-Waxman litigations, while generic challengers prevailed in only 2% of cases that did not end in settlement or procedural dismissal. Yet settlements accounted for 39% of all resolutions the same year. That gap between expected trial outcomes and the rate at which cases actually settle is where the strategic analysis has to start.
This guide integrates Hatch-Waxman mechanics, PTAB success rates, FTC settlement data through fiscal year 2021, financial modeling frameworks, and NLP-driven patent text analysis into a single reference for anyone modeling pharmaceutical IP risk. Every section targets a distinct cluster of analytical questions that investors, IP teams, and strategy consultants are actually searching for.
What the Hatch-Waxman Framework Actually Does to Revenue
The Drug Price Competition and Patent Term Restoration Act of 1984 is the legal architecture governing nearly every generic challenge to a small-molecule drug in the United States. Its design is not neutral. It simultaneously creates the mechanism for price competition and the tools to delay it, leaving the final outcome a function of which party uses those tools more effectively.
The ANDA pathway lets a generic manufacturer reference the brand’s existing clinical data, stripping away the cost and timeline of independent clinical trials. That single design choice is what makes the economics of generic entry financially viable in the first place. The commercial consequence: any drug with significant annual sales will face an ANDA challenge well before its primary composition of matter patent expires.
How the Paragraph IV Certification Triggers a Financial Clock
When a generic firm files a Paragraph IV (PIV) certification, it asserts that each patent listed in the FDA’s Orange Book for the relevant drug is either invalid, unenforceable, or will not be infringed by the proposed generic formulation. The statute treats this certification as a technical “artificial act of infringement,” creating a cause of action for the brand even before a single generic tablet has been produced.
The 45-day window from PIV notice to lawsuit filing matters because it activates the 30-month stay automatically. No motion practice, no preliminary injunction standard to meet. The brand files suit, the stay issues, and the FDA cannot grant final ANDA approval for up to 30 months. For a drug generating $100 million per month, that statutory protection is worth up to $3 billion in preserved revenue before a judge renders a single opinion on the merits.
The generic’s prize for initiating that challenge, assuming it was the first to file a substantially complete ANDA, is 180-day exclusivity. During that window the FDA cannot approve a second generic, meaning the first-filer competes only with the brand and any authorized generic. For blockbuster drugs, that 180-day period routinely generates $80 to $400 million in gross profit depending on drug revenue, pricing strategy, and whether the brand launches an authorized generic.
Revenue Context
AbbVie’s Humira held patent protection via a thicket of over 100 patents, delaying U.S. biosimilar competition from 2016 to January 2023 despite the original composition of matter patent expiring years earlier. The company generated an estimated $21.2 billion in Humira sales in 2022 alone, the final year of full U.S. exclusivity. The cost to biosimilar developers — Sandoz, Boehringer Ingelheim, Coherus, Organon, Pfizer, Amgen, and others — of that extended delay was measured in foregone revenue, not just litigation expense.
Why the 30-Month Stay Is the Most Valuable IP Asset Most Analysts Undercount
Legal commentaries treat the 30-month stay as a procedural feature. Financial models should treat it as a revenue asset with a calculable present value. At any annual revenue run rate, the stay provides a probability-weighted certainty of income that the brand can use to fund lifecycle management, settle on favorable terms, or exhaust a weaker challenger before trial.
The filing-the-suit decision is almost never genuinely contested at the brand level, because the expected value of the stay is nearly always positive. The real strategic decision for brand companies is how to structure the ensuing litigation to maximize the probability of either winning outright or extracting a favorable settlement during the stay period.
Why Innovator Patents Win at Trial More Often Than Generic Challengers Expect
The empirical record is consistent: when Hatch-Waxman cases reach a final merits decision, patent owners prevail more often than challengers. In 2024, generics prevailed on contested issues in 2% of terminated litigations, not 50%. This outcome distribution is not what a naive reading of the PTAB institution rate would suggest, and understanding the gap is material to any litigation strategy model.
The PTAB Versus District Court Divergence in Pharma Patent Outcomes
The Patent Trial and Appeal Board institutes inter partes review (IPR) on approximately 62% of petitions involving Orange Book-listed patents. That high institution rate reflects the lower evidentiary threshold for IPR: a petitioner need only show a reasonable likelihood of prevailing on at least one claim. District court invalidity rulings require proof by clear and convincing evidence. The divergence in standards is one reason brand companies have increasingly sought to stay district court proceedings pending PTAB outcomes when the PTAB calculus favors them, and why generic firms favor IPR as a parallel track when facing a strong composition of matter patent.
Appealing adverse outcomes to the Federal Circuit improves matters very little for either side. The court affirmed lower tribunal decisions at a 73% to 81% rate in 2024. Patent owners appealing an adverse district court ruling faced an outright reversal rate well under 10%. Patent owners appealing adverse PTAB decisions succeeded on full reversal in approximately 13% of cases. The practical implication: a brand that loses at the PTAB on a core formulation patent should model the probability of Federal Circuit reversal at roughly 13%, not 50%.
Forum
Challenging Party
Full Win Rate
Key Threshold
U.S. District Court (ANDA)
Generic (defendant)
~2% (contested issues, 2024)
Clear and convincing evidence for invalidity
PTAB (IPR petition)
Generic (petitioner)
~62% institution rate; lower on final written decision
Reasonable likelihood standard at institution
Federal Circuit (appeal from D. Ct.)
Patent owner (appellant)
<10% outright reversal
73–81% affirmance rate overall
Federal Circuit (appeal from PTAB)
Patent owner (appellant)
~13% full reversal
Complete loss ~75% of outcomes
What Judges in the District of Delaware Mean for Pharma Patent Outcomes
The District of Delaware handles a disproportionate share of ANDA litigation because major pharma defendants are incorporated there. The assigned judge is among the most statistically significant variables in outcome prediction models. Lex Machina data shows that claim construction rulings from the same judge in similar technology areas predict the direction of ANDA outcomes more reliably than almost any other factor. A brand facing a Delaware judge who has historically narrowed formulation claims by 40 points should model that prior art risk differently than one facing a judge whose construction record is brand-favorable.
The District of New Jersey is the second major venue. Together, D. Del. and D.N.J. account for the bulk of branded drug patent litigation. Any financial model that treats “jurisdiction” as a binary or ignores judge-specific track records is leaving material predictive signal on the table.
How Patent Thickets Work and Why They Delay Biosimilar and Generic Entry
A patent thicket is not an incidental feature of pharmaceutical IP management. It is the principal strategy deployed by innovator companies with blockbuster assets to extend effective market exclusivity beyond the composition of matter patent expiry date. The mechanics are straightforward; the execution requires sustained R&D investment in lifecycle modifications.
Why AbbVie’s Humira Patent Strategy Lasted as Long as It Did
Humira (adalimumab) became the canonical example of a successful patent thicket. By the time biosimilar manufacturers began clearing IP before the AbbVie-negotiated 2023 U.S. launch date, the brand had secured over 100 patents covering the antibody formulation, concentration, citrate-free formulation, manufacturing processes, dosing devices, and delivery methods. Each patent family represented a new litigation track a biosimilar developer had to assess. AbbVie litigated some, settled others, and extracted licensing agreements with Amgen, Sandoz, Mylan, and all major biosimilar entrants that set U.S. launch dates no earlier than January 2023 — seven years after the initial European patent expiry.
The financial result: Humira’s cumulative U.S. sales between 2016 and 2022 exceeded $140 billion. The cost to AbbVie of maintaining the thicket — prosecution fees, litigation costs, and ongoing R&D for new formulations — was a fraction of that figure. For investors who understood the thicket structure, the 2023 LOE date was visible years in advance. Those who modeled only the composition of matter expiry misread AbbVie’s revenue protection by seven years.
What Makes Evergreening Economically Rational Despite Regulatory and Legal Scrutiny
Evergreening — filing secondary patents as primary patents approach expiry — is attacked as anti-competitive by payer advocates and occasionally challenged by generic firms, but it persists because the expected value calculation is strongly positive for most branded drugs. Filing a new patent on a modified formulation or delivery device costs far less than a generic erosion scenario that begins three years earlier. Even if a secondary patent is ultimately invalidated in litigation, the 30-month stay it triggers while the case proceeds extends brand revenue during the dispute.
Method-of-use patents represent a related and increasingly litigated class. These patents cover specific therapeutic applications rather than the molecule itself, creating carve-out opportunities for generic labeling but also sustaining brand revenue in the patented indications. The Federal Circuit’s treatment of skinny-label strategies — where a generic omits a patented indication from its labeling to avoid infringement — has evolved through cases involving GlaxoSmithKline’s Coreg (carvedilol) and other products, leaving ongoing ambiguity that brand and generic IP teams are both actively modeling.
Why Manufacturing Complexity Creates a Separate Moat for Biologics
For biologics, the patent thicket is only one layer of protection. Manufacturing complexity adds a second. Monoclonal antibodies, fusion proteins, and complex biologics require cell line development, fermentation process optimization, purification train design, and analytical characterization work that takes years and hundreds of millions of dollars to replicate. Even a biosimilar developer that clears the IP does not automatically have the process science to produce an analytically comparable product.
This manufacturing moat partially explains why biosimilar price erosion in the United States has been slower than in Europe. European biosimilar markets began earlier, feature more streamlined regulatory pathways, and have stronger formulary substitution mechanisms. U.S. biosimilar markets for adalimumab, etanercept, and bevacizumab showed initial price erosion of 20–30%, compared to 70–80% in European reference markets years after first biosimilar entry. The combination of IP complexity, manufacturing barriers, and interchangeability designation requirements creates a structural delay that purely legal analyses miss.
FTC v. Actavis and How Pharmaceutical Patent Settlements Changed After 2013
Before the Supreme Court’s June 2013 ruling in FTC v. Actavis, large cash payments from brand companies to generic challengers in exchange for delayed entry — what the FTC termed “pay-for-delay” or “reverse payment” settlements — were common and legally defensible as long as generic entry was not delayed beyond patent expiry. Actavis ended the broad antitrust immunity these settlements had enjoyed.
What the Actavis Rule-of-Reason Standard Means for Settlement Valuation
The Court held that a large, unjustified reverse payment is itself evidence of patent weakness — that a brand paying a generic to stay out of the market is implicitly acknowledging that the generic might win. It did not make all settlements illegal, but it required that large cash payments be evaluated under the rule of reason, a fact-intensive balancing test that creates antitrust litigation risk for both settling parties.
The practical effect was swift. Explicit large cash payments effectively disappeared from FTC-reviewed settlements within two years of the ruling. The number of potential pay-for-delay settlements flagged by the FTC dropped from a peak of 40 in fiscal year 2012 to single digits by fiscal year 2015. But the incentive structures that made these settlements economically rational for both parties did not disappear. They migrated into less visible forms of value transfer.
How Settlement Terms Evolved: Quantity Restrictions, No-AG Clauses, and Side Deals
FTC analysis of fiscal years 2018 through 2021 documents the transition clearly. Between those four years, 23 settlements included quantity restrictions — provisions limiting the volume of generic product the challenger could sell for a defined period after market entry. These restrictions function as market allocation: the generic enters but cannot capture full demand, preserving elevated prices for longer. Quantity restrictions are harder to quantify as antitrust harm because calculating the counterfactual competitive price requires market modeling rather than simply identifying a cash payment.
No-authorized-generic (no-AG) commitments became a primary settlement currency between approximately 2005 and 2015. A no-AG agreement is a brand’s commitment not to launch its own authorized generic during the first-filer’s 180-day exclusivity. Since an authorized generic directly competes with the first-filer’s product and has been shown to reduce the first-filer’s revenues by 40–52% during exclusivity, a no-AG promise has a concrete, calculable financial value that the FTC has treated as potentially equivalent to cash.
Post-Actavis, no-AG clauses have been replaced by declining royalty structures that financially disincentivize the brand from launching an AG without explicitly prohibiting it. A declining royalty that drops to zero in the first 90 days of exclusivity effectively achieves the same result while being structurally less visible to antitrust reviewers. Similarly, some settlements grant the generic an accelerated launch right in a foreign jurisdiction, effectively transferring value outside U.S. market bounds where FTC oversight is more limited.
Settlement Feature
FY 2018
FY 2019
FY 2020
FY 2021
Antitrust Visibility
Total settlements filed
245
194
205
199
N/A
Settlements with no compensation
169
145
170
152
Low
Litigation fees only
27
18
17
21
Low (≤$7M safe harbor)
Possible compensation (quantity restrictions)
5
5
1
5
High
Possible compensation + litigation fees
9
5
2
12
High
Settlements involving PTAB proceedings
11
6
3
7
Moderate
Settlements with acceleration provisions
174
149
154
166
Low–Moderate
The $7 million threshold for litigation cost payments functions as an informal safe harbor. Consent decrees in prior FTC enforcement actions have not challenged payments below this level as presumptively anticompetitive. Settlements that pay between $7 million and $30 million in litigation costs while also granting quantity restrictions or favorable entry dates sit in ambiguous territory and warrant closer antitrust analysis by both settling parties and third-party monitors.
What an At-Risk Launch Signals About a Generic Firm’s Legal Confidence
An at-risk launch is a generic company beginning commercial sales after FDA approval while patent litigation remains unresolved. It is the clearest behavioral signal available in public litigation data that a generic challenger believes its legal position is strong enough to absorb potential damages exposure. Studying at-risk launch frequency and outcomes across a portfolio of historical cases provides one of the most direct windows into how experienced litigators price patent risk.
How the Protonix At-Risk Launch Became the Industry’s Largest Damages Settlement
When Teva and Sun Pharmaceutical launched pantoprazole (generic Protonix) at risk in 2007 following FDA approval, the product generated substantial revenues before the litigation concluded. A jury ultimately found in favor of Wyeth and Nycomed on patent validity and infringement. The settlement figure — $2.15 billion — set a record for pharmaceutical patent damages that stood for years. The Protonix outcome has since become the anchor case in risk quantification discussions: at-risk launch on a blockbuster drug without an overwhelmingly strong non-infringement argument can translate to multi-billion dollar liability.
The Tarka (trandolapril/verapamil) at-risk launch by Glenmark produced a damages award of $16 million, reflecting a far smaller market. The two cases together illustrate a core principle for financial modeling: at-risk damages are proportional to drug revenue, brand profit margin, and the duration of the at-risk period. The damages model inputs are the brand’s but-for profits, not the generic’s revenues — a distinction that has significant implications for sizing exposure.
How to Identify At-Risk Launch Probability from Docket Events
The docket sequence leading to an at-risk launch typically includes: a favorable Markman ruling on a key claim, denial of the brand’s motion for a preliminary injunction, and FDA approval of the ANDA with no further stay. Each of these events narrows the legal uncertainty and raises the expected value of early launch relative to waiting. Analytics platforms that score docket events in real time can flag when these conditions are accumulating for a specific case, giving both brand teams and market analysts advance notice of a probable at-risk entry within a defined timeframe.
Building a Predictive Model for Paragraph IV Litigation Outcomes
Supervised machine learning applied to a structured database of resolved Hatch-Waxman cases can produce probability estimates for key litigation milestones. This is not theoretical. Academic studies and commercial platforms have demonstrated predictive accuracy in the 65–73% range for binary invalidity outcomes using only patent text and litigation metadata as input features. For practitioners with access to full docket-level data, accuracy rises further.
Which Variables Have the Most Predictive Power in Hatch-Waxman Outcome Models
Drug annual sales is consistently the strongest predictor of whether a PIV challenge will be filed at all. Above roughly $250 million in annual U.S. sales, the probability of a PIV challenge exceeds 90%. Below $50 million, few generic firms find the economics of the 180-day exclusivity period compelling enough to absorb litigation costs. This threshold effect means that patent portfolio risk is concentrated in the high-revenue tail of a brand company’s product portfolio — usually a small number of drugs generating 60–80% of total branded revenues.
Patent family size predicts both the likelihood of challenge and, inversely, the likelihood that any single challenge will succeed. A large family indicates higher perceived commercial value (the innovator invested in international prosecution) and a more complex thicket for the challenger to navigate. Number of backward citations is a proxy for how crowded the prior art landscape is — high citation counts suggest the invention sits in a heavily developed field where obviousness arguments are more feasible. Number of forward citations, received from subsequent patents and papers, indicates technological importance and often correlates with brand-favorable outcomes.
The assigned judge is one of the most practically actionable variables in the model. Lex Machina data quantifies each judge’s historical rate of adopting narrow versus broad claim constructions, granting summary judgment on non-infringement, and finding patents invalid on obviousness grounds. For a brand or generic team running pre-suit venue analysis, this judge-level data can shift the expected probability of a favorable claim construction by 15–25 percentage points depending on the assigned jurist.
Predictive Variable
Direction of Effect on Innovator Success
Primary Data Source
Drug annual U.S. sales
Negative (attracts stronger challenges)
IMS/IQVIA, SEC filings
Patent family size
Positive (signals value, complexity)
USPTO, Derwent Innovation
Number of backward citations
Contextual (crowded prior art can cut either way)
USPTO Patent Public Search
Number of claims
Positive (more lines of defense)
USPTO
Presiding judge track record
Highly case-specific
Lex Machina, court dockets
Jurisdiction (D. Del. vs. D.N.J. vs. other)
Contextual (venue-specific norms)
PACER, Lex Machina
Obviousness as primary invalidity defense
Negative (strongest generic weapon)
Court filings, Darts-ip
Patent type (composition vs. formulation vs. method)
Composition strongest; method-of-use most vulnerable
How Random Forest Models Outperform Logistic Regression in Patent Outcome Prediction
Logistic regression models capture linear relationships between predictors and outcomes and remain useful for interpretability. A portfolio manager who needs to explain to an investment committee why a specific drug’s patent position is rated at 65% vulnerability wants to point to coefficients, not black box scores. Random Forest and gradient boosting ensembles — XGBoost, LightGBM — achieve higher predictive accuracy by capturing nonlinear interactions: for instance, the combination of a large patent family with an obviousness-focused challenger and a claim-narrowing judge creates risk patterns that logistic regression treats as additive but are actually multiplicative in effect.
A 2021 study applying machine learning to predict patent litigation found Random Forest classifiers outperformed alternatives in F1 score across multiple cross-validation folds. A separate study using only patent claim text as model input achieved 73% accuracy on invalidity prediction using NLP-derived features, demonstrating that the text of claims contains detectable structural signals of patent strength — signals that experienced practitioners recognize intuitively but that NLP can now quantify at scale.
Decision Tree Analysis: Mapping Patent Litigation to Revenue Scenarios
Decision Tree Analysis (DTA) is the standard quantitative framework for translating litigation probability estimates into revenue outcomes. It works by representing the litigation process as a branching sequence of chance events, each with an associated probability and financial payoff, and computing expected values by working backward through the tree.
How to Build a Markman-to-Trial Decision Tree for an ANDA Dispute
A complete ANDA litigation decision tree starts at the initial strategic choice — litigate versus settle — and maps at minimum five major chance nodes: claim construction (Markman) ruling, summary judgment on infringement, summary judgment on invalidity, trial verdict on infringement, and trial verdict on validity. Each node branches into favorable and unfavorable outcomes. The probability at each branch is drawn from predictive model outputs or from historical data on the assigned judge’s ruling rates in comparable cases.
The payoffs at each terminal node require financial modeling. A brand that prevails on validity and infringement at trial preserves the full revenue stream through patent expiry, net of litigation costs. A brand that loses on validity faces immediate loss of exclusivity — the payoff is the post-generic market share trajectory, typically modeled at 80–90% revenue erosion within 24 months for a competitive generic market. Settlement payoffs require valuing the licensed entry date against a full competition scenario, weighted for the probability of the no-AG decision.
Why Real Options Analysis Captures Settlement Flexibility That DCF Models Miss
Standard DCF models and even well-constructed DTA models have a structural limitation: they do not capture the value of the optionality available to each party as litigation proceeds and information arrives. Real Options Analysis (ROA) treats each major litigation milestone as an option exercise point. After a favorable Markman ruling, the brand holds a more valuable “option to continue” the litigation toward trial. After an adverse claim construction, it holds a weaker option — one it may rationally choose to “abandon” by settling rather than investing further in an increasingly expensive and uncertain trial.
The practical implication is that settlement zone shifts throughout the litigation. Early in a case, with high uncertainty on both sides, the zone of potentially acceptable settlement terms for both parties is wide. After a favorable Markman ruling for the brand, the brand’s floor rises and the zone narrows. After an adverse summary judgment on a key patent, the generic firm’s leverage increases dramatically, shifting the settlement zone in the challenger’s favor. Analysts who track Markman rulings as financial events — not just legal milestones — can model settlement probability and approximate terms in real time.
How NLP Extracts Patent Risk Signals From Prosecution History and Claim Text
The prosecution history of a pharmaceutical patent — the complete record of exchanges between the applicant’s attorneys and the USPTO examiner — is one of the most underutilized data sources in commercial patent risk analysis. It is also, after financial modeling, the area where NLP is creating the most tangible analytical advantage for sophisticated IP teams.
Why Claim Amendments During Prosecution Create Non-Infringement Opportunities for Generics
Under the doctrine of prosecution history estoppel, if a patent applicant narrows a claim during prosecution to overcome an examiner’s rejection, that amendment limits the scope of claim equivalents available in subsequent litigation. A generic company that identifies a claim narrowing in prosecution history — for instance, an amendment that added a specific excipient type to overcome a prior art rejection — can design its formulation to avoid the narrowed claim scope, creating a non-infringement argument that could have been detected before the ANDA was even filed.
NLP tools that automatically parse prosecution histories and flag claim amendments, argument statements, and examiner-distinguished prior art references at scale give generic IP teams a systematic screening capability. Instead of manually reviewing prosecution histories for dozens of candidate drugs, an NLP pipeline can prioritize targets by the density of prosecution disclaimer language, identifying the drugs where generic design-around strategies are most likely to succeed. The Berkeley study demonstrating 73% invalidity prediction accuracy from claim text alone suggests this signal is real and material — not an artifact of the specific dataset.
How Semantic Patent Search Identifies Prior Art That Standard Keyword Searches Miss
Prior art search for pharmaceutical patent challenges has traditionally relied on keyword searches across patent databases and the scientific literature. The limitation is specificity: a prior art reference that discloses the key compound using a different naming convention or a slightly different structural representation will not appear in a keyword search. Semantic search tools trained on chemical and pharmacological language can identify conceptually similar disclosures even when the surface text does not match, increasing the scope of discoverable prior art and improving invalidity analysis for both IPR petitions and district court proceedings.
For brand companies running freedom-to-operate analyses on potential new compound patents, the same semantic search capability identifies unpublished prior art risks that might not surface until a generic challenger files an IPR petition years after the patent issues. Integrating semantic prior art search into the patent prosecution process itself — before claims are finalized — allows claim drafting to be informed by the actual invalidation risk landscape, not just the obvious prior art identified by patent counsel.
Key Patent Expiry Dates and Revenue Cliffs Investors Are Watching Through 2030
The period from 2025 to 2030 represents the most concentrated loss-of-exclusivity wave in pharmaceutical history, with analysts estimating $200 billion or more in branded drug revenues exposed to generic or biosimilar competition. For each drug in this window, the LOE date is not simply the primary composition of matter patent expiry — it is the result of the thicket structure, ongoing litigation, and regulatory exclusivity stacking described throughout this guide.
Which Drugs Face the Largest Revenue Exposure Through 2028
Merck’s Keytruda (pembrolizumab) is the highest-revenue drug entering its LOE window, with annual global sales exceeding $25 billion by 2024. The primary U.S. composition of matter patent expires in 2028, but Merck has a portfolio of formulation, method-of-use, and manufacturing process patents that create an overlapping exclusivity structure. Biosimilar developers — Samsung Bioepis, Alvotech, Biocon, and others — have begun pre-submission interactions with the FDA and EMA. The litigation and settlement dynamics for pembrolizumab biosimilars will closely parallel the Humira playbook, though the absence of a device delivery system and the more complex manufacturing requirements for a PD-1 antibody add uncertainty.
Bristol Myers Squibb’s Eliquis (apixaban) co-marketed with Pfizer faced generic entry challenges that produced a multi-front Hatch-Waxman defense. The primary apixaban patent expires in 2026, with a pediatric exclusivity extension running several months further. Generic ANDA filers including Mylan (now Viatris), Taro, and Zydus have navigated a complex set of formulation and method patents while BMS-Pfizer defended at the district court level. The Eliquis LOE, once complete, transfers roughly $11 billion in annual U.S. revenue into a competitive generic market within 18–24 months.
Novo Nordisk’s semaglutide franchise — Ozempic and Wegovy — occupies a different IP position. The composition of matter patents expire in the early 2030s, but the manufacturing complexity of GLP-1 peptide production, the device delivery systems for the auto-injector pen formats, and the clinical data package required for weight management dosing create a multi-layer exclusivity structure. Generic entry will require not only patent clearance but also the capital investment to develop and validate GLP-1 manufacturing at scale, which few manufacturers currently possess. This manufacturing moat may prove more durable than the patent thicket alone.
Active generic competition underway in some markets
How M&A Due Diligence Should Treat Pharmaceutical Patent Litigation Risk
Acquirers of pharmaceutical companies routinely undervalue IP litigation risk in transaction models. A legal opinion confirming that a patent appears valid and enforceable is not a probability estimate — it is a binary assessment that ignores the distribution of outcomes, the quality of the challenger pool, and the judicial context the patent would be litigated in. Converting legal opinion to quantified financial risk requires the analytical framework described above.
Why Standard DCF Models Overvalue Single-Patent Drug Assets
A DCF model that assumes market exclusivity through patent expiry for a newly approved blockbuster drug is, by historical base rates, almost certainly wrong. For a drug with annual U.S. sales above $250 million, the probability of facing a PIV challenge before the primary patent expires exceeds 90%. The probability that at least one of those challenges succeeds — either at trial or via PTAB — is meaningfully above zero. A DCF that ignores this probability distribution overstates the drug’s NPV by the expected value of revenue lost in a generic entry scenario, which for a competitive Hatch-Waxman market is typically 85–90% of brand revenue within two years of generic launch.
The corrected approach builds a probability-weighted DCF. The base case assumes full exclusivity through patent expiry; the downside case models early generic entry at historical settlement probabilities and loss rates; an additional scenario models PTAB invalidity triggering accelerated LOE without an exclusivity buffer. Each scenario is weighted by its model-estimated probability, producing a risk-adjusted NPV that is materially lower than the base case alone for drugs in the $250 million to multi-billion revenue range.
What “Litigation Alpha” Means for Pharma Asset Valuation
Litigation alpha — the systematic difference in patent validity outcomes attributable to the quality and strategy of patent prosecution — is a real and measurable effect. Patents prosecuted by law firms with higher invalidity rates in subsequent litigation carry a structural discount to their face value. Analytics data showing that patents prosecuted by a specific boutique firm have been invalidated at a 15% higher rate than the sector average translate directly into a haircut on the valuation of any asset whose protection depends on that firm’s prosecution work. Acquirers who do not perform this analysis are accepting an avoidable information asymmetry against sellers with full knowledge of their portfolio’s prosecution history.
Investment Strategy: How Pharmaceutical IP Data Informs Portfolio Positioning
Patent litigation data, LOE timelines, and settlement term analysis are now standard inputs for pharmaceutical equity analysts at major sell-side and buy-side institutions. The edge available to analysts who go deeper — tracking docket events, modeling judge-specific outcomes, pricing settlement terms using FTC data — has grown as the publicly available tools for doing so have become more accessible.
What Investors Are Watching in Pharma Patent Disputes in 2025 and 2026
Pembrolizumab’s biosimilar timeline is the dominant IP watch item for the largest biotech allocation in most institutional portfolios. Merck’s stock has held a material premium attributable to Keytruda’s exclusivity runway; any credible acceleration of that timeline through successful PTAB challenges or regulatory pathway developments at the FDA would constitute a de-rating event. Samsung Bioepis filed the first U.S. pembrolizumab biosimilar application in 2024; the litigation initiation and eventual settlement or verdict timelines are the key financial events to model.
GLP-1 manufacturing capacity constraints for semaglutide competitors represent a different category of risk. Here the question is not primarily legal but operational: which manufacturers can achieve the peptide synthesis quality required for a bioequivalent GLP-1 product at commercial scale, and when. The FDA’s compounding guidance and the agency’s enforcement posture toward outsourcing facilities producing semaglutide copies during the shortage period are active regulatory variables that affect the competitive timeline.
Biologics LOE in the ABBV/adalimumab space is now entering its data collection phase. U.S. biosimilar market share for adalimumab biosimilars through early 2025 has been tracking below European analogues, consistent with longer contract cycles, interchangeability designation timelines, and patient assistance program structures that maintain brand pricing. The rate at which biosimilar penetration accelerates from here will provide the calibration data for pembrolizumab and other large-molecule LOE models.
How Paragraph IV Litigation Changes Drug Valuation: A Framework for Analysts
The filing of a PIV certification is a materially negative event for brand company valuations and a conditionally positive event for the first-filing generic. The brand’s revenue at risk is the present value of drug revenue from the anticipated first generic entry date through patent expiry, multiplied by the probability of generic success. The generic’s value accretion is the probability-weighted 180-day exclusivity revenue minus litigation costs.
The settlement terms that resolve the dispute redistribute value between these two endpoints. A settlement granting early entry in exchange for a royalty transfers some brand exclusivity value to the generic while preserving more brand revenue than an outright generic victory would. A no-AG settlement preserves generic exclusivity value that an authorized generic would otherwise erode. Mapping these settlement terms to their financial equivalents — using the FTC framework and historical settlement data as benchmarks — produces a quantitative estimate of where the settlement has landed on the brand-to-generic value transfer spectrum.
Key Takeaways
In 2024, innovator companies prevailed on contested issues in 20% of terminated Hatch-Waxman litigations, but 39% of cases settled before trial. The gap between expected trial outcomes and settlement rates is where strategic analysis must start.
The 30-month automatic stay following a PIV lawsuit filing is an asset with a calculable revenue protection value — for a $100M/month drug, worth up to $3 billion before a judge rules on merits.
Post-Actavis settlements have migrated from explicit cash payments to quantity restrictions, declining royalty structures, and foreign launch accelerations. Each requires financial valuation, not just legal characterization.
PTAB institutions run at ~62% for Orange Book patents, but Federal Circuit reversal of adverse PTAB outcomes is ~13%. Brand companies appealing PTAB losses face poor odds; early settlement modeling is advisable after an adverse final written decision.
Patent prosecution quality is a measurable variable in litigation outcome prediction. Law firms whose prosecution work correlates with higher invalidity rates in subsequent litigation represent a discount to standard IP valuations.
The 2025–2030 LOE wave for Keytruda, Eliquis, and GLP-1 products carries estimated revenue exposure exceeding $200 billion globally. For each drug, the effective LOE date requires modeling the full thicket structure, not just the primary patent.
Common Investor Questions on Pharmaceutical Patent Litigation
What is a Paragraph IV filing and why does it matter for drug company investors?
A Paragraph IV certification is a generic company’s assertion that a brand’s Orange Book patent is invalid, unenforceable, or will not be infringed by the proposed generic. Filing it triggers a potential lawsuit and the brand’s 30-month automatic stay on FDA generic approval. For investors, the filing of a PIV notice is typically the first public signal that a generic challenge to a specific drug has commenced, making it a material event for revenue projection models.
How does 180-day exclusivity affect generic company revenue forecasts?
The 180-day exclusivity period granted to the first Paragraph IV filer is the primary revenue driver for a generic firm’s investment in patent litigation. During exclusivity, no subsequent generic can receive final FDA approval, leaving the first-filer competing only with the brand and potentially an authorized generic. For blockbuster drugs, this period can generate $100 million to $500 million in gross profit, underwriting the entire litigation investment.
What happened to pay-for-delay settlements after FTC v. Actavis?
Explicit large cash payments from brand to generic firms in exchange for delayed entry became rare after the 2013 Actavis ruling subjected them to antitrust rule-of-reason scrutiny. Value transfers migrated to quantity restrictions, no-authorized-generic agreements, declining royalty structures, and foreign market licensing terms. The FTC’s MMA annual reports document these evolving terms; FY 2018–2021 data shows quantity restrictions appearing in 23 settlements as a primary non-cash compensation mechanism.
How does PTAB inter partes review affect pharmaceutical patent valuation?
PTAB institutes IPR on approximately 62% of petitions involving Orange Book patents, using a lower evidentiary standard than district courts. A patent that survives a PTAB institution attempt gains credibility and a higher probability-of-validity score in financial models. A patent that receives an adverse final written decision from the PTAB faces an approximately 87% chance that the Federal Circuit will affirm, making the practical effect of an adverse PTAB ruling nearly equivalent to invalidity for valuation purposes.
How should an M&A deal team adjust a drug asset’s valuation for patent litigation risk?
The adjustment requires three inputs: the probability a PIV challenge is filed (base rates by revenue level), the probability a filed challenge succeeds at trial or via PTAB, and the revenue impact of early generic entry. These inputs feed a probability-weighted DCF model that discounts the base-case exclusivity NPV by the expected value of accelerated LOE scenarios. For high-revenue drugs in competitive markets, this adjustment typically reduces headline valuation by 15–30%.
What does a Markman hearing outcome mean for settlement probability?
Claim construction rulings from Markman hearings are the primary inflection point for settlement negotiations in ANDA litigation. A brand-favorable construction that adopts broad claim scope substantially reduces the generic’s non-infringement argument, shifting the settlement zone toward earlier and more compensatory generic entry terms. A generic-favorable construction that narrows claims significantly increases the generic’s bargaining position, often resulting in an earlier negotiated entry date than the brand initially offered.
Data Sources Referenced
How to Source and Structure Pharmaceutical Patent Litigation Data
The data infrastructure for pharmaceutical patent analytics spans public court records, USPTO databases, and commercial analytics platforms. Each layer serves different analytical purposes, and a sophisticated team uses all three.
Why PACER Alone Is Not Enough for Quantitative Litigation Analysis
PACER is the definitive source for raw docket data and document text from U.S. federal courts. Its $0.10-per-page fee model creates substantial cost barriers for large-scale pulls. More problematically, PACER lacks document-level full-text search, making it impossible to systematically query for specific claim terms, legal arguments, or settlement conditions across a multi-case dataset. Sealed records — common in high-value pharmaceutical patent cases — create additional gaps that are not resolvable from PACER alone.
The USPTO bulk patent litigation dataset provides a structured starting point for researchers but is typically delayed by several months relative to actual docket activity. For real-time competitive intelligence, commercial platforms are necessary.
What Lex Machina, Darts-ip, and DrugPatentWatch Each Provide for Pharma IP Teams
Lex Machina structures PACER data with attorney-reviewed tags, providing quantitative analytics on judge behavior, firm success rates, time-to-trial, and motion outcomes. Its ANDA module is the primary tool for Hatch-Waxman-specific judicial analytics. Clarivate’s Darts-ip adds international scope — over 4,100 courts in 140+ countries — enabling analysis of foreign patent outcomes that can signal U.S. litigation directions. DrugPatentWatch integrates patent and litigation data with FDA approval timelines, clinical trial status, and Orange Book exclusivity data, providing end-to-end visibility on the commercial timeline from patent expiry through generic launch.
The practical workflow for a pharma IP team evaluating a new PIV challenge typically combines all three: Lex Machina for judge and firm track records, Darts-ip for international family status and foreign litigation outcomes, DrugPatentWatch for the full LOE timeline including regulatory exclusivities that may survive patent expiry.
The Sealed Record Problem and What It Means for Any Litigation Database
A critical and often unacknowledged limitation of all publicly available pharmaceutical litigation data is the prevalence of sealed filings. In high-value ANDA cases, parties routinely seal portions of their briefs, expert reports, and damages analyses. Court orders can themselves be partially sealed. No commercial platform can recover data that has been withheld from the public record. Any quantitative model trained on public litigation data is therefore systematically missing the cases where the most sensitive commercial information was at stake — precisely the cases that might carry the most predictive signal for future settlements.