Optimization of Pharmaceutical R&D Portfolios: Strategic IP Valuation and Risk Mitigation in Regulated Markets
Pharmaceutical R&D requires a capital allocation strategy that balances extreme clinical failure rates with the legal protection of molecular entities. The average cost to develop a New Molecular Entity (NME) is $2.6 billion, a figure that includes the cost of capital and the price of failed candidates. Companies manage these investments through risk-adjusted Net Present Value (rNPV) models. These models weigh the probability of technical and regulatory success (PTRS) at each clinical phase against the projected terminal value of the asset. The core of this value is the Intellectual Property (IP) estate. Without a robust patent portfolio, an asset has no protection against immediate generic or biosimilar erosion. Portfolio management determines how a firm allocates its budget across early-stage discovery, late-stage clinical trials, and post-market lifecycle management to ensure a continuous revenue stream.
Quantitative Frameworks for IP-Centric Asset Selection
Asset selection depends on the projected duration of market exclusivity. A drug with a breakthrough designation provides high clinical value, but its economic viability is tied to its patent term. Analysts evaluate the ‘Primary Patent’ which covers the active pharmaceutical ingredient (API) and subsequent ‘Secondary Patents’ covering formulations, dosages, or methods of use.
The valuation of an asset like Pembrolizumab (Keytruda) illustrates this. Its value is not just in its current oncology indications but in its extensive patent thicket. This thicket consists of over 100 patents that extend its protection well beyond the expiration of the original composition-of-matter patent. Institutional investors track the ‘Weighted Average Cost of Capital’ (WACC) against the expected ‘Internal Rate of Return’ (IRR) of each pipeline candidate. If a candidate’s rNPV falls below the cost of capital due to a shortened exclusivity window or a high risk of ‘Paragraph IV’ litigation, the firm must divest or deprioritize the asset.
Decision-making involves a trade-off between first-in-class assets and best-in-class assets. First-in-class drugs face higher regulatory hurdles and uncertain market uptake. Best-in-class assets benefit from established clinical pathways but must demonstrate superior efficacy or safety to gain formulary placement. Portfolio leads use sensitivity analysis to determine how changes in clinical trial endpoints or generic entry dates impact the total portfolio valuation.
Key Takeaways
Asset valuation relies on rNPV calculations that integrate PTRS and IP duration.
IP thickets provide a defensive moat that extends the revenue tail of a product.
Paragraph IV filings represent a constant threat to the terminal value of small molecule portfolios.
Portfolio balance requires a mix of high-risk NMEs and lower-risk line extensions.
Investment Strategy
Analysts should prioritize firms that maintain a ‘Laddered Portfolio’ where patent expirations are staggered. This prevents the ‘Patent Cliff’ scenario where a significant portion of revenue disappears in a single fiscal year. Investors must look for companies with a high ‘Replacement Ratio,’ meaning the potential revenue from Phase III assets exceeds the revenue lost to upcoming generic entries.
Strategic Lifecycle Management and Technical Evergreening Roadmaps
Evergreening is a technical and legal strategy used to maintain market share after the primary patent expires. This process starts years before the loss of exclusivity (LOE). The roadmap for evergreening typically follows a specific technical progression.
The first stage is the development of second-generation formulations. This includes controlled-release versions, new dosage strengths, or fixed-dose combinations. For example, a company might transition a patient base from a twice-daily tablet to a once-daily extended-release capsule. This shift is often supported by clinical data showing improved patient compliance.
The second stage involves the ‘Subcutaneous Switch’ for biologics. Biologics are governed by the Biologics Price Competition and Innovation Act (BPCIA). By moving from an intravenous (IV) administration to a subcutaneous (SC) injection, a manufacturer creates a new, protected delivery method. This often utilizes proprietary drug-delivery technology like recombinant human hyaluronidase. This switch complicates the path for biosimilar manufacturers who must match the new delivery system to maintain ‘Interchangeability.’
The third stage is the pursuit of ‘Pediatric Exclusivity’ or ‘Orphan Drug Designation’ for new indications. These regulatory pathways provide additional months or years of market protection. In the case of Adalimumab (Humira), the manufacturer used a combination of formulation changes and a dense web of manufacturing patents to delay biosimilar entry for years. This strategy turned a single molecule into a multi-decade revenue engine.
Key Takeaways
Evergreening begins early in the clinical cycle, not at the point of patent expiration.
Formulation changes and new delivery systems create high barriers for generic and biosimilar competitors.
The BPCIA provides a different, often more complex, legal framework for biologics compared to the Hatch-Waxman Act for small molecules.
Interchangeability is the primary goal for biosimilar defense, as it prevents automatic substitution at the pharmacy level.
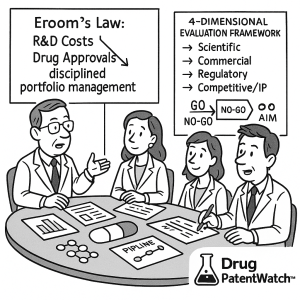
The biopharmaceutical industry stands at a strategic inflection point, defined by a fundamental paradox: research and development (R&D) expenditures are escalating at an unsustainable rate, while the output of novel, value-creating medicines remains stubbornly flat. This phenomenon, often termed “Eroom’s Law,” places unprecedented pressure on the R&D portfolio, transforming it from a pipeline of scientific projects into a high-stakes collection of assets that must be managed with the rigor and discipline of a premier investment fund. The cost of failure is not merely financial; a single late-stage termination can erase billions in investment, damage corporate reputation, and squander years of invaluable scientific effort. Consequently, mastering the art and science of portfolio decision-making is no longer a competitive advantage but a requisite for survival.
This report provides an exhaustive analysis of the strategic decision-making process in pharmaceutical R&D portfolios. It deconstructs the complex interplay of scientific, commercial, regulatory, and competitive factors that govern the journey of a drug candidate from laboratory bench to patient bedside. The analysis begins by establishing the unforgiving context of modern drug development, quantifying the immense costs and high attrition rates that define the “valley of death” through which every potential therapy must pass. It maps the critical go/no-go decision gates across the R&D lifecycle, from initial discovery to pivotal late-stage trials, benchmarking the probabilities of success at each phase.
A central pillar of this report is the establishment of a comprehensive, four-dimensional evaluation framework. Every asset must be rigorously assessed against its scientific and clinical merit, its commercial viability and market attractiveness, its path through the regulatory gauntlet, and its positioning within a fierce competitive and intellectual property landscape. We delve into the sophisticated valuation methodologies employed to quantify these assets, from foundational scoring models and risk-reward matrices to the industry-standard risk-adjusted Net Present Value (rNPV) and the more theoretically advanced Real Options Analysis (ROA). A comparative analysis reveals the distinct strengths, limitations, and optimal use cases for each tool, empowering leaders to select the right framework for the right decision.
However, even the most sophisticated quantitative models are vulnerable to the human element. This report dedicates significant analysis to the pervasive influence of cognitive biases—such as confirmation bias, the sunk-cost fallacy, and champion bias—that systematically distort objective decision-making. It provides a practical toolkit of cultural and structural mitigation strategies, arguing that building a “truth-seeking” organization, which rewards objectivity and embraces the “fast fail,” is as critical as any financial model.
Finally, the report looks to the future, examining the transformative trends that are reshaping the strategic calculus of portfolio management. The convergence of Artificial Intelligence, personalized medicine, Real-World Evidence (RWE), and the rise of the externalized R&D ecosystem is creating a new paradigm. The successful pharmaceutical company of the next decade will not be a self-contained inventor but a sophisticated systems integrator, using AI as a central nervous system to orchestrate a fluid, networked portfolio of internal and external assets to serve highly defined patient populations. The recommendations outlined herein provide a roadmap for R&D leadership to navigate this complex future, build resilient portfolios, and ultimately fulfill the industry’s core mission: translating the promise of science into life-changing medicines.
Section I: The High-Stakes Crucible: The Strategic Imperative of R&D Portfolio Management
The management of a pharmaceutical Research and Development (R&D) portfolio is not a mere administrative function; it is the strategic heart of the enterprise, a high-stakes crucible where science, finance, and market dynamics collide. The decisions made within this domain dictate a company’s long-term trajectory, separating industry leaders from the footnotes of history. In an environment characterized by punishing costs, protracted timelines, and staggering rates of failure, the ability to strategically select, prioritize, and, when necessary, terminate R&D projects is the single most critical determinant of sustainable success.1 This section establishes the unforgiving context of modern drug development, framing portfolio management as the essential discipline for navigating an industry in which the odds are perpetually stacked against success.
1.1 The Paradox of Modern Pharma: Escalating Costs vs. Stagnant Output
The fundamental challenge confronting every pharmaceutical R&D organization today can be summarized by a phenomenon known as “Eroom’s Law”—Moore’s Law spelled backward.2 While Moore’s Law describes the exponential increase in computing power for a given cost, Eroom’s Law observes the opposite in drug development: the cost to develop a new medicine has been doubling roughly every nine years, even when adjusted for inflation, yet the number of new drugs approved per billion R&D dollars spent has been halving.1 This inverse relationship highlights a severe and worsening productivity crisis at the core of the industry.
The data supporting this paradox is stark and compelling. Over the past few decades, R&D spending has soared. Between 2006 and 2015 alone, total worldwide R&D expenditure by pharmaceutical and biotechnology companies increased from approximately $108 billion to $141 billion.3 Despite this massive infusion of capital and the advent of revolutionary technologies like genomics and high-throughput screening, the output of New Molecular Entities (NMEs) approved by regulatory bodies like the U.S. Food and Drug Administration (FDA) has remained distressingly flat.1 This disconnect means the cost to bring a single new drug to market has reached astronomical levels. When accounting for the cost of the many failures that precede one success, credible estimates place the fully capitalized cost of developing a new NME at between $1.3 billion and $2.6 billion.1
This harsh reality has immediate and profound consequences for R&D return on investment (ROI). As one analysis from the 1980s noted, the cost of developing new drugs was already rising about 50% faster than sales, creating an environment where strategic focus was the only path to survival.6 This pressure has only intensified. The modern R&D environment is becoming steadily harsher, forcing a fundamental shift in corporate strategy. Companies can no longer afford to be all things to all people; they must focus their finite resources on core therapeutic areas where they possess the greatest scientific strengths and can identify clear market opportunities.6
This imperative to “focus on the best opportunities” is the driving force behind the evolution of portfolio management. It necessitates a move away from intuition-based or politically driven project selection toward a more rigorous, systematic, and data-driven process.7 The central question for every R&D leader is no longer simply “What can we discover?” but “Among the many things we
could pursue, what should we pursue?” Answering this question effectively is the primary goal of strategic portfolio management. The pressure of Eroom’s Law fundamentally changes the nature of the pharmaceutical company, pushing it to operate like a sophisticated investment management firm. Drug candidates are not just scientific endeavors; they are high-risk, long-term assets, and the portfolio manager’s role is to optimize this unique and challenging asset class to ensure the company’s future viability.
1.2 Defining the Portfolio: A Dynamic Balance of Risk, Reward, and Resources
A pharmaceutical R&D portfolio is far more than a static list of projects. It is a dynamic and living collection of assets, encompassing everything from early-stage discovery programs and clinical-stage candidates to marketed products requiring lifecycle management.7 Effective portfolio management is therefore defined as the continuous, strategic process of selecting, prioritizing, and optimizing these assets to achieve a delicate balance between maximizing potential returns, minimizing inherent risks, and making the most efficient use of limited resources.8
The dynamism of this process cannot be overstated. The R&D landscape is in constant flux, shaped by new scientific data, evolving market needs, shifting regulatory requirements, and the actions of competitors.3 A decision that was sound yesterday may be rendered obsolete by a competitor’s clinical trial results or a change in reimbursement policy tomorrow. Consequently, portfolio management requires a framework for continuous evaluation, enabling the strategic acceleration of promising projects, the discontinuation of failing ones, and the reprioritization of the entire portfolio in the face of uncertainty.1
At its core, this is an exercise in strategic trade-offs. No company, regardless of its size, has the resources—financial, human, or temporal—to pursue every opportunity.8 Portfolio managers must therefore make difficult choices, strategically allocating capital to maximize the likelihood of overall success. This involves striking a careful balance between different types of assets. A well-structured portfolio will typically blend high-risk, high-reward projects, such as first-in-class molecules with novel mechanisms of action, with lower-risk, more predictable endeavors, like line extensions or drugs in well-validated target classes.8 This diversification helps to spread risk across different therapeutic areas and stages of development, ensuring that the failure of one or even several projects does not jeopardize the entire enterprise.8 The ultimate goal is to construct a portfolio that is aligned with the company’s core therapeutic strengths and long-term business objectives, ensuring that every dollar of R&D spend is deployed in a way that contributes to sustainable growth.8
1.3 The Consequences of Failure: Beyond Financial Loss
In the high-stakes world of pharmaceutical R&D, failure is not an exception but the norm. With over 90% of drug candidates failing to reach the market, the financial burden of these failures is immense and must be meticulously factored into every strategic decision.5 The investments made in a failed project are “sunk costs”—once spent, they are irrecoverable. A single failed Phase III trial alone can cost between $200 million and $500 million, and the total cost of a failed candidate can easily exceed $1 billion.5 This is a profound financial pressure that shapes the industry’s risk-averse nature.
The consequences of a major pipeline failure, especially a late-stage one for a highly anticipated “blockbuster” drug, extend far beyond the immediate financial write-off. The case of Pfizer’s Torcetrapib, a cholesterol drug that failed in late 2006, serves as a stark example. The news of its failure, after an investment exceeding $800 million, led to an immediate and sharp decline in Pfizer’s stock price and prompted credit rating agencies like Moody’s to downgrade the company’s prestigious Aaa long-term debt rating. The rationale was clear: the failure had weakened the company’s pipeline relative to its upcoming patent exposures, altering its fundamental risk profile.10
This illustrates that the impact of failure is systemic. It is not just a financial loss but a strategic one. It represents a squandering of scarce and highly specialized scientific talent, years of lost opportunity where those resources could have been deployed on more promising projects, and a significant blow to corporate reputation and investor confidence.11 When a company like Pfizer loses an $11 billion annual revenue stream from a blockbuster like Lipitor going off-patent, the pressure to replenish that revenue from the pipeline becomes immense.1 A subsequent high-profile failure in that pipeline can be catastrophic, raising questions about the viability of the company’s entire R&D strategy and its ability to secure its long-term future.
This is why the strategic choices made in portfolio management are so critical. The decision to advance a project from one phase to the next is not merely a scientific checkpoint; it is an investment decision that exponentially increases the capital at risk. The failure to terminate unpromising projects early—the so-called “zombie” projects that continue to consume resources with little hope of success—is one of the most significant drains on R&D productivity.12 Effective portfolio management, therefore, is fundamentally about risk management: mitigating the devastating impact of inevitable failures by making disciplined, evidence-based decisions to cut losses early and reallocate precious capital to assets with a genuine chance of becoming the life-changing medicines of tomorrow.
Section II: Navigating the Valley of Death: The R&D Lifecycle and Its Critical Gates
The journey of a new medicine from a concept in a laboratory to a treatment in a physician’s hands is a long, arduous, and perilous one. This multi-stage process, often referred to as the “valley of death,” is structured into distinct phases, each with its own objectives, challenges, and escalating costs. At the transition point between each phase lies a critical decision gate, a moment of truth where a project must justify its continued existence. It is at these gates that portfolio managers make the crucial go/no-go decisions that shape the pipeline and determine the company’s future. Understanding this lifecycle and the brutal attrition that occurs within it is fundamental to grasping the practice of pharmaceutical portfolio management.
2.1 From Discovery to Market: A Phased Approach to Innovation
The drug development process is a highly structured and regulated pathway, standardized globally to ensure that new medicines are both safe and effective. The U.S. FDA outlines a five-step process that serves as a universal model for the industry.13 Each step represents a significant escalation in investment and commitment, moving from broad exploration to focused validation.
Step 1: Discovery and Development. This initial phase begins in the laboratory with basic research aimed at understanding the fundamental mechanisms of a disease.14 Researchers identify a specific biological target—typically a protein, gene, or RNA molecule—that plays a critical role in the disease process.15 This is followed by applied research, where thousands, or even millions, of chemical compounds are screened to find ones that interact with the target in a desirable way.14 The most promising of these “hits” are then optimized to improve their properties, such as potency and selectivity, becoming “lead” compounds. This stage is a funnel of massive attrition, where a vast number of initial ideas are sifted through a screening process using simple models to determine their minimal acceptability before more significant resources are committed.6
Step 2: Preclinical Research. Before a drug candidate can be tested in humans, it must undergo rigorous preclinical research. This involves both in vitro (test tube) and in vivo (animal) studies to answer basic questions about the compound’s safety.13 The primary goal is to assess whether the compound has the potential to cause serious harm or toxicity.15 These studies also provide crucial information on pharmacokinetics (what the body does to the drug, or ADME: Absorption, Distribution, Metabolism, and Excretion) and pharmacodynamics (what the drug does to the body).15 This data is essential for determining a safe starting dose for human trials and for developing the final drug formulation. All preclinical work must adhere to the FDA’s Good Laboratory Practice (GLP) regulations to ensure data quality and integrity.15
Step 3: Clinical Research. This is the longest and most expensive part of the development process, where the drug is tested in humans through a series of clinical trials. It is typically divided into three sequential phases 14:
Phase I: The primary goal is to assess safety and determine a safe dosage range. These trials involve a small number of participants, typically 20 to 100 healthy volunteers or, in some cases like oncology, patients with the disease.14
Phase II: The drug is administered to a larger group of patients (up to several hundred) to evaluate its efficacy and further assess its safety.14 This phase is critical for establishing “proof-of-concept”—the first real evidence that the drug has a therapeutic effect in its target population.
Phase III: These are large-scale, pivotal trials involving hundreds to thousands of patients (e.g., 300 to 3,000).15 Their purpose is to definitively confirm the drug’s efficacy, monitor side effects, compare it to commonly used treatments, and collect information that will allow the drug to be used safely. The results of Phase III trials form the primary basis for regulatory approval.
Step 4: FDA Review. If a drug successfully navigates all three phases of clinical research, the sponsoring company submits a New Drug Application (NDA) or Biologics License Application (BLA) to the FDA.15 This application is a massive compilation of all the data from discovery, preclinical, and clinical studies. A multidisciplinary team of FDA experts—including physicians, statisticians, chemists, and pharmacologists—conducts a thorough review to determine if the drug’s demonstrated benefits outweigh its known risks.13 If the review is favorable, the FDA grants approval to market the drug in the United States.
Step 5: Post-Market Safety Monitoring (Phase IV). The FDA’s oversight does not end with approval. Because clinical trials are conducted in a relatively small and controlled population, rare or long-term side effects may only become apparent once the drug is used by a much larger and more diverse population in the “real world”.15 This phase involves ongoing safety surveillance through programs like MedWatch, where healthcare professionals and consumers can report adverse events.15 The FDA may also require the company to conduct specific post-market (Phase IV) studies to gather more information on the drug’s long-term risks, benefits, and optimal use. In some cases, if a drug is found to have serious safety concerns, the FDA may require a Risk Evaluation and Mitigation Strategy (REMS) to ensure its benefits continue to outweigh its risks.16
2.2 The Great Filter: Understanding and Benchmarking Attrition Rates
The phased structure of R&D acts as a great filter, designed to progressively weed out unpromising candidates. The reality of this process is defined by brutal attrition rates. The overall probability of a new molecular entity successfully moving from the start of clinical testing to regulatory approval is shockingly low, with most studies placing the figure between 9% and 12%.15 When considering the entire journey from initial discovery, the success rate plummets even further, with some estimates as low as 0.4% (a 99.6% failure rate) for challenging areas like Alzheimer’s disease.18 This means that for every 250 compounds that show promise in the lab, only one is likely to become an approved medicine.
Analyzing the success rates phase by phase reveals the specific points where this filter is most stringent. While there is variability across different studies, therapeutic areas, and time periods, a consistent pattern emerges. The transition from preclinical to Phase I is a major hurdle, but the most significant drop-off consistently occurs during Phase II.17 This stage is often called the “graveyard of drug development” because it is the first true test of a drug’s efficacy in patients. Success rates for Phase II have been reported to be as low as 18-30%, meaning that roughly two-thirds of drugs that enter this phase fail to demonstrate the required proof-of-concept to advance.17
The high failure rate in Phase II is not merely a statistic; it points to a systemic challenge in the industry: a fundamental disconnect between the predictive power of preclinical models and the complex reality of human biology. A compound may appear safe in Phase I and show promise in animal models, only to reveal a lack of efficacy when tested in a real-world patient population. This “translational failure” is the primary cause of the enormous waste of R&D investment at this specific stage.
To address this, the industry has been forced to evolve its strategic approach. The goal is to “front-load” the risk, finding ways to get a definitive “no” answer earlier and more cheaply. This has led directly to a greater emphasis on translational science and the use of biomarkers to improve the quality of candidates before they enter the expensive clinical phases.20 Strategies like AstraZeneca’s “5Rs” (Right Target, Right Patient, etc.) are a direct response to this challenge, aiming to increase the probability of success by ensuring that only the most robust and well-validated candidates are advanced.20 Similarly, in fields like CNS drug development, there is a growing consensus that demonstrating target engagement in the human brain
before launching large efficacy trials is essential to avoid costly and uninformative failures.21 The following table provides a consolidated view of these attrition rates and the core questions that define each decision gate, serving as a critical benchmark for portfolio managers.
Table 1: Phase-by-Phase R&D Attrition Rates and Key Decision Criteria
Phase
Average Probability of Success (PoS) to Next Phase
Key Reasons for Failure at This Stage
Core Go/No-Go Question
Preclinical
60-70%
Unacceptable toxicity; Poor pharmacokinetics (ADME properties); Lack of a viable formulation.
Does the candidate have an acceptable safety profile and drug-like properties to justify testing in humans?
Phase I
55-65%
Unforeseen safety issues in humans; Poor tolerability; Unfavorable human pharmacokinetics.
Is the drug safe and well-tolerated in humans at clinically relevant doses?
Does the drug show sufficient evidence of a therapeutic effect (proof-of-concept) in the target patient population to warrant the massive investment of a Phase III program?
Phase III
55-65%
Failure to show statistically significant superiority or non-inferiority to standard of care; Unacceptable safety profile in a larger population; Emergence of a superior competitor.
Do the large-scale pivotal trials definitively confirm the drug’s efficacy and safety, providing a positive risk-benefit balance for regulatory submission?
Submission
85-95%
Insufficient data to support claims; Manufacturing/Chemistry issues (CMC); Disagreements with the regulatory agency on data interpretation or labeling.
Is the submitted data package complete, robust, and persuasive enough to convince regulators that the drug’s benefits outweigh its risks for the proposed indication?
Note: Probabilities of success are aggregated estimates from multiple sources and can vary significantly by therapeutic area, modality (small molecule vs. biologic), and time period. Sources:.17
2.3 The Go/No-Go Decision: The Art and Science of Killing Projects
The go/no-go decision is the functional heart of portfolio management. At each stage gate, a formal decision must be made: either commit the substantial resources required to advance the project to the next phase (“Go”) or terminate its development (“No-Go”). Given the high attrition rates, the “No-Go” decision is far more common, yet it is often the most difficult one to make. As a McKinsey analysis highlights, leading biopharma companies routinely discontinue 21-22% of their pipeline programs annually to focus on higher-quality assets.23 This “pruning” is not a sign of failure but of disciplined and healthy portfolio management.
The framework for these decisions rests on a set of pre-defined criteria that encompass the scientific, commercial, and regulatory dimensions of the project.18 At each gate, the project team must present evidence that the asset continues to meet these criteria. For example, to pass the gate from Phase II to Phase III, the team must demonstrate not only compelling proof-of-concept data but also a continued viable commercial opportunity and a clear regulatory path forward.
Making these decisions involves navigating a delicate balance between two types of error 18:
Type I Error (False Positive): Incorrectly advancing a flawed candidate. This is the more visible and costly error, leading to expensive late-stage failures that consume vast resources and deliver no value.
Type II Error (False Negative): Incorrectly terminating a promising candidate. This represents a missed therapeutic opportunity and a loss of potential future revenue. While less visible, this error can be just as damaging to a company’s long-term growth.
The immense pressure of sunk costs, emotional attachment to a project, and internal politics can make objective decision-making incredibly difficult, often leading to a bias against termination.3 To combat this, leading organizations strive to foster a “truth-seeking” culture.20 As Mene Pangalos, EVP of BioPharmaceuticals R&D at AstraZeneca, has articulated, this involves creating an environment where scientists are empowered and encouraged to ask the “killer questions” and rigorously test their own hypotheses.20 The goal is to fail early, fail fast, and fail cheaply. In such a culture, a “No-Go” decision is not seen as a personal failure but as a valuable contribution to the overall health of the portfolio, freeing up capital, time, and talent to be deployed on assets with a greater probability of success.12 This disciplined, dispassionate approach to culling the pipeline is the single most effective lever for improving R&D productivity.
Section III: The Anatomy of a Decision: A Four-Dimensional Evaluation Framework
A robust portfolio decision cannot be made by looking at a single variable. It requires a holistic, multi-dimensional assessment that integrates disparate streams of information into a coherent strategic picture. The most effective decision-making frameworks evaluate every potential and existing asset against four fundamental pillars: its scientific merit, its commercial viability, its regulatory pathway, and its competitive standing. These pillars are not independent silos to be checked off a list; they form an interconnected system where a change in one dimension can have profound implications for the others. True mastery of portfolio management lies in the ability to analyze and synthesize these four dimensions simultaneously and continuously.
3.1 Pillar 1: Scientific and Clinical Merit (The “Will it Work?” Axis)
This pillar forms the bedrock of any pharmaceutical asset. Without sound science and a plausible clinical hypothesis, all other considerations are moot. The evaluation of scientific and clinical merit is a rigorous process that begins at the earliest stages of discovery and continues, with increasing scrutiny, through every phase of development.9
The core of this assessment revolves around a series of fundamental questions. First and foremost is the strength of the scientific rationale: Is there a clear and compelling link between the drug’s biological target and the pathophysiology of the disease?.9 This involves a deep understanding of the mechanism of action (MOA)—exactly how the drug interacts with its target to produce a therapeutic effect. A well-understood MOA provides greater confidence than a novel, unvalidated one.
Next, the quality of the preclinical data is paramount. Do the in vitro and in vivo studies provide strong evidence of both efficacy and an acceptable safety profile?.9 This data must be robust enough to justify the significant ethical and financial step of moving into human trials.
Finally, and most importantly, the assessment must address the potential for clinical impact and the scale of the unmet medical need.6 Does the proposed treatment offer a significant advantage over existing therapies? This could be through superior efficacy, an improved safety profile, a more convenient mode of administration, or by addressing a patient population with no current treatment options.9 Answering this question requires a thorough analysis of the current standard of care and its limitations. A drug that offers only a marginal benefit in a crowded market has a much lower value proposition than a breakthrough therapy for a devastating disease. As Mene Pangalos of AstraZeneca has stated, “A selective high-quality molecule will never become a medicine if it is modulating the wrong target. This is why target selection is the most important decision we make in research”.20 This underscores that the entire value chain begins with getting the science right.
3.2 Pillar 2: Commercial Viability and Market Attractiveness (The “Will it Sell?” Axis)
A drug that works but does not sell is a failure from a portfolio perspective. The commercial pillar assesses the market potential of an asset, seeking to answer the critical question of whether a successful clinical program can be translated into a profitable product. This analysis is multifaceted and must evolve as the asset progresses through development.6
The evaluation begins with a market niche analysis, which examines the therapeutic landscape to identify gaps or unmet needs that the company’s product could fill.6 This involves defining the addressable patient population, a process that requires careful market segmentation.6 Is the drug targeting a broad primary care condition or a rare orphan disease? The size of the patient population is a primary driver of revenue potential.22
A key component of the commercial assessment is forecasting peak sales—the maximum annual revenue the drug is expected to generate.22 This is not a simple calculation but a complex model that incorporates assumptions about market penetration, pricing, and duration of treatment. The competitive landscape is a critical input here; the presence of existing or emerging competitors will directly impact the market share a new drug can capture.9
Pricing and reimbursement potential are perhaps the most challenging aspects of the commercial evaluation. The price a company can charge is not arbitrary; it must be justified by the drug’s clinical value, its differentiation from competitors, and the willingness of payers—both government and private insurers—to cover it. A breakthrough therapy for a fatal disease can command a premium price, while a “me-too” drug in a competitive class will face significant pricing pressure.26
Finally, the commercial analysis must consider lifecycle management. How can the value of the asset be maximized over its entire patent life? This could involve plans for label expansions into new indications, developing new formulations, or strategic marketing to defend its market position against generic or biosimilar entry upon patent expiry.28 A well-defined commercial strategy, supported by robust market analysis and forecasting, is essential for ensuring that a scientifically successful drug also becomes a commercially successful one.
3.3 Pillar 3: The Regulatory Gauntlet (The “Can it be Approved?” Axis)
Navigating the complex and stringent pathways of regulatory agencies like the FDA and the European Medicines Agency (EMA) is a critical pillar of portfolio decision-making. A drug’s value is contingent upon its approval, and the perceived probability, timeline, and quality of that approval significantly influence its valuation.5
The assessment of this pillar begins with defining the clearest and most efficient regulatory pathway for the candidate.9 This involves understanding the specific data requirements for the intended indication and aligning the clinical trial design to meet those standards. Historical precedents for similar drugs are often studied to gauge the regulatory agency’s stance on certain endpoints or trial designs.9
A key strategic consideration is the potential to qualify for an expedited review process. Programs such as the FDA’s Fast Track, Breakthrough Therapy, Priority Review, and Accelerated Approval designations can significantly shorten the development and review timelines, bringing a drug to patients faster and extending its effective patent life.9 Qualifying for these programs typically requires the drug to address a serious condition and demonstrate the potential for substantial improvement over available therapy. Portfolio decisions for assets targeting such conditions will factor in the higher probability and value associated with these accelerated pathways.
The regulatory assessment must also be forward-looking, anticipating potential hurdles. If a drug candidate has known safety concerns, for example, the portfolio plan must include the potential requirement for a Risk Evaluation and Mitigation Strategy (REMS) post-approval.16 A REMS program, which can range from a simple medication guide to strict controls on distribution, can add complexity and cost to commercialization and must be factored into the overall value proposition.16 An unpredictable regulatory environment, where rules governing approval or market access can change, acts as a significant risk factor that can devalue an entire portfolio.5 Therefore, a proactive and sophisticated regulatory strategy is not just a compliance exercise but a core component of value creation and risk mitigation.
3.4 Pillar 4: The Competitive and IP Landscape (The “Can We Compete?” Axis)
The final pillar of the evaluation framework assesses the external environment in which the asset will exist. A drug can be scientifically sound, commercially attractive, and have a clear regulatory path, but its value can be completely undermined if it cannot compete effectively or is blocked by a competitor’s intellectual property (IP). This pillar integrates two closely related disciplines: competitive intelligence and patent intelligence.
Competitive Intelligence (CI) is the systematic collection, analysis, and application of data about competitors, market trends, and regulatory changes to inform strategic decision-making.29 In the context of portfolio management, CI is not a passive activity but an active, forward-looking one. Its primary goal is to anticipate competitor strategies to refine one’s own.29 This involves several types of intelligence gathering:
Pipeline Intelligence: This is the most critical component for R&D decisions. It involves meticulously tracking competitor drug pipelines by monitoring clinical trial databases (like ClinicalTrials.gov), analyzing their R&D investments, and assessing the probability of their regulatory approvals. This allows a company to predict future market shifts and understand the competitive pressures its own candidates will face at launch.29
Market and Product Intelligence: This involves understanding how rival firms position their products, their pricing and market access strategies, and their product lifecycles. This information is vital for shaping the commercial strategy (Pillar 2) of one’s own assets.29 For instance, intelligence about a competitor’s Phase III trial delay can create a window of opportunity to accelerate one’s own timeline and achieve a first-mover advantage.29
Patent Intelligence and Freedom to Operate (FTO) is the second critical component of this pillar. It is a common misconception that holding a patent for a new drug automatically gives a company the right to sell it. In reality, a patent only grants the owner the right to exclude others from making, using, or selling the claimed invention.31 The commercialization of a new product could still infringe upon other, broader patents held by competitors.
For this reason, a Freedom to Operate (FTO) analysis is an essential step in de-risking a development program.11 An FTO analysis involves a thorough search of existing patents to ensure that the production and sale of the new drug will not be blocked by a competitor’s IP rights.31 Without FTO, a company could invest hundreds of millions of dollars in development only to be hit with an infringement lawsuit and an injunction that halts commercialization, a devastating outcome.11 If an FTO analysis uncovers high-risk patents, the company has several strategic options: attempt to license or purchase the blocking patent, try to invalidate it in court, or, critically, use the information to guide R&D and “design around” the competitor’s patent.31 FTO is so crucial that many investors require a favorable FTO opinion as a condition of investment.31
Spotlight: Leveraging DrugPatentWatch for Actionable Intelligence
Operationalizing the competitive and IP pillar requires specialized tools that can aggregate and analyze vast amounts of complex data. DrugPatentWatch is a prime example of a business intelligence platform designed specifically for this purpose, providing the deep knowledge on patents, generics, suppliers, and clinical trials that portfolio managers need.32
For portfolio management teams, the platform serves several critical functions. It allows them to anticipate patent expiration dates for competitor drugs, which is crucial for forecasting market dynamics and identifying opportunities for their own assets.32 By tracking Paragraph IV challenges and patent litigation, managers can assess the strength of competitor patents and the likelihood of early generic entry, which directly impacts the long-term value of their own branded products.32 This data is essential for building robust commercial models and making informed lifecycle management decisions.
Furthermore, DrugPatentWatch is a powerful tool for competitive intelligence. Branded manufacturers can use it to elucidate the research paths of their rivals and assess the historical success rates of patent challengers.32 By providing integrated data on drugs in development, clinical trials, and regulatory statuses, the platform enables a comprehensive “sector landscaping” and due diligence process for in-licensing or acquisition opportunities.32
The credibility and utility of such platforms are underscored by their widespread use in academic and policy research. Studies regularly cite DrugPatentWatch as a key resource for tracking patent landscapes, assessing the impact of patent cliffs on market competition, providing empirical data on generic entry, and informing FTO analyses.33 This demonstrates how a specialized intelligence tool can transform the abstract need for “competitive awareness” into a concrete, data-driven input for strategic portfolio decisions.
The four pillars of evaluation—Scientific, Commercial, Regulatory, and Competitive/IP—are not a linear checklist but a dynamic, interconnected system. A breakthrough in scientific understanding (Pillar 1) can open up an expedited regulatory pathway (Pillar 3). A shift in the competitive landscape revealed by CI (Pillar 4), such as a rival’s clinical trial failure, can dramatically increase the commercial potential of one’s own asset (Pillar 2). Conversely, a weak patent position or a blocked FTO (Pillar 4) can render even the most promising science worthless. The most sophisticated R&D organizations recognize this interconnectedness. They build integrated, cross-functional governance teams that evaluate these pillars not as separate inputs, but as a holistic and constantly evolving picture of an asset’s true value and risk. This systemic view, enabled by real-time data and a culture of open collaboration, is the hallmark of elite portfolio decision-making.9
Section IV: Quantifying the Unquantifiable: Valuation Frameworks for R&D Assets
While the four-pillar framework provides the qualitative structure for evaluation, portfolio management in a high-stakes industry demands quantitative rigor. Decisions involving hundreds of millions of dollars cannot be based on intuition alone. This has driven a clear shift in the industry, moving beyond purely subjective assessments toward the adoption of more robust and defensible quantitative models.7 These frameworks provide a standardized basis for comparing diverse projects—an “apples-to-apples” comparison—and enable informed trade-offs in the allocation of scarce resources.7 The spectrum of these tools ranges from simple screening models used for initial triage to highly complex financial simulations designed to capture the nuances of risk and flexibility.
4.1 From Subjective to Objective: The Spectrum of Decision Models
The process of selecting R&D projects for investment is not a single event but a staged process of escalating scrutiny. It would be impractical and prohibitively expensive to apply the most rigorous financial models to every initial idea. Therefore, most organizations employ a “triage” approach, using simpler, less data-intensive screening models at the outset to quickly sort proposals into three categories: “yes” (acceptable for further, more detailed evaluation), “no” (unacceptable and dropped from consideration), and “maybe” (questionable projects to be reconsidered only if the “yes” category fails to yield enough opportunities).6 This initial screening acts as a filter, ensuring that the more resource-intensive quantitative analyses are reserved for a smaller pool of the most promising candidates. The models used in this process exist on a spectrum, moving from the qualitative and subjective to the quantitative and objective.
4.2 Foundational Tools: Scoring Models and Risk-Reward Matrices
At the simpler end of the quantitative spectrum are tools designed to structure subjective judgments and facilitate high-level comparisons. These methods are particularly useful for early-stage screening and for fostering strategic conversations among decision-makers.
Scoring and Profile Models: These are among the oldest and most popular screening methods.6 The process begins with creating a checklist of success factors that are critical to the company, such as strategic fit, degree of unmet medical need, scientific novelty, and competitive advantage.6 Each of these factors is then assigned a weight based on its relative importance to the organization’s goals. For each project under consideration, a team of experts provides a score on each factor (e.g., on a scale of 1 to 5). The score is multiplied by the weight, and the resulting values are summed to produce a single, quantitative “value score” for the project.6 This allows for a rank-ordering of projects and the application of a cutoff threshold for advancement.35
A Profile Model is a visual extension of this concept. Instead of summing the scores into a single number, the ratings for each criterion are plotted on a graph. When the points are connected, they form a visual “profile” of the project’s strengths and weaknesses.6 This can be particularly powerful for comparing multiple projects across a long list of attributes, as the visual profiles make differences immediately apparent. More recently, AI-driven scoring models are being developed to enhance this process by systematically assessing candidates against a multitude of criteria, leveraging vast datasets to provide more objective and data-backed scores.36
Risk-Reward Matrices: These are powerful visual tools for portfolio analysis that plot projects on a two-dimensional grid, typically representing some form of risk or challenge on one axis and reward or attractiveness on the other. A classic example, used by Boehringer Mannheim, plots projects based on “Market Attractiveness” versus “Competitive Position”.6 A diagonal line divides the matrix into a “promising” zone (high attractiveness, strong position) and a “dangerous” zone (low attractiveness, weak position), providing an intuitive snapshot of the portfolio’s health.6
Another common variant is the four-quadrant matrix that categorizes projects to help ensure portfolio balance 37:
Pearls (High Reward, High Probability of Success): Ideal projects that should be fully funded and accelerated.
Oysters (High Reward, Low Probability of Success): High-risk, high-reward bets. These are potential breakthrough innovations but require careful risk management.
Bread and Butter (Low Reward, High Probability of Success): Safer, incremental projects that provide steady, predictable value.
White Elephants (Low Reward, Low Probability of Success): Projects that consume resources with little promise. These are prime candidates for termination.
While these matrices are excellent for facilitating strategic discussions and providing a high-level overview, their limitations must be acknowledged. Critics point out their poor resolution; they can group quantitatively very different risks into the same broad category (“range compression”) and can even be misleading, assigning a higher risk rating to a quantitatively smaller risk.38 Their primary value lies not in generating a definitive numerical answer but in creating a shared framework for a leadership team to debate the strategic balance of their portfolio.
4.3 The Industry Standard: Risk-Adjusted Net Present Value (rNPV)
When it comes to the rigorous financial valuation of individual R&D assets, the risk-adjusted Net Present Value (rNPV) model is the undisputed industry standard.25 It has become the “lingua franca” of biopharma valuation, underpinning nearly every major strategic and financial decision, from internal go/no-go choices to multi-billion-dollar licensing and acquisition deals.39
The standard Net Present Value (NPV) calculation involves forecasting all future cash inflows (revenues) and outflows (costs) associated with a project and discounting them back to their value in today’s dollars using a discount rate. However, a standard NPV is a blunt instrument for drug development because it typically uses a single, high discount rate to account for all forms of risk, including the unique and substantial risk of technical and regulatory failure.39
The key innovation of the rNPV model is that it decouples these risks.39 The mechanics are as follows 22:
Forecast Cash Flows: Detailed, phase-specific forecasts are made for all future costs (R&D, manufacturing, marketing) and potential revenues (peak sales projections, sales ramp-up, and decline post-patent expiry).
Determine Probabilities of Success (PoS): A probability of successfully completing each development phase and achieving regulatory approval is estimated. These PoS figures are typically based on historical industry benchmarks for the specific therapeutic area and modality, and are then adjusted for project-specific factors.
Risk-Adjust the Cash Flows: The forecasted cash flows for each year are multiplied by the cumulative probability of the asset successfully reaching that point in time. For example, the potential revenues in year 10 are adjusted by the probability of the drug making it through all clinical phases and getting approved.
Discount to Present Value: These newly risk-adjusted cash flows are then discounted back to the present using a more conventional discount rate (like the Weighted Average Cost of Capital, or WACC), which now only needs to account for the time value of money and normal market risk, not the unique development risk.
This approach provides a far more granular and conceptually sound valuation. It allows for the modeling of clear value inflection points; the rNPV of an asset jumps significantly upon the successful completion of each clinical phase because a major layer of risk (and thus a probability adjustment) has been removed.5 However, the credibility of any rNPV analysis is entirely dependent on the rigor and evidence supporting its inputs. The adage “garbage in, garbage out” applies with full force. An inflated peak sales forecast or an overly optimistic PoS will produce a misleadingly high valuation, potentially leading to poor capital allocation and value-destructive decisions.39
4.4 Capturing Flexibility: The Power of Real Options Analysis (ROA) and Decision Trees
While rNPV is the industry workhorse, it has a significant theoretical limitation: it is a static model that assumes a fixed, pre-determined development path. It fails to capture the value of one of the most important assets a management team possesses: flexibility. This is where more advanced methodologies like Real Options Analysis (ROA) and Decision Tree Analysis come into play.
Real Options Analysis (ROA) is a valuation technique borrowed from financial markets that views an R&D project not as a single, linear investment, but as a series of “options”.40 At each stage gate, management has the option—but not the obligation—to make a further investment to proceed to the next phase. They also have the option to expand the project (e.g., into new indications), pause development to await new information, or abandon the project entirely if the data is unfavorable.25 This managerial flexibility has real economic value, especially in the highly uncertain environment of early-stage R&D. By treating each development stage as a call option on the value of the subsequent stages, ROA can provide a more accurate, and typically higher, valuation for early-stage assets than a static rNPV model, which might undervalue them by not accounting for this flexibility.25
Decision Tree Analysis is a complementary tool that visually and analytically maps out the sequential nature of R&D decisions.7 A decision tree starts with an initial decision point (e.g., “Invest in Phase II”) and then branches out to show the various possible outcomes (e.g., “Trial Succeeds,” “Trial Fails”). Each branch is assigned a probability of occurrence and an associated financial value (cost or payoff). By working backward through the tree, one can calculate the expected value of different strategic paths and identify the optimal course of action at each critical milestone.9 This method is particularly useful for modeling complex scenarios with multiple decision points and sources of uncertainty, providing a clear framework for understanding the ramifications of strategic choices.
Choosing the right valuation tool is a strategic decision in itself. The following table provides a comparative analysis of these key methodologies, offering a guide for when and how to deploy each one for maximum effect.
Table 2: Comparative Analysis of Key Valuation Methodologies
Methodology
Core Principle
Key Inputs
Strengths
Weaknesses/Limitations
Best Use Case in Pharma R&D
Scoring Models / Profile Models
Ranks projects based on a weighted sum of scores across multiple qualitative and quantitative criteria.
Strategic criteria (e.g., strategic fit, unmet need), weights for each criterion, expert scores for each project.
Simple to implement, highly flexible, good for incorporating non-financial factors, excellent for facilitating strategic discussion.
Subjective, can be influenced by bias, scores can be difficult to defend externally, may not directly correlate with financial value.
Early-stage screening and triage of a large number of initial proposals; High-level portfolio balancing discussions.
Risk-Reward Matrix
Visually categorizes projects into quadrants based on two dimensions (e.g., risk vs. reward) to assess portfolio balance.
Project-level estimates of risk (e.g., technical, market) and reward (e.g., NPV, market size).
Highly visual and intuitive, facilitates communication with senior leadership, helps identify portfolio gaps or over-concentration.
Poor resolution (can group dissimilar risks), sensitive to axis definitions, lacks granularity for individual project valuation.
High-level portfolio review meetings to discuss overall strategic balance and resource allocation priorities (e.g., “Do we have enough ‘Oysters’?”).
Risk-Adjusted Net Present Value (rNPV)
Calculates the present value of a project’s future cash flows, with each cash flow adjusted by the probability of technical and regulatory success (PoS).
Industry standard, financially rigorous, directly links R&D risk to value, provides a clear monetary value for comparison and deal-making.
Can be complex and data-intensive, highly sensitive to input assumptions (“garbage in, garbage out”), static model that ignores managerial flexibility.
Valuing individual mid-to-late-stage assets; The primary tool for licensing, M&A, and internal go/no-go decisions on major programs.
Real Options Analysis (ROA)
Values the managerial flexibility inherent in R&D projects by treating each stage as a financial option on the value of future stages.
All rNPV inputs plus volatility of asset value, time to decision, risk-free rate.
Conceptually superior for uncertain projects, captures the value of flexibility (to abandon, expand, delay), often yields a more accurate (higher) valuation for early assets.
Complex to calculate and explain, inputs like “volatility” are difficult to estimate, less widely used and understood than rNPV.
Valuing high-risk, high-uncertainty early-stage assets or platform technologies where future development paths are numerous and flexible.
Sources:.6
Section V: Taming the Human Factor: Mitigating Risk and Cognitive Bias
The pharmaceutical R&D portfolio exists in a world of profound uncertainty. Even with the most sophisticated quantitative valuation models and strategic frameworks, the decision-making process is ultimately a human endeavor. This introduces a powerful and often underestimated variable: the human mind, with its inherent cognitive biases, flawed incentives, and susceptibility to social dynamics. A failure to actively manage this human factor can undermine the most rigorous analytical process, leading to suboptimal decisions and value destruction. Therefore, a critical component of elite portfolio management is the implementation of systems and a culture designed to mitigate both objective project risks and the subjective biases of the decision-makers themselves.
5.1 A Taxonomy of Risk: Technical, Regulatory, Commercial, and Systemic
The risks confronting an R&D portfolio are multifaceted and can be categorized into four primary domains. Effective risk management requires identifying and developing mitigation strategies for each.34
Technical/Scientific Risk: This is the most fundamental risk—that the drug candidate will simply not work as intended. It may fail to demonstrate efficacy in clinical trials, or it may reveal an unacceptable safety or toxicity profile that prevents its further development.4 Mitigation at the project level involves conducting robust and well-designed preclinical and early clinical studies to gain as much information as possible before committing to larger, more expensive trials.
Regulatory Risk: This is the risk that a drug, even if clinically effective, will not be approved by regulatory agencies like the FDA or EMA. This could be due to an incomplete data package, concerns about the risk-benefit profile, or disagreements over the proposed label.5 Mitigation involves early and frequent communication with regulators, designing trials with clear, approvable endpoints, and having a deep understanding of the current regulatory landscape.
Commercial Risk: This is the risk that an approved drug will fail to achieve its commercial targets. This can happen for numerous reasons: payers may refuse to reimburse it at the target price, physicians may not adopt it, or a superior competitor may enter the market.6 Mitigation strategies include thorough market research, developing a strong value proposition for payers and providers, and effective marketing and sales execution.
Systemic Risk: This is a portfolio-level risk that arises from a lack of diversification. If a company’s portfolio is heavily concentrated in a single therapeutic area, modality, or, most dangerously, a single biological hypothesis, the entire portfolio can be jeopardized by a single negative event.41 The most cited example is a portfolio based entirely on the amyloid hypothesis for Alzheimer’s disease; the repeated failures of drugs targeting this mechanism would have led to a systemic, portfolio-wide failure.41 The primary mitigation for systemic risk is strategic diversification—balancing the portfolio across different therapeutic areas, stages of development, and scientific mechanisms of action to ensure that the failure of one part does not bring down the whole.8
5.2 The Enemy Within: How Cognitive Biases Distort Portfolio Decisions
While project risks are external challenges to be managed, a more insidious threat comes from within: the cognitive biases that are hardwired into human psychology. These mental shortcuts and emotional responses can systematically warp judgment and lead decision-makers astray, even when they have access to high-quality data. In the high-pressure, high-uncertainty environment of pharmaceutical R&D, these biases are particularly potent and can have devastating financial consequences.3
A comprehensive review of portfolio management practices has identified several key biases that are frequently observed in the industry 3:
Confirmation Bias: The tendency to seek out, interpret, and recall information in a way that confirms one’s pre-existing beliefs. In a pharma context, a project team that is convinced their drug is a winner may subconsciously over-emphasize positive data points while dismissing or explaining away negative signals.
Champion Bias: This occurs when a project is over-valued due to the influence of a powerful, charismatic, or highly respected internal advocate (the “champion”). The champion’s conviction and reputation can cause others to suspend their critical judgment and overlook flaws in the project.
Sunk-Cost Fallacy: This is the irrational tendency to continue an endeavor once an investment of money, effort, or time has been made. A team might argue for continuing to fund a failing Phase II trial “because we’ve already spent $50 million on it,” even though that past investment is irrelevant to the future probability of success.
Groupthink & Consensus Bias: In a committee setting, the desire for harmony and consensus can override a realistic appraisal of alternatives. Individuals may suppress dissenting opinions to avoid conflict, leading the group to converge on a suboptimal decision. This is often exacerbated by a fear of challenging authority or being seen as critical.3
Optimism Bias: A pervasive tendency to be overly optimistic, underestimating risks and overestimating the probability of success. This is especially common in the early stages of development, where data is sparse and ambiguity is high, allowing hope to triumph over objective assessment.
The impact of these biases is clear: they lead to the perpetuation of “zombie” projects, the misallocation of resources to pet projects over more valuable ones, and a systemic failure to “kill” unpromising candidates in a timely manner. The following table outlines these key biases and, more importantly, provides a toolkit of practical mitigation strategies that organizations can implement to de-bias their decision-making processes.
Table 3: Key Cognitive Biases in R&D Decision-Making and Mitigation Strategies
Cognitive Bias
Description in a Pharma Context
Potential Impact on Portfolio
Mitigation Strategy
Confirmation Bias
A project team selectively highlights data supporting their drug’s efficacy while downplaying or rationalizing negative safety signals.
A flawed drug is advanced to a more expensive phase, leading to a higher-cost failure later.
Mandate that project reviews explicitly present and address all contradictory evidence. Appoint a “devil’s advocate” or a “red team” to actively challenge the project’s core assumptions. 3
Champion Bias
A senior executive’s passion for a particular project, which they initiated, leads the governance committee to approve its progression despite mixed Phase II data.
Resources are allocated based on influence rather than objective merit, starving more promising but less-championed projects.
Implement a governance structure that separates the roles of project advocates from project evaluators. Utilize anonymous voting mechanisms to reduce social pressure. 3
Sunk-Cost Fallacy
A company continues to fund a struggling project, arguing “we can’t stop now, we’ve already invested $100M,” ignoring that future costs outweigh potential returns.
Good money is thrown after bad, draining resources that could be used to fund a new, higher-potential asset. “Zombie projects” clog the pipeline.
Frame decisions based exclusively on future costs, future risks, and future potential returns. Explicitly state that prior investment is irrelevant to the go/no-go decision. 3
Groupthink / Consensus Bias
In a portfolio review meeting, junior members with valid concerns remain silent for fear of contradicting senior leaders or disrupting group harmony.
A flawed consensus is reached, and critical risks are overlooked. The organization fails to learn from diverse perspectives.
Ensure genuine diversity (of thought, function, and seniority) on decision-making committees. Use structured techniques like pre-mortems (“Imagine this project has failed; what went wrong?”) to encourage critical thinking. Reward truth-seeking and constructive dissent. 3
Optimism Bias
Early-stage project teams consistently present overly optimistic timelines and probabilities of success, leading to an overvalued portfolio on paper.
The portfolio appears healthier and more valuable than it is, leading to poor strategic planning and resource allocation. The company is unprepared for the reality of failures.
Ground all projections in historical, benchmark data. Use external, unaffiliated experts to provide independent, unbiased assessments of timelines and success probabilities. 3
Sources:.3
5.3 Building a “Truth-Seeking” Culture: Frameworks for Objectivity
Mitigating bias is not just about individual training; it requires a fundamental shift in corporate culture and governance. The fight against cognitive bias is inextricably linked to incentive structures. A company that primarily rewards managers for advancing projects is structurally incentivizing optimism bias and the sunk-cost fallacy. Killing a project is often perceived as a career-limiting move.3
To truly foster objectivity, organizations must redesign these systems. The goal is to create a “truth-seeking” culture, as championed by AstraZeneca, where the primary objective is to find the right answer, not to defend a particular project.20 This involves several key cultural and structural changes:
Reward Objective Decision-Making: Incentives must be realigned. Managers should be rewarded for making high-quality, data-driven go/no-go decisions, regardless of the outcome for the specific project. A well-justified “fast fail” that saves the company hundreds of millions in future costs should be celebrated as a major success and a contribution to portfolio value.3
Ensure Psychological Safety: Leaders must create an environment where team members feel safe to speak up, challenge assumptions, and deliver bad news without fear of punishment or reprisal.3 This is the foundation of a “fearless organization” that can identify and address problems early.
Mandate Diverse and Independent Review: One of the most powerful tools for breaking bias is to involve external, unaffiliated experts in the review process.42 Structuring portfolio reviews like an NIH grant review panel, where independent subject matter experts assess the merit of a proposal, introduces a crucial layer of objectivity and eliminates internal politics and champion bias.42
Promote Team Diversity: Governance committees should be composed of individuals from diverse functional backgrounds (e.g., R&D, commercial, regulatory, finance), seniority levels, and even cognitive styles. This diversity of perspectives is a natural antidote to groupthink.3
Ultimately, taming the human factor is about building a system where the path of least resistance leads to the most objective decision. It requires leaders to recognize that the greatest risks to their portfolio may not be in the lab or the marketplace, but in the conference room where the decisions are made.
Section VI: Lessons from the Field: Case Studies in Portfolio Strategy
Theoretical frameworks and quantitative models provide the necessary tools for portfolio management, but their true value and limitations are best understood through the lens of real-world application. The history of the pharmaceutical industry is rich with case studies that offer powerful lessons in strategic decision-making. These stories of triumph, failure, and complex navigation illustrate the critical interplay of science, culture, risk, and commercial acumen. By examining these cases, we can distill the abstract principles of portfolio management into tangible, actionable insights.
6.1 The Architect of Success: AstraZeneca’s “5R” Framework & Eli Lilly’s Focused Differentiation
Some companies have achieved remarkable turnarounds in R&D productivity not by a single breakthrough drug, but by fundamentally re-engineering their portfolio decision-making process.
AstraZeneca’s “5R” Framework: In the early 2010s, AstraZeneca faced a significant productivity challenge. In response, the company implemented a rigorous, science-led strategic framework known as the “5Rs”.20 This framework mandates that every project moving forward must have strong evidence for the
Right Target, the Right Patient, the Right Tissue, the Right Safety, and the Right Commercial potential. This is not merely a checklist but a cultural shift towards a “truth-seeking” environment, where asking “killer questions” to test hypotheses early is paramount.20 The “5Rs” directly address the root causes of late-stage attrition by forcing a much higher standard of evidence before a candidate can enter the expensive clinical phases. For example, the “Right Patient” component drove a massive increase in the use of biomarker-guided patient stratification, with over 90% of their recent portfolio having a patient selection strategy, compared to less than 50% previously.20 The results of this process-driven approach have been dramatic: in the five years following its implementation, AstraZeneca saw a five-fold increase in the proportion of its pipeline molecules successfully advancing from preclinical to Phase III completion, from 4% to 19%—a rate far exceeding the industry average.20 This case demonstrates that success can be architected through a disciplined, systematic, and culturally embedded process.
Eli Lilly’s Focused Differentiation: Eli Lilly provides a powerful case study in leveraging deep R&D investment and focused portfolio choices to achieve market leadership.43 Rather than diversifying broadly, Lilly has pursued a strategy of “focused differentiation,” making substantial, long-term bets in specific therapeutic areas where it has deep expertise, most notably diabetes, obesity, and more recently, oncology and neuroscience.43 The company’s current success is built on a clear, innovation-based growth strategy that aligns portfolio decisions with these core corporate strengths.44 The launch of highly successful new medicines and a robust pipeline, featuring potential blockbusters like tirzepatide and donanemab, are the direct result of this focused approach.44 Lilly’s strategy highlights the immense value that can be created when a company has the conviction to concentrate its portfolio and R&D firepower on a few key areas, aiming for clear market leadership rather than incremental gains across many fields.
6.2 The Perils of a Flawed Hypothesis: The Torcetrapib Failure and the Alzheimer’s Graveyard
While success provides a blueprint, failure often offers more poignant lessons. The history of drug development is littered with high-profile failures that serve as cautionary tales about the inherent risks of biological research and the dangers of a flawed portfolio strategy.
Pfizer’s Torcetrapib: The story of Torcetrapib is a classic case study of a catastrophic late-stage failure. Torcetrapib was a cholesteryl ester transfer protein (CETP) inhibitor, a novel mechanism designed to raise levels of “good” HDL cholesterol.45 It was hailed as a potential multi-billion-dollar blockbuster, and Pfizer’s CEO at the time called it “one of the most important compounds of our generation”.46 The company invested over $800 million in its development. However, in December 2006, the pivotal 15,000-patient Phase III ILLUMINATE trial was abruptly terminated due to an “imbalance of mortality,” with significantly more deaths in the group receiving Torcetrapib compared to placebo.45
The post-mortem analysis raised a critical question for the entire field: was the failure due to the molecule or the mechanism? Evidence emerged that Torcetrapib had “off-target” effects, causing an increase in blood pressure and aldosterone levels, which could have contributed to the adverse cardiovascular outcomes.47 This suggested the problem was specific to the Torcetrapib molecule. However, the failure also cast doubt on the entire underlying hypothesis—that simply raising HDL levels is inherently protective against heart disease.45 This case is a stark reminder of the profound biological risk involved in pursuing novel mechanisms of action and the devastating financial and reputational impact of a late-stage failure, which can reverberate through the market and lead to downgrades of a company’s financial ratings.10
The Alzheimer’s Graveyard: The decades-long search for an effective Alzheimer’s disease (AD) treatment serves as a case study of portfolio-level systemic failure.41 Between 2002 and 2012, the AD drug development pipeline had an astonishing 99.6% failure rate.19 The list of failures is a veritable who’s who of the pharmaceutical industry, with major players like Eli Lilly (solanezumab), Roche (gantenerumab, crenezumab), Merck (verubecestat), and AstraZeneca/Lilly (lanabecestat) all experiencing high-profile late-stage disappointments.48
A key lesson from this “graveyard” is the danger of portfolio over-concentration on a single, unproven biological hypothesis. For many years, the vast majority of AD research and investment was focused on the “amyloid hypothesis,” which posits that the accumulation of amyloid-beta plaques in the brain is the primary cause of the disease.19 The repeated failure of drugs designed to target amyloid—whether by preventing its formation (BACE inhibitors) or clearing existing plaques (monoclonal antibodies)—suggested that this hypothesis might be incomplete or even incorrect.48 A portfolio based heavily on this single hypothesis was exposed to a massive systemic risk.41 This case powerfully illustrates the need for portfolio diversification not just at the level of therapeutic area or drug modality, but at the fundamental level of scientific mechanism, especially when tackling diseases with poorly understood biology.
6.3 The Price of a Cure: Gilead’s Sovaldi and the Commercial-Ethical Tightrope
Sometimes, a company can achieve a resounding scientific and regulatory success, only to face a near-catastrophic failure in the commercial and political arena. The case of Gilead Sciences’ Sovaldi (sofosbuvir) is a masterclass in this complex dynamic.
Sovaldi, launched in 2013, was a revolutionary, breakthrough treatment for Hepatitis C (HCV). It offered a cure rate of over 90% in as little as 12 weeks, with far fewer side effects than the previous standard of care, which involved debilitating interferon injections and had low success rates.49 From a scientific and clinical perspective, it was an unmitigated triumph.
The controversy erupted over its price. Gilead launched Sovaldi at $1,000 per pill, amounting to an $84,000 course of treatment.49 This price tag sparked an immediate and intense backlash from patients, payers, and politicians, culminating in a U.S. Senate investigation.49 Gilead’s pricing strategy, as revealed in internal documents, was not based on its R&D or manufacturing costs. Instead, it was a “value-based” price, benchmarked against the long-term costs of
not curing HCV—costs that included liver failure, cancer, and liver transplants, which could run into the hundreds of thousands of dollars.50 Gilead argued that by curing the disease, Sovaldi would ultimately
save the healthcare system money.50
While economically rational, this argument failed to win in the court of public opinion and with budget-conscious payers. The high upfront cost placed an enormous strain on healthcare systems like state Medicaid programs and the Department of Veterans Affairs, forcing them to ration access to the cure.51 The case of Sovaldi demonstrates that the “commercial viability” pillar of portfolio management is not just about market size and competitive positioning; it is also about navigating the complex and often emotional landscape of pricing, market access, and public perception. It shows that a portfolio decision can be scientifically brilliant and regulatorily sound but still become commercially and reputationally fraught if the company misjudges the external environment’s tolerance for its value proposition.
These case studies reveal that “success” and “failure” in portfolio management are not monolithic concepts. AstraZeneca’s turnaround was a triumph of process and culture. The Torcetrapib debacle was a failure of biological risk assessment. The Alzheimer’s pipeline represents a failure of portfolio-level diversification. And Gilead’s Sovaldi saga was a scientific success that nearly became a commercial and stakeholder management failure. This multidimensionality underscores a critical point: elite portfolio management requires integrated mastery across all these domains. A company can perfect its internal decision-making process but still fail if it bets on the wrong science. It can solve the biology but still hit a wall if it botches the commercial and political strategy. Therefore, the ideal portfolio governance body must possess deep, interconnected expertise across science, finance, strategy, and external affairs to navigate the full spectrum of challenges inherent in bringing a new medicine to the world.
Section VII: The Next Frontier: Emerging Trends Reshaping Portfolio Decision-Making
The pharmaceutical R&D landscape is not static. It is being continuously reshaped by powerful technological and strategic currents that are fundamentally altering the calculus of portfolio decision-making. Leaders who fail to understand and adapt to these trends risk managing their portfolios with an obsolete toolkit, making them vulnerable to more agile and forward-thinking competitors. Four trends, in particular, stand out as transformative: the rise of Artificial Intelligence, the shift to personalized medicine, the growing importance of Real-World Evidence, and the embrace of an externalized ecosystem model for innovation. These trends are not occurring in isolation; they are converging and reinforcing one another, creating a new paradigm for value creation in the industry.
7.1 The Digital Co-Pilot: AI and Machine Learning in Predictive Analytics and Resource Optimization
Artificial Intelligence (AI) and Machine Learning (ML) are rapidly moving from the realm of hype to practical, value-driving applications across the entire pharmaceutical value chain, from discovery to commercialization.52 For portfolio management, AI is emerging as a powerful “digital co-pilot,” enhancing decision-making by augmenting human intelligence with the ability to analyze vast and complex datasets at a scale and speed previously unimaginable.55
The impact of AI on portfolio strategy is multifaceted:
Predictive Analytics for Go/No-Go Decisions: The greatest promise of AI lies in its ability to improve the accuracy of R&D forecasting. By training algorithms on massive datasets—encompassing genomic data, preclinical results, historical clinical trial outcomes, scientific literature, and patent filings—AI models can identify subtle patterns and correlations that are invisible to human analysts.18 This can lead to more accurate predictions of clinical trial success, better identification of safety risks, and more reliable forecasts of a candidate’s overall probability of success. This enhanced predictive power directly improves the quality of go/no-go decisions, helping to reduce the costly rate of late-stage failures.18
Intelligent Resource Optimization: AI-powered tools can analyze an entire portfolio to optimize the allocation of finite resources like funding, personnel, and clinical trial capacity.36 By running thousands of “what-if” simulations, these models can help managers test various scenarios and make informed trade-offs to maximize the overall value and efficiency of the portfolio.36 This moves resource allocation from a process often driven by politics and inertia to a more dynamic and data-driven exercise.
Accelerated Competitive and Scientific Intelligence: A key challenge in portfolio management is staying abreast of the torrent of new scientific and competitive information. Natural Language Processing (NLP), a subfield of AI, can scan and interpret millions of scientific papers, clinical trial registrations, and patent filings in real-time.36 This dramatically accelerates the process of competitive intelligence, helps identify “white spaces” for innovation, and can uncover emerging therapeutic targets or technologies that should be considered for the portfolio.36
The strategic goal of these investments is to transform the R&D lab from a series of siloed, manual processes into a digitally enabled, highly automated, and ultimately “predictive” research environment.56 By streamlining workflows and leveraging data more effectively, companies aim to increase the number of Investigational New Drug (IND) approvals and significantly accelerate the overall pace of discovery, directly combating the negative trend of Eroom’s Law.56
7.2 The End of “One-Size-Fits-All”: Personalized Medicine, Genomics, and Niche Portfolios
For decades, the pharmaceutical industry’s business model was dominated by the pursuit of “blockbusters”—drugs designed to treat large patient populations with a “one-size-fits-all” approach. This model is now giving way to a new era of personalized medicine (also known as precision medicine), a transformative approach that aims to tailor medical treatment to the individual characteristics of each patient.57
This shift is driven by rapid advances in science and technology, particularly in the field of genomics. A greater understanding of the genetic and molecular drivers of disease has revealed that conditions like cancer or chronic kidney disease are not monolithic entities but collections of distinct subtypes, each with its own underlying biology.27 Personalized medicine uses this knowledge, along with sophisticated diagnostic tests, to predict which treatments are most likely to be safe and effective for a specific patient or patient subgroup.57
This has profound implications for portfolio strategy, marking a strategic pivot from the “blockbuster” to the “niche-buster” model. Instead of developing drugs for millions of undifferentiated patients, companies are increasingly focusing their portfolios on creating highly effective therapies for smaller, well-defined patient populations identified by a specific biomarker.27 These targeted therapies are often developed in tandem with a
companion diagnostic, a test required to identify the patients who are eligible for the treatment.20
This shift changes the entire risk-reward calculus of the portfolio. While the addressable market for any single personalized medicine may be smaller, the probability of clinical success is often higher because the drug is being tested in a biologically-homogenous population most likely to respond. Furthermore, the clear demonstration of value in a targeted population can support premium pricing and more favorable reimbursement.27 As a result, therapeutic areas that are amenable to this approach, such as oncology and rare diseases, have become central pillars of many R&D portfolios.8 The decision-making process must now incorporate not just the development of a therapeutic, but the parallel development and regulatory strategy for its essential diagnostic partner.
7.3 From Controlled Trial to Real World: The Ascendance of RWE in Demonstrating Value
The gold standard for proving a drug’s efficacy and safety for regulatory approval has long been the Randomized Controlled Trial (RCT). However, RCTs have inherent limitations: they are expensive, time-consuming, and are conducted in a small, highly controlled, and often homogenous patient population that may not reflect the diversity of patients seen in routine clinical practice.59
To bridge this gap, there is a rapidly growing reliance on Real-World Data (RWD) and the Real-World Evidence (RWE) derived from it. RWD refers to data relating to patient health status and/or the delivery of healthcare that is routinely collected from a variety of sources, such as electronic health records (EHRs), medical claims and billing data, disease registries, and data from wearable devices.60 RWE is the clinical evidence regarding the usage and potential benefits or risks of a medical product that is generated from the analysis of this RWD.59
The importance of RWE has been formally recognized by regulatory bodies worldwide. In the U.S., the 21st Century Cures Act of 2016 mandated that the FDA establish a framework for evaluating the use of RWE to support regulatory decisions.59 Similarly, the EMA in Europe is actively working to integrate RWE into its decision-making processes.61
This has significant implications for portfolio strategy. RWE is no longer just a tool for post-market safety monitoring. It is increasingly being used to:
Complement RCTs: RWE can provide a more comprehensive understanding of how a drug performs in broader, more diverse patient populations (e.g., those with co-morbidities) that are typically excluded from RCTs.59
Support Regulatory Submissions: RWE can be used to support the approval of new indications for already-marketed drugs or to fulfill post-approval study requirements.
Demonstrate Value to Payers: Payers are increasingly using RWE to inform their coverage and reimbursement decisions. They want to see evidence that a drug is not just effective in a trial, but also cost-effective and beneficial in the real world.59
For portfolio managers, this means that the strategic plan for an asset must extend beyond securing initial approval via an RCT. The plan must now include a strategy for generating robust RWE throughout the product’s lifecycle to support its long-term value proposition to regulators, payers, and physicians. Decisions about which data to collect and which RWE studies to conduct are becoming integral components of portfolio planning.
7.4 The Ecosystem Model: Strategic Alliances, Open Innovation, and the Role of CROs/CDMOs
The traditional model of the vertically integrated pharmaceutical company that handles every aspect of R&D in-house is becoming obsolete. The industry is rapidly shifting towards a more externalized, networked, and collaborative ecosystem model of innovation.3
This trend is driven by several factors. The sheer complexity and cost of modern science make it impossible for any single company to have best-in-class expertise in every relevant technology and therapeutic area. At the same time, a vibrant ecosystem of academic labs, biotech startups, and specialized service providers has emerged as a major source of innovation. To access this external science and maintain flexibility, large pharma companies are increasingly relying on partnerships, licensing deals, and acquisitions.3
A key manifestation of this trend is the explosive growth of outsourcing to Contract Research Organizations (CROs) and Contract Development and Manufacturing Organizations (CDMOs). Spending on these partners is growing at a faster rate (12-13% annually) than overall R&D spend (7-8% annually), and this trend is expected to accelerate.63 Companies are outsourcing nearly every aspect of drug development, from early target identification to the execution of global clinical trials and manufacturing.63
The portfolio implication of this shift is profound. The “portfolio” is no longer just a collection of internally generated assets. It is a complex, strategically managed ecosystem of internal programs, in-licensed assets from biotechs, collaborations with academic institutions, and deep partnerships with CROs and CDMOs. This requires a new set of core competencies for R&D leadership. The key skills are no longer just about managing internal projects, but about “ecosystem orchestration”: identifying the best external science, structuring effective deals and alliances, and integrating a network of partners to achieve a common goal.62 The strategic decision is no longer a simple “make vs. buy” but a more complex calculation of how to build and manage a flexible, hybrid portfolio that can access the best innovation, wherever it may reside.
These four emerging trends are not independent forces but are deeply convergent and mutually reinforcing. They are creating a new, integrated paradigm for pharmaceutical R&D. The massive datasets generated by genomics (personalized medicine) and EHRs (RWE) are the fuel for AI and machine learning algorithms. AI is the engine that makes sense of this data, enabling the identification of targeted patient populations and the analysis of real-world outcomes. This data-rich environment, in turn, makes the ecosystem model more effective, as companies can use data and analytics to more accurately identify and value the most promising external innovations.
The successful R&D organization of the future will not be a monolithic, self-contained inventor. It will be a nimble, data-driven “systems integrator.” Its core competency will be using AI as a central nervous system to analyze vast, continuous streams of internal and external data—genomic, clinical, real-world, and competitive. This analysis will inform the smartest decisions about which assets, whether internal or external, should be integrated into its portfolio to serve highly defined patient populations with maximum impact. In this new world, the portfolio itself becomes a fluid, networked entity, and the essential skill for leadership is no longer just drug development, but systems-level strategic orchestration.
Section VIII: Strategic Recommendations and Conclusion
The landscape of pharmaceutical R&D is one of unprecedented challenge and opportunity. The pressures of Eroom’s Law, the complexity of modern science, and the escalating expectations of regulators and payers demand a new level of strategic discipline and agility in portfolio management. The old models of decision-making, reliant on intuition, internal politics, and siloed analysis, are no longer sufficient. To thrive in the coming decade, organizations must fundamentally re-engineer their approach to portfolio strategy, embracing a more dynamic, integrated, objective, and forward-looking framework. This concluding section synthesizes the key findings of this report into a set of actionable recommendations for R&D leadership and offers a final perspective on the future of value creation in the industry.
8.1 Building a Resilient Portfolio for the Next Decade
To navigate the complexities of the modern R&D environment and build a portfolio capable of delivering sustainable value, organizations should adopt a strategy built on four core principles:
Embrace Dynamic Management: The era of the static annual portfolio review is over. In a world of real-time data and rapidly shifting landscapes, portfolio management must become a continuous, dynamic process. Leadership should invest in the systems and dashboards necessary to provide real-time visibility into the health of the portfolio.12 This enables the organization to react quickly to new data, whether it be a clinical trial failure, a competitor’s advance, or a new partnership opportunity, and to reallocate resources with agility.
Integrate the Four Pillars: Functional silos are the enemy of effective portfolio decision-making. Organizations must break them down by creating permanent, cross-functional governance bodies that evaluate assets holistically across the four pillars: scientific merit, commercial viability, regulatory pathway, and competitive/IP landscape. These teams, comprising experts from R&D, commercial, regulatory, finance, and business development, must be empowered to conduct integrated assessments, recognizing the deep interconnections between the pillars.9
De-Bias Decision-Making: Acknowledging the existence of cognitive bias is not enough. Organizations must proactively implement the cultural and structural safeguards necessary to mitigate its influence. This includes redesigning incentives to reward objective, high-quality decisions rather than mere project advancement; creating genuine psychological safety that encourages dissent and truth-seeking; and mandating the use of independent, external experts to provide unbiased assessments of key projects, particularly at major investment gates.3
Adopt a “Tools, Not Rules” Approach to Valuation: There is no single “perfect” valuation methodology. A sophisticated organization understands the strengths and weaknesses of each tool and deploys them strategically. Simple scoring models and matrices should be used for early screening and high-level strategic alignment. The industry-standard rNPV should be the workhorse for valuing mid-to-late-stage assets and for transaction-related diligence. Advanced methods like Real Options Analysis should be reserved for valuing high-uncertainty, early-stage assets where managerial flexibility is a key component of value.25 The goal is to build a flexible valuation toolkit and apply the right tool for the right job.
8.2 Key Imperatives for R&D Leadership
The shift to a more sophisticated model of portfolio management places new demands on R&D leadership. The role is evolving from that of a top scientist or operational manager to that of a strategic portfolio investor and ecosystem orchestrator. To succeed, leaders must focus on several key imperatives:
Be the Chief Strategist and Storyteller: The CEO and Head of R&D must articulate a clear, compelling, and consistent strategic vision for the portfolio.64 As exemplified by leaders like Flemming Ørnskov, they must be master storytellers, constantly communicating the company’s roadmap to the board, investors, and employees, explaining how each portfolio decision fits into the broader strategic narrative.64 This clarity of purpose is essential for maintaining alignment and conviction through the long and uncertain journey of drug development.
Champion a “Fail-Fast” and “Truth-Seeking” Culture: Leadership sets the cultural tone. R&D leaders must actively champion a culture that celebrates learning from failure and rewards objectivity. They must create an environment where terminating an unpromising project is seen as a success, not a failure, and where scientists are empowered to ask the tough “killer questions” that rigorously test hypotheses early.20
Master Ecosystem Orchestration: The future of innovation is networked. Leaders must shift their focus from purely internal management to mastering the art of ecosystem orchestration. This requires building world-class capabilities in business development, deal-making, and alliance management to identify and integrate the best external science from biotech, academia, and other partners into a cohesive and flexible portfolio.2
Invest in Foundational Capabilities for the Future: To prepare for the next wave of innovation, leaders must make strategic, long-term investments in the foundational capabilities that will define competitive advantage. This includes building robust infrastructure for data governance, scaling the use of AI and advanced analytics across the R&D organization, and deepening expertise in translational science and biomarkers to improve the odds of clinical success.56
8.3 Concluding Thoughts: The Future of Value Creation in Pharma
The pharmaceutical industry is engaged in an alchemist’s gamble of epic proportions, attempting to transmute the base metal of scientific discovery into the gold of life-changing medicines. The path is fraught with risk, the costs are immense, and the probability of success is dauntingly low. Yet, the moral and commercial imperative to continue this quest has never been stronger.
The analysis presented in this report makes it clear that navigating this challenge successfully requires a profound evolution in how portfolio decisions are made. The future of value creation will not be determined by the size of a company’s R&D budget, but by the sophistication of its decision-making process. Success will belong to those organizations that are the most strategically disciplined, the most analytically rigorous, the most culturally objective, and the most agile in adapting to a rapidly changing scientific and commercial world.67
By integrating the four pillars of evaluation, deploying a sophisticated toolkit of valuation methodologies, actively mitigating the distortions of human bias, and embracing the transformative potential of AI, personalized medicine, and open innovation, companies can significantly improve the odds in their favor. They can build resilient portfolios that balance risk and reward, and more efficiently translate capital into cures. Ultimately, the goal of mastering portfolio management is not an end in itself. It is the essential means to achieve the industry’s highest purpose: to harness the power of science to deliver transformative treatments, to make life better for millions of patients around the world, and to turn the hope of the laboratory into the reality of the clinic.44