We rarely know where our medicines originate. The global pharmaceutical supply chain is an opaque network of chemical synthesis facilities, contract manufacturers, and distribution brokers. For decades, the industry prioritized cost efficiency over geographic diversity. This strategy concentrated the production of active pharmaceutical ingredients in specific Asian regions. The resulting structure left the market exposed to regulatory shocks, sudden trade restrictions, quality control failures, and geopolitical friction.
Investors, policymakers, and corporate strategists now recognize that supply chain architecture dictates commercial survival. Understanding the origin of a medicine requires analyzing raw manufacturing data, regulatory filings, intellectual property frameworks, and capital expenditures. Through the application of advanced analytics and patent intelligence platforms like DrugPatentWatch, we can map these invisible networks. We use this data to predict competitive entry, forecast manufacturing demand, identify alternative suppliers, and de-risk billions of dollars in capital investments.
The Geographic Reality of Pharmaceutical Sourcing
The foundation of any medication is its active pharmaceutical ingredient. The geographic distribution of active pharmaceutical ingredient manufacturing reveals a stark imbalance in global production capacity. Over 80 percent of the world’s active pharmaceutical ingredient supply originates in China and India.1 The United States relies heavily on these two nations to stock its pharmacies and hospitals.
Asian Dominance in Active Pharmaceutical Ingredients
In 2024, China officially surpassed India as the top holder of new Active Pharmaceutical Ingredient Drug Master File filings.3 This metric tracks the registration of new manufacturing processes and facilities with the Food and Drug Administration. While China leads in new filings, India maintains its historical dominance in total manufacturing capacity for the United States market. India accounts for 48 percent of all total active Drug Master Files.3 China follows with 18 percent of the total active files.3
This shift in new filings indicates a forward-looking trend. Future generic drugs will rely even more heavily on Chinese infrastructure. This creates a delayed vulnerability that will manifest fully in the next decade. Industry analysts note that centralizing the global supply chain in a single country makes it vulnerable to interruptions by mistake or design.2 In the generic antibiotic sector, industry data indicates that certain foreign manufacturers previously colluded to sell products below market price.4 This pricing strategy successfully drove competing producers in the United States and Europe out of business, allowing the cartel to raise prices once they achieved a dominant market share.4
The Decline of Domestic Manufacturing Capacity
The United States holds a mere 8 percent of total active Drug Master Files, a decrease from 10 percent in 2021.3 The United States represented just 3 percent of new filings in 2024.3 Over the past decade, the number of United States laboratories that produce active pharmaceutical ingredients decreased by 61 percent, a loss of approximately 1,950 facilities.5
The European Union has experienced a similar structural decline. Europe’s share of active files dropped from 63 percent in 1981 to 6 percent in 2024.3 Despite the relative decline in global share, the European active pharmaceutical ingredient market maintains significant absolute scale. The market size reached $21.7 billion in 2024.6
API Category
2024 Capacity (tons)
2032 Projected Capacity (tons)
Projected CAGR (%)
Antibiotics
13,500
22,800
6.8
Cardiovascular
4,700
7,800
6.7
Analgesics
6,200
9,700
5.8
Oncology APIs
2,300
5,600
11.7
Table 1: European Active Pharmaceutical Ingredient Capacity Projections 6
The data shows that while domestic production in Western nations is growing in absolute terms, it fails to keep pace with the massive expansion of Asian contract manufacturing.
Uncovering Supply Chain Vulnerabilities
The dangers of geographic concentration are amplified by a fundamental lack of transparency regarding manufacturing origins. Pharmaceutical companies guard their supply chain data to protect profit margins and competitive advantages.7 The volume of a specific medicine produced by individual contract manufacturing organizations is rarely public knowledge. This opacity prevents procurement agencies from assessing true market capacity and identifying single points of failure.
The Valsartan Contamination Case Study
The 2018 contamination scandal illustrates the physical danger of this opacity. The Food and Drug Administration issued sweeping recalls for Valsartan, a generic blood pressure medication, after discovering unsafe levels of N-nitrosodimethylamine.8 The contamination stemmed from an undisclosed manufacturing process change at Zhejiang Huahai Pharmaceutical in China.8 The manufacturer altered the synthesis route to increase yield and lower costs. This change inadvertently generated the carcinogenic byproduct.
The European Medicines Agency calculated that the average level of N-nitrosodimethylamine detected in the affected batches could result in one extra case of cancer for every 5,000 patients taking the highest dose daily for seven years.9 Subsequent investigations expanded the recalls to include multiple manufacturers of angiotensin receptor blockers, revealing that numerous final drug brands relied on the exact same contaminated active pharmaceutical ingredient source.8 When one factory alters its chemical engineering protocols, the ripple effects can clear pharmacy shelves across dozens of countries.
Root Causes of Generic Drug Shortages
The intersection of supply chain concentration, rigid pricing models, and manufacturing complexities inevitably results in product shortages. The United States healthcare system recorded an all-time high of 323 active drug shortages in the first quarter of 2024.11 By December 2025, the number of active shortages declined to 216.11 Despite this numerical improvement, the impact on patient care remains severe. Fifteen percent of all active drug shortages involve controlled substances, impacting patients requiring pain management and attention deficit hyperactivity disorder treatments.11 Three-quarters of all active shortages at the end of 2025 originated in 2022 or later.11
Generic sterile injectables and oncology medications are highly susceptible to supply shocks.12 These products require specialized manufacturing facilities, strict sterility protocols, and complex raw materials. Chemotherapy agents like carboplatin and cisplatin experienced prolonged shortages extending over a year.13 When life-saving oncology drugs disappear from the market, hospitals must implement dose-sparing regimens, switch to less effective alternative protocols, prioritize allocations, and ration care.14
Margin Compression and Capacity Constraints
The root cause of generic drug shortages is fundamentally economic. The procurement model prioritizes the lowest possible unit price over supply chain reliability.12 Group purchasing organizations leverage their buying power to secure minimal prices for commodity generics, severely depressing manufacturer profit margins.12
These tight margins eliminate the financial incentive for manufacturers to invest in facility upgrades, redundant production lines, safety stock, and digital supply chain visibility tools.12 When a single manufacturing line fails a quality inspection, the manufacturer halts production. Because the market lacks redundant capacity, this localized failure instantly cascades into a national drug shortage.
Michael Ganio, Senior Director of Pharmacy Practice and Quality at the American Society of Health-System Pharmacists, testified before the Senate Special Committee on Aging regarding this structural flaw.15 He highlighted that the United States relies on two distinct supply chains: highly profitable brand-name products and low-margin generic products.16 Brand manufacturers have strong financial incentives to invest in supply chain resilience. Generic manufacturers face relentless downward price pressure, leaving them entirely dependent on the cheapest available foreign active pharmaceutical ingredients.16
Geopolitical Risks and Trade Dependencies
The reliance on single-source foreign suppliers creates acute geopolitical risks. The COVID-19 pandemic exposed the fragility of this system. Factory lockdowns in China and export restrictions enacted by the Indian government temporarily froze the flow of critical pharmaceutical materials.17 Even outside of pandemic conditions, trade tensions dictate supply availability. The imposition of tariffs or the revocation of trade privileges can render a long-standing supply route economically unviable overnight.
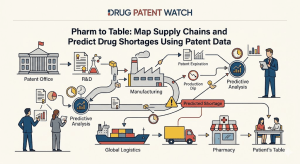
Transforming Patent Data into Supply Chain Intelligence
To navigate this opaque environment, we utilize patent intelligence. Patents act as forward-looking indicators of supply chain activity, competitive positioning, and manufacturing demand. Platforms like DrugPatentWatch transform raw regulatory filings into actionable supply chain intelligence.18
A drug’s clinical pipeline is essentially a statement of statistical probability, with 90 percent of candidates failing to reach commercialization.20 A granted patent paired with a Drug Master File indicates concrete manufacturing intent.21
The Orange Book as a Procurement Compass
The Food and Drug Administration maintains a database called “Approved Drug Products with Therapeutic Equivalence Evaluations.” The industry refers to this database as the Orange Book.19 It links approved drug products to their corresponding patents and regulatory exclusivities.19 This database is the central node for forecasting the loss of exclusivity.
When a blockbuster drug approaches the end of its patent life, the impending revenue drop is known as the patent cliff. Revenues for major drugs can drop by 59 percent in the first year following generic entry.20 By mining the Orange Book, procurement teams and investors can track exact expiration dates for drug substance patents, formulation patents, and method-of-use patents.21
The appearance of a Paragraph IV certification in the Orange Book acts as the earliest public signal of generic market entry.21 A generic manufacturer files this certification to challenge a brand’s existing patent. This action triggers a 30-month stay on final approval, effectively starting a countdown clock for supply chain build-out.19 The generic company utilizes this 30-month window to secure active pharmaceutical ingredients, scale up bioreactors, conduct bioequivalence studies, and finalize distribution contracts.19
DrugPatentWatch allows users to reconcile these Orange Book listings with court dockets to map precise supply chain timelines.22 By analyzing the number of Abbreviated New Drug Application filers against a brand drug, we can predict the intensity of the upcoming generic competition.21 A high number of filers signals a massive upcoming spike in demand for bulk active ingredients and contract manufacturing capacity.21
Tracking Drug Master Files for Vendor Intelligence
A Drug Master File is a confidential submission to the Food and Drug Administration containing detailed information about facilities, synthesis processes, and raw materials.23 The file allows a contract manufacturer to supply an active ingredient to a pharmaceutical brand without disclosing proprietary chemical engineering data directly to that brand.23 The brand simply includes a Letter of Authorization referencing the supplier’s file in its New Drug Application.23
Sourcing Active Ingredients Ahead of the Patent Cliff
For supply chain analysts, tracking the issuance of these files provides early visibility into global capacity. A European or Indian active pharmaceutical ingredient supplier must qualify under United States standards to supply a generic manufacturer targeting the American market.21 Generic manufacturers typically begin qualifying these suppliers 18 to 24 months before a target launch date.21
Vendors who monitor these filings can identify exactly when a generic manufacturer will require bulk raw materials, specialized packaging, and commercial-scale logistical support.21 DrugPatentWatch links International Nonproprietary Names with their respective patent portfolios across multiple jurisdictions, allowing procurement agencies to conduct accurate freedom-to-operate assessments.24 This ensures that secondary sourcing strategies do not inadvertently infringe on existing manufacturing process patents.24
Forecasting Competitor Manufacturing Timelines
Patent data reveals how manufacturing technologies are evolving, helping contract development and manufacturing organizations anticipate future capability requirements.18 When we observe a competitor filing a new formulation patent, it strongly indicates they are planning a product switch.19 They will likely attempt to move patients from the expiring original drug formulation to the newly patented formulation before generic competitors can enter the market.
The Economics of Patent Thickets
Pharmaceutical innovators actively manipulate legal timelines to protect their revenue streams. The primary mechanism for extending market monopolies is the patent thicket. A patent thicket is a dense web of overlapping exclusionary rights designed to prevent generic or biosimilar competition long after the original active ingredient patent expires.25
Anti-competitive tactics, including patent thicketing and product hopping, cost United States consumers over $40 billion in 2019.27 Companies construct these legal fortresses by filing dozens of secondary patents covering manufacturing methods, specific dosing regimens, extended-release coatings, and device delivery mechanisms.19
AbbVie and the Humira Biosimilar Delay
AbbVie’s management of Humira provides the clearest example of this strategy. Humira lost its European exclusivity in 2018, resulting in a 90 percent drop in regional sales.29 To prevent a similar collapse in the United States, AbbVie filed over 300 patent applications related to the drug, with approximately 160 ultimately issued.28 Over 90 percent of these applications were filed after the drug received its initial approval in 2002.28
Portfolio Characteristic
Humira (United States)
Humira (European Union)
Total Patents
136
~8
Core Distinction
80% Duplicative
Mostly Non-duplicative
Competitor Entry Delay
~7 Years post-API expiry
Launched near API expiry
Cost to Healthcare System
$7.6 Billion
Significantly Lower
Table 2: Regional Patent Thicket Comparison for Humira 25
This continuous stream of patent filings forced biosimilar competitors into costly litigation. Rather than risk a trial, competitors including Amgen, Sandoz, and Samsung Bioepis agreed to settlement terms.28 These settlements delayed the United States launch of Humira biosimilars until 2023.29 By utilizing this thicket, AbbVie protected billions of dollars in domestic revenue.29
Celgene and Volume-Limited Generic Entry
Celgene utilized a variation of this strategy for its oncology drug Revlimid. The company engineered a “patent slope” rather than a hard cliff.25 Celgene asserted secondary patents on specific polymorphic forms of the drug to force generic manufacturers into volume-limited settlements.25
These agreements capped the market share of generic entrants at single-digit percentages from 2022 until early 2026.25 Full, unlimited generic entry is only permitted after February 2026.25 This volume control mechanism allowed Celgene to increase the price of Revlimid by 300 percent over twenty years, rising from $6,000 to $24,000 per month.27
For supply chain managers, mapping a patent thicket is a core commercial requirement. Analyzing the volume and type of secondary patents filed by a brand allows competitors to anticipate these legal barriers. A drug might be clinically effective and easy to synthesize, but if a generic manufacturer cannot clear the legal thicket surrounding the dosage form or the delivery device, they cannot legally sell the product.
Federal Legislation and the Push for Transparency
The vulnerability of the pharmaceutical supply chain has prompted aggressive legislative intervention. Governments are moving to decouple critical healthcare infrastructure from geopolitical adversaries. This shift replaces the globalization doctrine of cost efficiency with a new mandate of national risk management.
The BIOSECURE Act and Chinese Biomanufacturing
The BIOSECURE Act fundamentally alters the global biotechnology landscape. Signed into law on December 18, 2025, the legislation restricts United States federal procurement and grants involving biotechnology products or services provided by Biotechnology Companies of Concern.31
The law targets specific foreign entities and aligns with the Department of Defense 1260H list of Chinese military companies operating in the United States.31 This framework restricts companies like BGI Group and MGI Tech.34 While early drafts specifically named contract manufacturing giants WuXi AppTec and WuXi Biologics, the final reconciled version relies on the 1260H list and subsequent designations by the Office of Management and Budget.33
The implications for the supply chain are severe. Executive agencies are prohibited from contracting with these entities.31 Entities receiving federal funds are prohibited from entering contracts that utilize equipment or services from these restricted companies.36 Using a restricted company to manufacture a drug substance renders that final pharmaceutical product ineligible for sale to federal agencies, including the Department of Veterans Affairs.31
The BIOSECURE Act provides a five-year safe harbor for existing contracts.31 Transitioning a pharmaceutical manufacturing process away from an established contract development and manufacturing organization is complex. Technical transfers require extensive process optimization, facility validation, analytical testing, and regulatory re-approval from the Food and Drug Administration.31 This disruption forces companies to evaluate alternative suppliers immediately, driving demand toward manufacturers in India, Europe, and the Americas.37
The MAPS Act and Essential Medicine Mapping
To address internal blind spots, a bipartisan coalition introduced the Mapping America’s Pharmaceutical Supply (MAPS) Act. The legislation aims to map the entire essential medicine supply chain from raw active ingredients to final hospital distribution.38
The MAPS Act requires the Department of Health and Human Services to maintain a definitive Essential Medicines List.38 The federal government must conduct a comprehensive risk assessment of this list to identify overreliance on high-risk foreign sources, evaluate domestic manufacturing capabilities, and pinpoint single-source chokepoints.38 The legislation mandates the use of data analytics to proactively assess vulnerabilities, moving the government away from reactive shortage management.38
The Food and Drug Administration proposed amending Section 502 of the Food, Drug, and Cosmetic Act to classify active pharmaceutical ingredients as misbranded if their labels do not include the original manufacturer and a unique facility identifier.39 This regulation addresses the accountability gap created when brokers repackage and relabel bulk ingredients without disclosing the original source.39
State governments are also forcing transparency regarding pricing and distribution. By 2025, multiple states enacted laws requiring comprehensive reporting from supply chain participants. A Florida statute requires drug manufacturers to report any wholesale acquisition cost increase of 15 percent or more over twelve months.40 Texas mandates that pharmacy benefit managers file annual reports detailing aggregated rebates, fees, and price protection payments collected from manufacturers.41
Following the Dollar: Intermediaries and Market Access
The pharmaceutical supply chain involves manufacturers, wholesalers, group purchasing organizations, and pharmacies.16 The financial relationships between these entities dictate the final price paid by patients and health plans. Pharmaceutical manufacturers establish the wholesale acquisition cost, which acts as the baseline price for the distribution network.42 The actual flow of capital diverges sharply from this list price.
Pharmacy Benefit Managers and Rebate Structures
Pharmacy benefit managers operate as the central intermediaries in the commercial market. Just three companies process nearly 80 percent of all equivalent prescription claims in the United States.43 These entities leverage their massive patient networks to negotiate rebates and discounts directly with drug manufacturers.44
In 2023, pharmacy benefit managers collected $140 billion in rebates and fees.45 The Pharmaceutical Research and Manufacturers of America points out that these middlemen rarely pass these negotiated savings down to patients at the pharmacy counter.46 Patient deductibles and coinsurance rates are calculated based on the undiscounted list price. Patients frequently pay more for a medication out-of-pocket than their insurer or benefit manager ultimately pays after rebates.44
This rebate model creates perverse incentives within the supply chain. Middlemen prefer to place drugs with high list prices and high rebates on their formularies. They actively exclude lower-cost generic or biosimilar alternatives that offer smaller profit margins to the intermediary.46 This dynamic explains why list prices continually rise while average net prices paid to manufacturers remain flat or decline. The system rewards high-priced brand drugs that offer large rebates over fundamentally cheaper generic alternatives.
The 340B Program and Hospital Profit Margins
The 340B drug discount program adds another layer of financial complexity to the supply chain. The federal program allows qualifying hospitals and clinics to purchase outpatient medicines at steep discounts.45 Hospitals purchase these drugs at reduced prices, bill commercial insurers at standard market rates, and retain the difference as profit.44
Large, tax-exempt health systems utilize the 340B program to boost their profit margins at the expense of patients and employers.45 The program has grown into a $66 billion market force.45 This drives consolidation, as hospitals acquire independent oncology and specialty clinics to expand their discount purchasing power and capture the spread between the discounted acquisition cost and the commercial reimbursement rate.
Reshoring and the Future of Pharmaceutical Manufacturing
The combination of tariff threats, the BIOSECURE Act, and pandemic-era supply failures has triggered a massive reallocation of manufacturing capital. Pharmaceutical companies are executing complex reshoring and nearshoring strategies to insulate their operations from geopolitical risk. The strategic objective is to move production out of high-risk jurisdictions and closer to the end consumer.
Company
Investment Location
Capital Committed
Focus Area
Eli Lilly
Lebanon, Indiana
$9.0 Billion
Synthetic API Manufacturing
Eli Lilly
Lebanon, Indiana
$4.5 Billion
Clinical Research & Foundry
Boehringer Ingelheim
Xochimilco, Mexico
$187.5 Million
Tablet Production
Bayer
Mexico
$160.8 Million
Regional Operations Expansion
Table 3: Key Pharmaceutical Reshoring and Nearshoring Investments 47
Eli Lilly and the Indiana Mega-Campus
The push to domesticate manufacturing has generated unprecedented capital deployment within the United States. To avoid tariffs and secure government contracts, pharmaceutical giants have committed more than $480 billion to domestic production facilities over the next decade.50
Eli Lilly is executing the most aggressive domestic expansion in the sector. The company increased its investment in a massive manufacturing campus in Lebanon, Indiana, to $9 billion.48 This site will focus on producing the active pharmaceutical ingredients for its blockbuster weight-loss and diabetes medications, Zepbound and Mounjaro.48
The Lebanon site represents the single largest investment in synthetic medicine active pharmaceutical ingredient manufacturing in United States history.48 Eli Lilly announced a separate $4.5 billion investment to create the Lilly Medicine Foundry within the same Indiana district.49 This facility combines advanced research with clinical-scale manufacturing. It allows the company to innovate production methods and secure materials for clinical trials without relying on foreign contract manufacturers.49
In total, Eli Lilly has committed over $50 billion to stateside investments since 2020.51 This capital is distributed across new sites in North Carolina, the acquisition of an injectable facility in Wisconsin, and $1.8 billion in upgrades to its legacy technology center in Indianapolis.51 These investments explicitly aim to reshore critical capabilities of small molecule chemical synthesis and strengthen the company’s supply chain against external shocks.53
Nearshoring to Mexico and Vietnam
As companies shift production away from China, nearshoring partners are capturing significant market share. Between 2018 and 2024, China lost 7.7 percentage points of its share of United States imports.54 Vietnam captured 2.1 percentage points of this displaced volume, and Mexico captured 2.0 percentage points.54
Mexico has emerged as a critical manufacturing hub for the pharmaceutical industry. The Mexican government recently registered over $2 billion in private pharmaceutical investments.55 A separate initiative tracked an additional $643 million in capital commitments from multinational firms.47
Boehringer Ingelheim committed $187.5 million to expand its manufacturing site in Xochimilco, transforming it into the company’s largest global plant for tablet production.47 The facility will produce 5 billion tablets annually for export to forty countries.47 Bayer pledged $160.8 million to expand its regional footprint, while Sanofi is finalizing a $150 million vaccine plant in the State of Mexico.47 Abbott is investing $150 million in a new catheter plant in Queretaro.55 These investments capitalize on the United States-Mexico-Canada Agreement and the logistical advantages of sharing a land border with the largest healthcare market in the world.
The ROI of Digital Supply Chain Management
Physical infrastructure requires digital coordination to achieve maximum efficiency. Pharmaceutical manufacturers are investing heavily in Supply Chain Management software, artificial intelligence, and digital twin technology. The global Pharma 4.0 market reached $18.7 billion in 2025 and is projected to exceed $40 billion by 2030.56
A digital twin is a dynamic virtual replica of a physical supply chain that continuously integrates live data to simulate outcomes and predict disruptions.57 By modeling inventory buffers, capacity constraints, and logistical routes, digital twins enable companies to perform scenario analysis without risking physical assets.57 Early adopters of digital twin technology report up to a 30 percent improvement in forecast accuracy and a 50 to 80 percent reduction in delivery delays.57
The return on investment for these digital systems is substantial. Smart manufacturing investments increase supply chain efficiency and reduce scrap waste.58 Scrap waste, particularly in complex biologic manufacturing, costs large pharmaceutical companies hundreds of millions of dollars annually.59 A top-10 pharmaceutical company expects to save $1 billion in drug development costs over five years by implementing data-driven supply chain and artificial intelligence tools.58
Companies like Amgen and Roche rely on smart manufacturing to optimize their footprint.58 Through platforms like IQVIA Transparency Reporting, global firms simplify their compliance burdens and consolidate data across dozens of affiliates.60 Transitioning from legacy systems to integrated digital platforms yields immediate cost savings while establishing the structural resilience required to survive trade wars and regulatory audits.
Key Takeaways
Geopolitical Decoupling Alters Manufacturing Geography: The BIOSECURE Act and persistent tariff threats are forcing companies to sever ties with Chinese contract manufacturers. This structural shift redirects billions of dollars in capital toward domestic mega-sites, such as Eli Lilly’s $9 billion Indiana facility, and nearshoring partners in Mexico.
Patent Data Drives Procurement Strategy: Analyzing the Food and Drug Administration’s Orange Book and Drug Master Files allows market participants to forecast exact manufacturing demand. Platforms like DrugPatentWatch convert legal exclusivity timelines into actionable capacity planning metrics.
Economic Flaws Perpetuate Drug Shortages: The generic procurement model prioritizes the lowest unit cost over supply reliability. This dynamic strips manufacturers of the capital required to build redundant capacity, directly causing persistent shortages of low-margin oncology and sterile injectable drugs.
Intermediaries Capture Supply Chain Margins: Pharmacy benefit managers and 340B hospital networks extract billions of dollars in rebates and markups. This opaque financial structure artificially inflates patient out-of-pocket costs while limiting the net revenue available to fund upstream manufacturing resilience.
FAQ
What is the BIOSECURE Act and how does it impact the pharmaceutical supply chain?
The BIOSECURE Act is a federal law that prohibits United States executive agencies from contracting with or providing grants to designated Biotechnology Companies of Concern. The legislation specifically targets entities linked to foreign adversaries, utilizing the Department of Defense 1260H list. The act forces pharmaceutical companies to decouple their supply chains from major Chinese contract manufacturers, requiring complex technology transfers and regulatory re-approvals to utilize new suppliers in allied nations.
How does DrugPatentWatch help companies navigate pharmaceutical supply chains?
DrugPatentWatch is an intelligence platform that aggregates global patent data, regulatory filings, and litigation records. It allows vendors, investors, and generic manufacturers to track patent expirations, identify early market entry signals like Paragraph IV filings, and map the supply network by linking active pharmaceutical ingredient Drug Master Files to final approved products. This predictive intelligence enables companies to time their market entry and scale manufacturing capacity efficiently.
Why are low-cost generic drugs frequently in shortage?
Generic drug shortages stem from the economics of the procurement market. Group purchasing organizations demand rock-bottom prices for commodity generics, leaving manufacturers with extremely thin profit margins. These tight margins prevent manufacturers from investing in facility upgrades, safety stocks, or redundant production lines. When a single manufacturing facility faces a quality control issue and halts production, the market lacks the backup capacity to prevent a widespread shortage.
How do Pharmacy Benefit Managers affect drug pricing?
Pharmacy Benefit Managers operate as middlemen who negotiate drug prices and formulate insurance coverage lists. They extract substantial rebates and fees from pharmaceutical manufacturers in exchange for favorable placement on these lists. However, these savings are rarely passed down to patients at the pharmacy counter. Because patient deductibles are usually calculated based on the high list price, patients often pay inflated out-of-pocket costs while the middlemen retain the negotiated rebates.
What is the role of a Drug Master File in the manufacturing process?
A Drug Master File is a confidential document submitted to the Food and Drug Administration that details the proprietary methods and facilities used to manufacture an active pharmaceutical ingredient or excipient. It allows a raw material supplier to provide essential safety and quality data to regulators without revealing trade secrets to the pharmaceutical brand purchasing the ingredient. Brands reference these files via Letters of Authorization when applying for approval of their final drug products.
Bolstering the Medication Supply Chain and Ameliorating Medication Shortages: A Position Paper From the American College of Physicians | Annals of Internal Medicine – ACP Journals, accessed March 25, 2026, https://www.acpjournals.org/doi/10.7326/ANNALS-25-00607