The global generic drug market reached approximately $491 billion in 2024. It is on track to exceed $926 billion by 2034. That growth rate is not a gift; it is a trap for any company that mistakes market expansion for durable margin expansion.
Here is the structural reality every generic drug executive navigates. Generic medicines account for roughly 90% of all prescriptions dispensed in the United States, yet they represent somewhere between 13% and 26% of total U.S. prescription drug expenditure. That gap is not a pricing anomaly. It is the business model. The entry of a single generic competitor drops brand-equivalent prices by close to 40%. Two competitors push prices down by more than half. In a market with six or more approved generics, prices can collapse by 95% from the original brand price. That arithmetic is not speculative. FDA’s own analysis of competition and price dynamics has documented it systematically.
The consequence is straightforward: generic drug markets are winner-take-most on cost, not on differentiation. No amount of sales force, brand equity, or product positioning makes up for a structurally higher manufacturing cost base. The company that can profitably sell a product at a price its competitors cannot sustain has the clearest possible competitive advantage in this industry. It can set prices low enough to drive out marginal producers while preserving adequate returns on capital. It can absorb the inevitable contract pricing pressure from Group Purchasing Organizations (GPOs), Pharmacy Benefit Managers (PBMs), and government formularies without sacrificing the economics of the program.
Cost optimization in this industry is not a finance function. It is the central act of strategy. Every decision that flows through R&D, manufacturing, supply chain, regulatory affairs, and business development either contributes to or erodes that cost position. This pillar page treats each of those domains with the rigor the subject deserves.
Key Takeaways: Section 1
The 95% price collapse that follows full generic market entry is a structural feature, not an edge case. Building a cost base that stays profitable inside that collapse is the only sustainable strategy. Companies that treat cost reduction as a periodic efficiency program rather than a continuous core competency will eventually be priced out of their own markets.
2. Anatomy of Generic Drug COGS: A Granular Breakdown
The Standard Cost Stack and Where the Numbers Come From
Understanding where the money goes inside a generic drug’s Cost of Goods Sold is the prerequisite for any serious optimization effort. Most discussions of generic drug economics begin and end at the API price. That is a mistake. Roughly half of all production costs sit outside the API, embedded in the processes, systems, and organizational structures that convert raw chemical inputs into finished, compliant, packaged product.
A representative oral solid dosage form generic breaks down roughly as follows across its COGS components.
The Active Pharmaceutical Ingredient (API) accounts for 50% to 52% of total manufacturing cost in a typical small-molecule oral solid. This percentage is not fixed. It shifts materially based on synthesis complexity, the number of manufacturing steps, raw material origin, and whether the company manufactures its own API or purchases it from a third party. A highly complex multi-step synthesis sourced from a single qualified supplier carries very different cost dynamics than a well-characterized molecule with four qualified API suppliers and an established commodity market.
Excipients and formulation materials account for roughly 5% to 10% of COGS in aggregate, though this varies considerably by dosage form. Oral solids at low drug loading run toward the lower end. Modified-release formulations, enteric-coated products, and drug-device combination generics carry substantially higher excipient costs. The global pharmaceutical excipients market was valued at approximately $9.5 billion in 2022 and is projected to approach $15 billion by 2033, reflecting a sustained trend toward more complex formulation platforms.
Direct labor typically represents 10% to 15% of manufacturing cost for conventionally manufactured oral solids. For highly automated facilities running continuous manufacturing (CM) lines, this percentage can fall below 5%. For complex sterile injectables manufactured in fill-finish environments with intensive manual handling requirements, it can exceed 20%. The variance is large enough that benchmarking direct labor against industry averages without controlling for dosage form and automation level produces misleading conclusions.
Manufacturing overhead and facility maintenance account for 10% to 20% of manufacturing cost. This includes utilities, HVAC qualification and maintenance, depreciation on GMP-compliant equipment, and the fixed cost base of operating a validated production site. The overhead burden on a 300,000-square-foot batch manufacturing facility running at 60% utilization looks very different from a purpose-built continuous manufacturing train occupying a fraction of that footprint.
Quality control and regulatory compliance together consume at least 25% of total manufacturing cost in well-run facilities, with compliance activities alone absorbing up to 25% of a site’s operating budget after raw materials. This figure shocks executives who think of quality as a department rather than a cost driver embedded throughout the production system. Out-of-specification (OOS) investigations, batch deviation reports, stability program maintenance, regulatory submission preparation, and the overhead of maintaining a quality management system that survives FDA inspection: all of that lands in this bucket.
Packaging and logistics account for 5% to 10% of COGS for standard oral solids. Cold-chain products, serialization-intensive programs, and products with specialized secondary packaging requirements push toward the upper end.
The Hidden Factory: Costs of Poor Quality
The most important number in any COGS analysis is the one that does not appear on the standard breakdown. The Cost of Poor Quality (COPQ) encompasses the scrap generated by failed batches, the labor consumed by OOS investigations, the production schedule disruption caused by unplanned deviations, the rework costs for non-conforming intermediates, and the opportunity cost of delayed releases. Industry analyses suggest total quality-related costs can reach 15% to 20% of revenue, with COPQ representing 10% to 15% of operational costs even in reasonably well-managed organizations.
A company with $500 million in annual generic drug revenue is likely absorbing $50 million to $75 million in COPQ annually, much of it invisible because it is spread across manufacturing variances, quality department headcount, and production schedule inefficiency rather than a single line item. Identifying and attacking that number is frequently more valuable than negotiating the API price down by 3%.
COGS Strategic Dashboard
Cost Component
Typical % of COGS
Primary Cost Drivers
Optimization Levers
API
50-52%
Synthesis complexity, raw material origin, supplier concentration, batch scale
Strategic sourcing, vertical integration, AI retrosynthesis, green chemistry, biocatalysis
Excipients & Formulation
5-10%
Drug loading, dosage form, excipient functionality, patent workarounds
Packaging material complexity, serialization, cold-chain requirements, distribution network
Standardization, network modeling, AI demand forecasting, freight audit
Investment Strategy: Reading the COGS Stack
For portfolio managers evaluating generic drug companies, gross margin performance relative to COGS components reveals more than headline numbers. A company reporting gross margins of 55% while running batch manufacturing on oral solids with no disclosed continuous manufacturing investment is likely carrying significant embedded COPQ that does not surface in public filings. Key questions to press in earnings calls and investor days: What is the batch failure rate by dosage form? What percentage of ANDA submissions achieve first-cycle approval? What is the year-over-year trend in quality-related costs as a percentage of net revenue?
3. The API Imperative: Strategic Sourcing, Vertical Integration, and Next-Generation Synthesis
The Geopolitics of API Supply
The API supply chain for the global generics market is structurally fragile in ways that most company disclosures understate. India supplies the largest share of finished generic drugs to the U.S. market, yet it sources an estimated 70% to 80% of its own APIs and key starting materials from China. For specific therapeutic classes, including antibiotics and antivirals, the concentration is more extreme: over 90% of the APIs flow from a single geographic source.
This creates a dependency chain that extends three tiers deep. A U.S. pharmacy dispensing a generic antibiotic is likely relying on a supply chain that runs: U.S. distributor, Indian finished-dose manufacturer, Chinese API producer, Chinese chemical precursor supplier. A disruption at any tier ripples the full length of the chain with amplified effect at each stage.
The tariff risk is not theoretical. The threat of a 25% U.S. tariff on Chinese pharmaceutical imports, which has been discussed in multiple policy contexts, would render a material portion of the current U.S. generic drug market economically unviable at prevailing prices. A 25% cost increase on an input that already represents 50% of COGS translates to a 12.5-point increase in the cost-to-revenue ratio. On a product with a 15% gross margin, that is an existential event.
The correct response is not to panic-onshore every API. That approach trades supply chain concentration risk for cost structure risk. The correct response is deliberate supply chain diversification combined with strategic vertical integration for the subset of APIs where in-house manufacturing creates a durable advantage.
Supplier Diversification: What ‘Multi-Source’ Actually Requires
Calling a supply base ‘diversified’ because it has two qualified API suppliers in the same Indian state is not diversification. Genuine API supply chain resilience requires qualified suppliers in geographically distinct regulatory jurisdictions, with independently validated manufacturing processes, independently qualified starting material chains, and independent logistics pathways.
The qualification process for a new API supplier typically takes 18 to 36 months from initial technical evaluation through DMF review and ANDA supplement approval. That timeline means the strategic decision to diversify must precede any anticipated supply disruption by at least two years. Companies that begin supplier qualification after a supply disruption has already occurred are managing a crisis, not building resilience.
Long-term supply agreements (typically three to five years) with volume commitments and price floors provide price stability and supply assurance at the cost of flexibility. The trade-off is acceptable for high-volume, price-stable products where supply continuity outweighs the cost of optionality. For products with volatile demand or rapid price erosion, shorter agreements with price adjustment mechanisms better match commercial reality.
Supplier Relationship Management (SRM) programs that move beyond transactional purchasing to collaborative process improvement can generate 5% to 15% API cost reductions over a three-year relationship. The mechanism is straightforward: sharing production forecasts and quality data with preferred suppliers allows them to optimize their own batch scheduling, raw material procurement, and capacity planning. They share a portion of those savings back via lower transfer prices. This is lifecycle costing in practice.
Vertical Integration as a Legal Strategy, Not Just an Operational One
The make-vs.-buy decision for API manufacturing has a dimension that standard capital allocation frameworks miss entirely. Under the Hatch-Waxman Act, the first generic company to file an ANDA with a Paragraph IV certification challenging an innovator’s patents, and to successfully resolve that challenge either through litigation victory or settlement, earns 180 days of marketing exclusivity. During that window, the market consists of only the brand and the first-filing generic. Gross margins during this period can reach 70% to 90% on high-revenue products.
Winning the race to first ANDA filing requires complete control over the critical path. That path runs through API synthesis and characterization, formulation development, bioequivalence studies, and the assembly of the ANDA itself. An API development and manufacturing capability held in-house eliminates the single most common source of timeline slippage: third-party API suppliers whose priorities, capacity constraints, and regulatory obligations are not aligned with the generic company’s filing deadline.
A company that can file on Day One of ANDA eligibility, with a complete submission built on in-house API data and validated manufacturing processes, has a structural advantage over a company that must wait for a third-party API supplier to complete a batch and generate certificates of analysis. In a contest where being six weeks late on a Paragraph IV filing means forfeiting the 180-day exclusivity to a faster competitor, API supply chain control is not just an operational advantage. It is a legal and commercial strategy.
The IP dimension of vertical integration extends further. A company that develops a proprietary, more efficient synthesis route for an API it manufactures in-house can patent that process, creating a secondary layer of IP protection around the manufacturing itself. Competitors who file their own ANDAs for the same molecule must develop different synthesis routes or license the process, increasing their development costs and timelines.
IP Valuation: API Process Patents as Core Assets
API process patents sit in a frequently undervalued category of pharmaceutical intellectual property. They are not composition-of-matter patents protecting the molecule itself (those belong to the innovator), but they are valuable for four distinct reasons.
First, they create freedom-to-operate differentiation. A generic company with a patented synthesis route for a high-volume product can challenge any competitor whose process is ‘not colorably different’ from its own, adding friction to market entry. Second, they generate licensing revenue. Companies unwilling to invest in in-house API manufacturing may pay royalties to license a more efficient process rather than build their own. Third, they protect manufacturing cost advantages. A 30% yield improvement resulting from an AI-optimized synthesis route, if patented, prevents competitors from replicating that cost structure for the life of the patent. Fourth, they represent real asset value in M&A. Acquirers conducting technical due diligence on generic drug companies increasingly value process IP as a forward-looking margin driver, not just a compliance document.
In DCF-based valuation of generic drug assets, API process patents should be modeled as a cost-side variable, not just a revenue-side one. A patented synthesis route that reduces the API cost from $120/kg to $80/kg on a product with 500,000 kg annual consumption represents $20 million in annual cost advantage. Capitalized at a modest 8x EBITDA multiple, that process patent is worth $160 million as a standalone asset, irrespective of any revenue upside.
AI-Driven Retrosynthesis: The 30% Cost Reduction Playbook
Traditional API synthesis route development follows an iterative experimental process: a medicinal chemist proposes a synthetic pathway, a process chemistry team runs laboratory-scale experiments to assess feasibility, and the route is progressively refined through multiple development campaigns. This approach is reliable but slow and expensive. A development campaign for a complex multi-step synthesis can consume 18 to 24 months and cost several million dollars before a single bioequivalence batch is manufactured.
AI retrosynthesis platforms change that calculus. These systems, trained on millions of documented chemical reactions from patent literature and journal databases, apply graph neural networks and reinforcement learning to work backward from a target molecule and identify candidate synthesis routes. They evaluate routes simultaneously across dimensions including number of synthetic steps, cost and availability of starting materials, reaction yield at each step, complexity of workup and purification operations, and projected environmental footprint.
The performance data is compelling. Case studies using these platforms demonstrate synthesis cost reductions of up to 30% and development time cuts of approximately 50% compared to conventional route development, driven primarily by the elimination of exploratory experimental campaigns that, in traditional development, confirm dead ends rather than identify optimal pathways. The AI narrows the experimental search space dramatically before a chemist runs a single reaction.
The commercial landscape for AI retrosynthesis is developing rapidly. Platforms such as Synthia (MilliporeSigma), ASKCOS (MIT), and proprietary systems at companies including Pfizer and AstraZeneca have demonstrated real-world utility. The strategic question for generic drug companies is not whether to adopt these tools, but how quickly to build internal competency versus licensing access from commercial platforms, and how to protect the process innovations these tools generate through appropriate IP filings.
AI Retrosynthesis Technology Roadmap
The adoption trajectory for AI retrosynthesis in generic API development follows a predictable maturation curve. The 2023-2025 period was characterized by proof-of-concept deployments on selected molecules, typically where synthesis complexity justified the investment. The 2026-2028 period will likely see systematic integration of AI route scouting into standard ANDA development workflows at leading companies, with route optimization running in parallel to traditional medicinal chemistry analysis rather than sequentially. By 2029-2031, companies with mature AI chemistry capabilities will likely use these platforms to identify and patent novel synthesis routes for molecules two to three years before their NCE patents expire, getting a three-to-five-year head start on generic competitors who wait until patent expiry to begin route development.
The regulatory dimension matters here. FDA’s Pharmaceutical Quality/Chemistry, Manufacturing and Controls (Q/CMC) guidance requires detailed characterization of the approved synthesis route. An AI-optimized route that differs substantially from the innovator’s process may require more extensive analytical characterization in the ANDA to demonstrate that process-related impurities are controlled to the same standards. Companies integrating AI retrosynthesis must pair that capability with robust impurity fate-and-purge studies to avoid regulatory surprises.
Green Chemistry and Biocatalysis: The Pfizer and Amgen Data Points
The green chemistry case for generic API manufacturing is simultaneously an environmental argument and a cost argument, and the cost argument is the stronger one in industrial practice.
Traditional chemical synthesis for APIs relies heavily on organic solvents, which can account for 85% of the total mass of materials consumed in a typical pharmaceutical synthesis. Solvents are expensive to purchase, expensive to handle under GMP conditions, expensive to recover or dispose of, and represent a significant share of the hazardous waste burden that pharmaceutical manufacturers must manage under environmental compliance programs. Reducing solvent consumption is not green washing. It is direct cost reduction.
Pfizer’s redesign of the sertraline (Zoloft) synthesis provides a well-documented example. The original synthesis used four hazardous reagents and generated large volumes of mixed organic solvent waste. The redesigned process used a single solvent (ethanol) and an enzyme catalyst, eliminated the four hazardous reagents, doubled overall product yield, and eliminated approximately two million pounds of chemical waste annually. On a product at commercial scale, that waste elimination translated directly to lower raw material costs, lower waste treatment costs, and lower insurance and environmental liability costs.
Amgen’s synthesis redesign for sotorasib (LUMAKRAS) eliminated a purification step that generated substantial solvent waste, producing estimated annual savings of approximately £3.17 million while improving yield. These are not marginal improvements.
Biocatalysis, specifically the use of engineered enzymes as catalysts, extends these gains. Enzymes operate under mild conditions, typically ambient temperature and neutral pH, which reduces energy consumption dramatically compared to reactions requiring high-temperature or high-pressure conditions. Enzyme-catalyzed reactions tend to be highly stereoselective, meaning fewer byproducts and simpler downstream purification. The challenge has historically been enzyme stability at industrial scale, but directed evolution and protein engineering techniques have produced engineered enzymes with industrial robustness across multiple classes of pharmaceutical synthesis reactions.
The convergence of AI retrosynthesis with green chemistry and biocatalysis creates a compound advantage. AI platforms can be specifically directed to identify synthesis routes that prioritize enzymatic steps, benign solvents, and high atom economy. The result is a development process that simultaneously finds the cheapest and the most environmentally compliant route, rather than treating those as competing objectives.
Key Takeaways: Section 3
API cost is the largest single lever in generic drug COGS, but the strategies for reducing it have moved well beyond price negotiation. Vertical integration functions as a legal strategy for winning 180-day exclusivity races, not just an operational one. AI retrosynthesis platforms can reduce development time by 50% and synthesis costs by 30%, and the process patents generated from these discoveries have standalone IP valuation value. Green chemistry implementation at the Pfizer scale generates millions of dollars in annual cost savings, not just regulatory goodwill.
Investment Strategy: API IP and Vertical Integration Premium
Institutional investors evaluating generic drug companies should apply a vertical integration premium when API manufacturing is tied to Paragraph IV strategy on high-revenue products. A company with proprietary API synthesis capability for a target product with $500 million in annual brand sales, combined with a first-to-file Paragraph IV certification, is worth materially more than a generic competitor relying on a third-party API supplier for the same program. The 180-day exclusivity upside is quantifiable; apply a probability-weighted NPV for the first-cycle litigation outcome. API process patents protecting the synthesis route add a further valuation layer, particularly if those patents have claims broad enough to challenge competitors’ ANDA amendments.
4. The Modern Factory Floor: Continuous Manufacturing, PAT, and AI-Driven Operations
Why the Pharmaceutical Industry Still Runs Batch Processes Designed in the 1960s
The pharmaceutical industry’s attachment to batch manufacturing is not irrational. Batch processes are well-understood by regulators, extensively validated in approved applications, and supported by a deep body of institutional knowledge and equipment manufacturer expertise. The technical risk of switching to continuous manufacturing is real, and for a company running 200 approved ANDAs across 15 dosage forms, the prospect of revalidating each product on a new platform is not a casual undertaking.
But the gap between pharmaceutical manufacturing productivity and comparable high-tech industries is now too large to rationalize as regulatory conservatism. The pharmaceutical industry’s average batch reject rate runs between 5% and 10%, a quality level below 2 Sigma. The semiconductor industry operates at 6 Sigma, with 3.4 defects per million opportunities. Food manufacturing, consumer electronics, and automotive manufacturing have all driven reject rates to levels that make pharmaceutical norms look like engineering from a previous era.
The cost consequence of that gap is direct. A 7.5% average reject rate on a manufacturing operation with $200 million in annual COGS represents $15 million in annual scrap and rework before accounting for investigation costs, schedule disruption, and the downstream regulatory burden of handling deviations.
Continuous Manufacturing: The Capital Investment Case
The economic case for continuous manufacturing (CM) starts with the facility footprint. A CM platform that integrates feeding, blending, granulation, compression, and coating into a single, compact train can accomplish in a room what a conventional batch plant accomplishes across an entire floor. Economic analyses of integrated CM versus batch manufacturing document capital expenditure reductions of 20% to 76% and operating cost reductions of 9% to 40%, depending on product volume, process complexity, and the degree of integration achieved.
Production cycle time is the most operationally visible benefit. A conventional oral solid dosage form moving through discrete batch steps with intermediate hold periods, in-process testing, and inter-department transfers can take three to six weeks from API receipt to finished goods release. The same product on a properly designed CM train can move from in-process to finished goods in hours to days.
That cycle time compression has downstream effects that standard ROI analyses undercount. Shorter cycle times mean lower work-in-progress inventory, less capital tied up in intermediates, and greater ability to respond rapidly to demand spikes without carrying excess safety stock. A CM facility can accelerate production to prevent a drug shortage in days rather than weeks. That responsiveness has commercial value beyond pure cost efficiency: it makes the company a preferred supplier for high-stakes procurement relationships with hospital systems and government formularies.
The CM Adoption Roadmap for Generic Drug Companies
Phase 1 (Years 1-2): Identify two to four high-volume, price-stable products with robust commercial forecasts. These are the candidates for CM conversion, not the entire portfolio. The economics of CM depend on utilization; a CM line running at 40% capacity is more expensive than a flexible batch line. Conduct feasibility studies on these target products and engage FDA early under the Quality by Design (QbD) framework to establish an agreed development and approval pathway.
Phase 2 (Years 2-4): Design, build, and qualify a CM facility for the target product set. This is the highest capital risk phase. Engage with CM equipment providers (GEA, Thermo Fisher, Continuus Pharmaceuticals) on process design. Conduct extensive design-of-experiment (DoE) studies to define the design space and the proven acceptable ranges for critical process parameters (CPPs) and critical quality attributes (CQAs). File the regulatory submission with full CM-specific documentation per FDA’s guidance on continuous manufacturing.
Phase 3 (Years 4-7): Operate and optimize. Use real-world production data and PAT feedback loops to continue improving yield and reducing scrap. Evaluate expansion of the CM platform to additional products. Begin building institutional knowledge on how to run regulatory submissions for CM-to-CM process variations rather than batch-to-CM conversions.
Phase 4 (Years 7+): The mature CM operation becomes the standard platform for new ANDA development. Products are developed for CM from inception rather than converted from batch. This is where the full cost advantage accrues.
First-mover advantage with regulatory relationships
Process Analytical Technology: Building Quality Into the Process
Process Analytical Technology (PAT) is the enabling infrastructure that makes CM and QbD operationally viable. The traditional pharmaceutical quality model measures product attributes after manufacturing and tests finished goods against specifications. This approach catches failures but does not prevent them. It is inherently backward-looking and adds no information that improves the manufacturing process going forward.
PAT reverses this logic. It uses in-line or at-line sensors, including near-infrared (NIR) spectroscopy, Raman spectroscopy, focused beam reflectance measurement (FBRM), and acoustic emission monitoring, to measure critical quality attributes in real time within the production stream. Blend uniformity, particle size distribution, moisture content, granule porosity, tablet hardness: all of these can be monitored continuously and used as real-time feedback inputs to control the process and hold it within its validated design space.
The economic data on PAT implementation is robust. Financial analyses report ROI exceeding 60% on PAT programs, driven primarily by four distinct savings streams. Laboratory labor costs drop by up to 90% as automated in-line measurement replaces manual sampling and off-line lab analysis. Inventory costs fall by approximately 50% as cycle times compress and in-process hold times eliminate. Integration with Lean manufacturing methodologies yields an estimated $6 million to $8 million in annual savings at a mid-sized manufacturing site. Scrap and rework costs decline as real-time process control prevents deviations before they result in batch failures rather than detecting them after the fact.
A PAT program also generates an asset that has value independent of immediate cost savings: a rich longitudinal dataset of process parameter and product quality attribute correlations. This dataset is the raw material for AI-driven process optimization, Golden Batch analysis, and predictive quality control models. Companies that install PAT instrumentation without building the data infrastructure to exploit those data streams are capturing only a fraction of the available value.
The AI Layer: Predictive Maintenance, Golden Batch Analysis, and Computer Vision QC
Artificial intelligence in pharmaceutical manufacturing is not a single technology. It is a layer of analytical intelligence applied across multiple operational domains simultaneously.
Predictive maintenance uses machine learning models trained on sensor data from manufacturing equipment, including vibration signatures, motor current profiles, and temperature trends, to identify the early signatures of impending mechanical failure. The economic case is compelling. Unplanned production line downtime in pharmaceutical manufacturing costs between $15,000 and $30,000 per hour when accounting for lost production, investigation costs, and regulatory documentation requirements. A predictive maintenance program that reduces unplanned downtime by 50% on a site with three major production lines running two shifts per day represents several million dollars in annual savings. FDA has noted the compatibility of predictive maintenance programs with GMP requirements in several guidance documents, removing a historical regulatory ambiguity that slowed adoption.
Golden Batch analysis applies machine learning to historical batch records, typically spanning thousands of batches and hundreds of process parameters per batch, to identify the specific combination of CPP ranges that correlates with maximum yield, minimum defect rate, and fastest cycle time. The output is a set of optimal process parameter targets that can be used to run the process in a way that consistently reproduces the best historical performance. The limitation of traditional statistical process control (SPC) is its inability to model complex, non-linear interactions between process parameters. Machine learning handles these interactions naturally. The value is not finding a golden batch by accident but engineering the conditions that produce it reliably at commercial scale.
Computer vision quality control uses high-resolution camera systems combined with convolutional neural network classifiers to inspect tablets and capsules at line speed for defects in color uniformity, physical integrity, print quality, and dimensional consistency. Systems running at 100,000 tablets per minute with defect detection rates exceeding 99.9% are commercially available and FDA-inspected regularly at sites across the U.S. and EU. Manual visual inspection at the same throughput would require multiple dedicated personnel per line and would produce significantly higher defect escape rates. The labor productivity improvement has been reported at over 30% in published case studies, and the reduction in defect escapes to finished goods reduces the downstream costs of field complaints, regulatory inquiries, and potential recalls.
Lean Six Sigma in Practice: The Acetaminophen Line Rebuild
Technology without rigorous operational methodology delivers suboptimal results. The case study from a facility manufacturing acetaminophen tablets illustrates what structured problem-solving achieves that technology alone cannot.
The site had significant backlogs in packaging, driven by downtime on blister packaging lines. The cause was not equipment age or API quality. It was broken half-tablets jamming the tablet feed chutes on a specific line (C80/2), a root cause that took a structured 7-step Lean Six Sigma investigation to identify with certainty.
The investigative approach combined Overall Equipment Effectiveness (OEE) data analysis to identify the largest sources of downtime, direct factory floor observation (Gemba walks) to characterize the physical failure mode, fishbone analysis to generate hypotheses, and a 5 Whys drill-down to trace the mechanism to its origin. The root cause: the feed hopper geometry created excessive pressure on tablets during transfer, causing breakage before tablets reached the compression chute.
The corrective action cost £30,000 and modified the riddle plate in the feed system to allow tablet fragments to exit the system before reaching the feed chute. Annual savings of £388,426 followed. The packaging backlog dropped by 84%. Line availability improved by 11 percentage points. The return on the £30,000 investment was 13x in year one.
The lesson is specific. A comprehensive OEE measurement system, a disciplined root cause methodology, and direct process observation identified a failure mode that would not have been visible to an AI system without prior process data, and that would not have been addressed by capital investment in new equipment. Operational excellence methodologies and advanced technology are complements, not substitutes.
Key Takeaways: Section 4
Continuous manufacturing reduces operating costs by 9% to 40% and capital requirements by 20% to 76%, but the investment case depends entirely on product portfolio volume stability. PAT programs deliver ROI above 60% while creating the process data infrastructure that powers subsequent AI optimization. Predictive maintenance cuts unplanned downtime by 50%. Golden Batch analysis and computer vision QC improve yield and defect rates at commercial scale. None of these technologies performs at its potential without the disciplined operational culture that Lean Six Sigma methodology provides.
Investment Strategy: Manufacturing Technology as IP
The manufacturing technology investments described above create competitive moats that are difficult to observe in public disclosures but material to long-run profitability. A company that has deployed PAT across its oral solid lines, built Golden Batch models for its top 20 products by revenue, and trained a predictive maintenance system on three years of equipment sensor data has an operational IP asset that a new entrant cannot replicate quickly. That advantage should be valued by institutional investors as a qualitative premium on stated gross margin trajectory, particularly when management commentary in investor presentations references specific OEE targets, first-cycle approval rates, and COPQ reduction programs.
5. Quality Economics: Turning the Cost of Quality Into a Profit Center
The COQ Framework: A Structural Reframe
The Cost of Quality (COQ) framework divides quality-related expenditure into four categories. Prevention costs cover the investments made to stop defects from occurring: process validation, quality planning, GMP training programs, and supplier qualification. Appraisal costs cover the expenditure on measuring and monitoring product and process quality: raw material testing, in-process inspections, finished product release testing, equipment calibration, and internal audits. Internal failure costs cover the financial consequences of defects discovered before product leaves the facility: scrap, rework, batch rejection, and OOS investigation. External failure costs cover the consequences of defects discovered after product reaches the market: recalls, complaint handling, and the regulatory fallout from quality failures in the field.
The standard industry finding, consistent across sectors and documented in pharmaceutical-specific studies, is that organizations spending heavily on prevention and appraisal have lower total COQ than organizations spending minimally on prevention and paying for it repeatedly through internal and external failures. The rule of ten captures this: fixing a defect at the incoming raw material stage costs $1. Finding it during in-process manufacturing costs $10. Rejecting a finished batch at release costs $100. Managing a market recall costs $1,000 or more per unit of defective product, before accounting for legal costs, regulatory penalties, and market share loss.
Applying this framework to pharmaceutical manufacturing: a company with a batch failure rate of 5% on a $200 million COGS base is generating approximately $10 million in direct internal failure costs annually. Preventing one percentage point of that failure rate through upstream process control investment (PAT, QbD) that costs $2 million returns $2 million in direct savings per year, plus the indirect benefits of reduced investigation labor, improved scheduling predictability, and lower regulatory burden. The IRR on systematic COPQ reduction programs routinely exceeds 100% over three years.
The ANDA First-Cycle Approval Rate as a Financial Metric
The ANDA regulatory review process is where the COQ framework intersects most directly with revenue timing. Before the Generic Drug User Fee Amendments (GDUFA) took effect in 2012, the median ANDA review time ran at 31 months, with a backlog reaching several thousand applications. GDUFA committed FDA to standard 10-month review timelines for complete, properly formatted ANDAs, funded by industry user fees.
That 10-month commitment applies to complete applications. An ANDA that draws an Information Request (IR) or a Complete Response Letter (CRL) re-enters the review cycle from the beginning of the next review period. Each review cycle adds 10 to 12 months to the approval timeline. A three-cycle application history, which is not uncommon, can extend the total review period to 30 months or longer, functionally equivalent to the pre-GDUFA experience.
For a generic product targeting a drug with $1 billion in annual brand sales, an 18-month approval delay on a first-filing ANDA translates directly to 18 months of foregone 180-day exclusivity revenue. At a conservative 40% gross margin on $500 million in first-year generic sales during exclusivity, that delay costs $300 million in gross profit. The investment required to achieve consistent first-cycle approval, which includes regulatory CMC expertise, data integrity programs, robust analytical method validation, and rigorous pre-submission review, is an order of magnitude smaller than that opportunity cost.
First-cycle ANDA approval rate is therefore both a quality metric and a financial metric. Companies that track and report this KPI are demonstrating regulatory sophistication. Companies that have never measured it are almost certainly leaving significant revenue on the table.
The Recall Arithmetic: Why External Failure Costs Dwarf Internal Ones
The financial anatomy of a pharmaceutical product recall illustrates why external failure costs are categorically different from internal ones. The direct costs of a Class I recall, which involves a reasonable probability of serious adverse health consequences, include logistics for product retrieval from the distribution channel, physical destruction of recalled inventory, customer notification obligations, regulatory correspondence, and internal investigation costs. For a widely distributed product, these direct costs routinely reach tens of millions of dollars.
The indirect costs are larger. A recall triggers heightened FDA scrutiny at the manufacturing site, which can escalate to a Warning Letter or consent decree if the investigation reveals systemic GMP deficiencies. A Warning Letter effectively freezes ANDA approvals for the affected facility until remediation is complete and re-inspected. A consent decree can impose independent third-party oversight and restrict facility operations for years. The opportunity cost of ANDA approvals lost during a Warning Letter period, for a facility with 50 pending ANDAs, can exceed $1 billion over the exclusivity windows foreclosed by the delay.
Market share impact compounds the direct and indirect financial damage. A company whose product is recalled loses its formulary position with hospital systems, GPOs, and PBMs. Rebuilding that position, once a quality concern has entered the buyer’s institutional memory, takes years and requires pricing concessions that further erode margin.
The prevention investment implied by this arithmetic is large. A company with $500 million in revenue should be willing to invest $15 to $25 million annually in quality system infrastructure if that investment reduces the probability of a Warning Letter or Class I recall by even a few percentage points per year.
Key Takeaways: Section 5
The batch failure rate, OOS investigation frequency, and first-cycle ANDA approval rate are three quality metrics with direct, quantifiable relationships to profitability. A 1-percentage-point improvement in first-cycle approval rate is worth hundreds of millions of dollars in NPV for a company with an active Paragraph IV pipeline. COPQ reduction programs with systematic prevention investment routinely deliver IRRs above 100%. External failure costs from recalls and Warning Letters dwarf all internal quality costs and can threaten a company’s entire ANDA approval pipeline through regulatory fallout.
6. Patent Intelligence and Market Entry: The First Lever to Pull
The most expensive decision a generic drug company makes is choosing which products to develop. The average development cost for a conventional generic, including formulation development and bioequivalence studies, runs from $2 million to $10 million. A Paragraph IV patent challenge adds $5 million to $10 million in legal fees. A complex generic or 505(b)(2) application can cost $25 million to $50 million. A biosimilar development program runs $100 million to $250 million.
These development investments are largely sunk by the time the ANDA is filed. If the product selected for development has a patent landscape that was not adequately analyzed, a competitive field that was not correctly assessed, or a commercial trajectory that was overestimated, the entire investment generates no return. The development cost is not recoverable.
This reality makes patent intelligence the highest-leverage activity in the generic drug development process, not the ANDA preparation or the bioequivalence study design. Identifying a product where the composition-of-matter patent has expired, the formulation patents are vulnerable on obviousness grounds, the method-of-use patents are narrow, and only one or two competitors have filed Paragraph IV certifications is more valuable than any manufacturing efficiency program. You cannot cost-optimize your way out of a bad product selection.
The Paragraph IV Certification: Anatomy of a First-to-File Race
A Paragraph IV certification is a legal statement filed with the FDA as part of an ANDA, asserting that a listed patent either is invalid, unenforceable, or will not be infringed by the proposed generic product. Filing a Paragraph IV certification triggers an automatic 30-month stay of ANDA approval while the innovator has the opportunity to sue the generic filer for patent infringement. The first generic company to file a substantially complete ANDA with a Paragraph IV certification for a given drug-patent combination earns the 180-day exclusivity if it prevails in the patent litigation (or if the innovator fails to sue within 45 days).
The 180-day exclusivity period is the most profitable window in the generic drug business. During this period, the first-filing generic competes only against the brand. Typical generic pricing during exclusivity runs at 20% to 50% below the brand price, capturing substantial volume from price-sensitive payers while maintaining margins orders of magnitude above the fully commoditized post-exclusivity price. A product with $2 billion in annual brand sales might generate $400 million in generic revenue during the 180-day window with gross margins above 60%. That is $240 million in gross profit from a single product in a single six-month period.
Identifying the best Paragraph IV candidates requires systematic analysis of multiple patent dimensions simultaneously. The composition-of-matter patent status determines whether the molecule itself is still protected. Formulation patents covering specific delivery technologies may add protection years beyond the composition patent. Method-of-use patents protecting specific indications can be designed around through carve-out labeling. Process patents protecting the innovator’s synthesis route can be avoided through alternative synthesis development. Secondary patents on metabolites, salts, polymorphs, or prodrugs represent the core tools of evergreening, the systematic extension of exclusivity through incremental IP filings that generic companies must identify and challenge to unlock the market.
Evergreening Tactics: The IP Technology Roadmap for Innovators
Understanding evergreening from the innovator’s perspective allows generic companies to predict which products are the best challenge targets and which are protected by robust secondary IP that will be difficult to invalidate.
A standard evergreening roadmap for an oral solid drug product runs through several sequential IP layers. The base composition-of-matter patent protects the active ingredient and expires typically 20 years from filing, with possible Patent Term Extension (PTE) of up to five years for regulatory review time consumed in the approval process. Pediatric exclusivity adds six months on top of any unexpired patent or regulatory exclusivity. The next layer typically involves formulation patents covering specific modified-release delivery technologies, which may expire three to seven years after the composition patent. Method-of-use patents protecting particular dosing regimens, patient populations, or indications add another layer.
Companies pursuing evergreening will also file patents on new polymorphic forms of the API, different salt forms with claimed bioavailability advantages, prodrug formulations, combination products, and new dosing devices. Each filing resets or extends the IP clock in some dimension, and each must be individually assessed for validity and infringement risk.
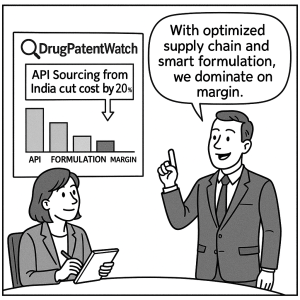
The patent thicket analysis, mapping all patents in the Orange Book for a given NDA alongside their expected expiration dates, PTEs, pediatric exclusivities, and existing Paragraph IV litigation history, is the core analytical product that informs go/no-go decisions in generic drug development. Platforms like DrugPatentWatch systematize this analysis, enabling companies to screen the entire universe of patent-protected drugs for Paragraph IV opportunities, monitor litigation developments that affect the competitive field, and assess the strength of specific patent claims that would need to be challenged in an ANDA.
The 505(b)(2) Pathway: Bridging Generics and Specialty Products
The 505(b)(2) regulatory pathway allows applicants to rely partly on existing published data or FDA’s previous findings of safety and efficacy for an approved drug, while also conducting their own studies to support differences from the reference product. This pathway is increasingly used for modified-release formulations, new dosage forms, new routes of administration, and new combinations of existing drugs.
From a cost optimization perspective, the 505(b)(2) pathway occupies a strategic middle ground between a standard ANDA and a full NDA. Development costs are higher than an ANDA (typically $10 million to $50 million) but lower than a full NDA. The product, if approved, may carry its own exclusivity as a new formulation, creating a protected window before generic competition. Companies with strong formulation science capabilities can use the 505(b)(2) pathway to generate proprietary product variants on the same molecules where they also pursue standard ANDA programs, layering a specialty product margin on top of the commodity generic volume.
Key Takeaways: Section 6
Patent intelligence is the highest-leverage investment a generic drug company makes. A superior product selection process, informed by systematic patent thicket analysis, Paragraph IV litigation tracking, and first-to-file competitive intelligence, generates more NPV than any operational efficiency program. The 180-day exclusivity prize from a successful first-filing Paragraph IV certification can generate hundreds of millions of dollars in gross profit from a single product. Evergreening analysis, which maps the full IP lifecycle of a target drug including all secondary patents and regulatory exclusivities, is a prerequisite for rational capital allocation in generic drug R&D.
Investment Strategy: Patent Cliff Calendars as Portfolio Tools
For portfolio managers, patent expiration calendars are foundational tools for identifying generic drug market entry opportunities. A drug approaching its first patent cliff, where the base composition-of-matter patent expires, creates a predictable market opportunity. But the value of that opportunity depends on whether the secondary IP is weak enough to allow first-to-file Paragraph IV challenges that accelerate entry before natural expiration, or strong enough to delay entry several years beyond the composition patent.
Companies that are consistently first-to-file on high-revenue Paragraph IV programs, with strong first-cycle litigation resolution rates, deserve a valuation premium for their patent intelligence capabilities. Tracking first-to-file rates and litigation outcomes for the top 20 generic companies provides a reliable proxy for the quality of their patent intelligence infrastructure.
7. Supply Chain and Logistics Optimization
The Working Capital Cost of Pharmaceutical Inventory
Pharmaceutical inventory management is a working capital problem as much as a logistics problem. Finished goods inventory in the pharmaceutical supply chain carries three overlapping costs that standard inventory carrying cost calculations often understate. Capital cost represents the opportunity cost of cash tied up in inventory rather than deployed in higher-return activities; a standard pharmaceutical distribution center might carry 60 to 90 days of supply, representing tens of millions of dollars in working capital for a mid-size generic company. Storage cost covers the physical infrastructure of temperature-controlled warehousing, which is expensive per-square-foot for products requiring cold chain or controlled substance storage. Obsolescence cost is the most variable and most dangerous: for pharmaceutical products with expiration dates, excess inventory that ages past its shelf life becomes a total write-off.
The optimal response to these compounding costs is demand forecasting accuracy, which determines how close to zero safety stock can be held without risking stockouts. The gap between a 70% accurate forecast and a 90% accurate forecast on a $50 million product line is not 20 percentage points of performance improvement. It is potentially $5 million to $10 million in annual inventory carrying cost savings and $2 million to $5 million in avoided obsolescence, depending on the product’s shelf life and demand volatility.
AI Demand Forecasting: From Market Signal to Production Schedule
The traditional approach to pharmaceutical demand forecasting uses historical shipment data as the primary input, lagged by the reporting delays of a multi-tier distribution system. The result is a forecast that describes what the market was doing two to three months ago rather than what it is doing now. In a market shaped by GPO contract cycles, formulary changes, and competitor supply disruptions, a three-month-lagged forecast is nearly useless for production scheduling on a continuous manufacturing line.
AI-based forecasting models consume a substantially broader data universe. Real-world prescription data (available from IQVIA, Komodo Health, and similar sources on a near-real-time basis) provides a direct signal of end-market demand rather than a distribution channel artifact. Epidemiological data on disease incidence and seasonal patterns improves forecast accuracy for products with seasonal demand. Competitor supply data, where observable through FDA shortage notifications or distributor channel checks, allows anticipatory production planning for market share shifts driven by competitor supply problems.
The practical improvement in forecast accuracy from ML-based approaches versus traditional statistical methods has been reported at 20% to 40% in pharmaceutical applications, depending on the product type and demand pattern. For a company managing 200 generic products with $1 billion in aggregate COGS, a 30% improvement in forecast accuracy translates to inventory reduction and obsolescence avoidance that justifies the technology investment many times over.
Network Optimization: Warehouse Location, Freight Mode, and Cold Chain
Distribution network design for generic drug companies involves trade-offs between speed, cost, and risk that are more complex than typical consumer goods logistics. FDA’s serialization requirements under the Drug Supply Chain Security Act (DSCSA) impose track-and-trace obligations that require serialized lot-level data at every node of the distribution chain, adding compliance infrastructure cost to every logistics transaction.
Network modeling, using commercial supply chain optimization software, identifies the optimal number and location of distribution centers, the appropriate inventory positioning across network nodes, and the cost-minimizing freight mode selections for each product-lane combination. A company currently operating five regional distribution centers may discover through network modeling that three strategically located facilities can serve the same geography at lower total cost by consolidating freight volumes and improving carrier contract leverage.
Cold chain logistics for temperature-sensitive products, including many biologics, vaccines, and certain specialty generics, adds a cost premium of 15% to 30% over ambient product logistics. Qualifying alternative cold chain carriers through a rigorous temperature excursion monitoring program, and establishing contractual performance standards with financial penalties for excursions, creates a competitive supplier market that drives cold chain costs toward the minimum consistent with product quality.
Freight audit and payment (FAP) programs recover 1% to 3% of total transportation spend through systematic identification of billing errors, rate misapplication, and duplicate invoices on carrier freight bills. On a $50 million annual transportation spend, a FAP program can generate $500,000 to $1.5 million in direct savings annually, with minimal incremental investment.
Key Takeaways: Section 7
AI demand forecasting delivers 20% to 40% accuracy improvements over traditional statistical methods, enabling inventory reductions that directly reduce working capital requirements and obsolescence risk. Distribution network modeling identifies consolidation opportunities that can cut total logistics cost by 10% to 20%. Freight audit programs recover 1% to 3% of transportation spend with minimal investment. Cold chain qualification and carrier competition can reduce the 15% to 30% cold chain premium by 3 to 5 percentage points for companies willing to invest in rigorous temperature mapping studies.
8. Company Case Studies: Teva, Sandoz, Sun Pharma, and Their IP Valuation Architectures
Teva Pharmaceuticals: The Hybrid Model and the Generics Powerhouse
Teva Pharmaceutical Industries is the largest generic drug company by revenue, with a portfolio spanning 3,600 products in approximately 60 markets. Its size creates both advantages and vulnerabilities. Scale generates purchasing power with API suppliers and contract manufacturers, but it also creates organizational complexity, manufacturing network fragmentation, and a COGS base that is difficult to move quickly.
The ‘Pivot to Growth’ strategy announced in 2023 under CEO Richard Francis has two core mechanics. The first is operational: generate approximately $700 million in net savings by 2027 through manufacturing network rationalization (reducing site count from 35 to 30), external spend optimization, and organizational delayering. The second is strategic: use the cash generated by a more efficient generics business to fund the build-out of an innovative product portfolio in CNS, oncology, and immunology.
The manufacturing network rationalization is the most operationally significant element for generic drug economics. Reducing 35 manufacturing sites to 30 means consolidating production volumes onto fewer, higher-utilization facilities, which should improve fixed cost absorption per unit across the retained network. The challenge is managing the regulatory complexity of production transfers: each product moved from a shuttered site to a retained facility requires an ANDA supplement with FDA, and the review queue for manufacturing supplements runs longer than for new applications. Teva has the regulatory infrastructure to manage this volume, but the timeline risk is real.
Teva: IP Valuation Architecture
Teva’s intellectual property position is more complex than that of a pure-play generic company. Its IP portfolio spans several distinct categories, each with different valuation drivers.
Generic drug Paragraph IV litigation history represents the clearest value. Teva has historically been one of the most prolific first-to-file ANDA filers in the U.S. market, with a track record of 180-day exclusivity wins on blockbuster drugs that has generated billions of dollars in earnings over decades. The forward value of Teva’s Paragraph IV pipeline depends on the aggregate revenue of the branded drugs targeted, the litigation win probability for each challenge, and the timing of potential market entry.
The biosimilar pipeline (13 biosimilars in development, five planned launches by 2027) carries substantially higher per-asset development costs but also much higher per-product revenue potential. Teva’s biosimilar IP strategy focuses on reference biologic characterization studies and the analytical method patents that protect manufacturing process comparability assessments. These are not composition-of-matter patents; they are the IP that defends the manufacturing know-how developed during biosimilar development against later-entering biosimilar competitors.
Copaxone (glatiramer acetate) has historically been one of Teva’s most important IP defensive battles. The drug’s complex polypeptide composition made it difficult for generic manufacturers to achieve the analytical comparability required for ANDA approval, and Teva’s layered patent filings on manufacturing processes and formulations delayed generic entry for years beyond the base patent expiration. The eventual entry of generic glatiramer acetate products illustrates the limits of evergreening defenses, but the timeline extension Teva achieved through its IP strategy added several billion dollars to the product’s cumulative revenue.
AUSTEDO (deutetrabenazine), a CNS product for tardive dyskinesia and Huntington’s disease chorea, is Teva’s highest-growth innovative asset as of 2024-2025. Its IP protection extends into the 2030s through a combination of composition-of-matter patents on the deuterated active ingredient and method-of-use patents. Deuterium substitution in drug molecules is itself a patent strategy: replacing hydrogen with deuterium at metabolically labile positions can slow metabolic degradation, potentially improving the PK profile and creating a patentable new chemical entity. For purposes of generic entry planning, deuterium-substituted drugs present novel challenges for Paragraph IV filers because the deuterium incorporation requires synthesis process development distinct from the protiated reference compound.
Investment read on Teva: The $700 million savings program and the biosimilar pipeline represent the two most material near-term value drivers. Investors should track manufacturing supplement filing volumes with FDA as a proxy for the pace of the network rationalization, and monitor the first five biosimilar launch timelines closely. A 90-day delay on a biosimilar with $300 million in first-year revenue potential costs approximately $75 million in gross profit at typical biosimilar launch margins.
Sandoz: Pure-Play Optimization and the 24-26% EBITDA Target
Sandoz’s spin-off from Novartis in October 2023 created the only pure-play generics and biosimilars company of global scale among publicly listed pharma names. Without a branded innovation arm to cross-subsidize, Sandoz must justify its cost structure and capital allocation on generic drug economics alone. That constraint is, counterintuitively, a strategic advantage: it forces operational discipline that diversified pharma companies can dilute with innovation-side capital allocation.
The core financial target, a core EBITDA margin of 24% to 26% by 2028, requires margin expansion from the 11% to 14% range that characterized the Novartis generics division in its final years. Reaching that target requires COGS reduction of approximately 8 to 10 percentage points, achievable only through the combination of supply chain optimization, manufacturing network consolidation, portfolio mix shift toward biosimilars, and organizational efficiency improvements.
The portfolio mix shift toward biosimilars is the highest-leverage lever. Sandoz is the world’s largest biosimilar company by number of approved products, with a portfolio spanning oncology, immunology, and other therapeutic areas. Biosimilar gross margins at launch, before the market fully commoditizes, run at 50% to 70% for first-wave biosimilars in lightly contested markets. Oral solid generic gross margins in fully commoditized multi-source markets can fall below 15%. Shifting revenue mix toward biosimilars is the fastest route to the EBITDA target, and it compounds the COGS optimization program’s impact.
Sandoz: IP Valuation Architecture
Sandoz’s IP position is different from Teva’s because the company’s moat is primarily manufacturing competence rather than first-to-file litigation history. Biosimilar development is fundamentally a manufacturing science exercise: the ability to characterize a reference biologic with sufficient analytical depth to reproduce its structural, functional, and immunological properties in a manufacturing process that is both FDA-approvable and economically viable. That manufacturing science capability is proprietary, developed over years of investment, and difficult to replicate.
The specific IP assets protecting Sandoz’s biosimilar advantage include process patents on the cell culture conditions, purification schemes, and formulation compositions developed for each biosimilar. These process patents do not prevent a competitor from developing a biosimilar to the same reference product, but they do require the competitor to develop different processes, adding development cost and timeline. The aggregate effect is to extend the period during which Sandoz operates in a lightly competitive biosimilar market after the first launch, before later-entering biosimilars with independently developed processes arrive.
Sandoz’s biosimilar portfolio also benefits from interchangeability designations under the Biologics Price Competition and Innovation Act (BPCIA). An interchangeable biosimilar, one approved with clinical data demonstrating that switching between the reference biologic and the biosimilar produces no clinically meaningful difference in safety or efficacy, can be substituted for the reference biologic at the pharmacy counter without prescriber intervention in most U.S. states. Interchangeability is the commercial gold standard for biosimilar formulary access, and it carries its own 12-month exclusivity period against other biosimilar interchangeability applications.
Investment read on Sandoz: The 2028 EBITDA margin target functions as a performance covenant. Missing it materially will pressure the stock and potentially trigger strategic reviews. Track quarterly EBITDA margin trajectory relative to the linear interpolation from current levels to 24%. Biosimilar launch execution on the 2025-2027 pipeline is the most important variable.
Sun Pharma: Scale-Driven Consolidation and API Backward Integration
Sun Pharmaceutical Industries built global scale through a sequence of acquisitions that includes Caraco Pharmaceutical (2012), DUSA Pharmaceuticals (2012), URL Pharma (2012), and the $4 billion acquisition of Ranbaxy Laboratories (2014). The Ranbaxy deal created the world’s fifth-largest generic company at the time and illustrated the risks of rapid consolidation: Ranbaxy carried an existing consent decree with FDA related to manufacturing quality problems at two Indian facilities, which imposed significant remediation costs on Sun Pharma post-acquisition and delayed ANDA approvals for the affected sites for several years.
Sun Pharma’s recovery from the Ranbaxy integration challenges produced a leaner, more disciplined manufacturing organization, and the company has since rebuilt its U.S. regulatory standing. Its current strategy combines its generics franchise with a growing specialty pharmaceutical business focused on dermatology and ophthalmology, following a model somewhat similar to Teva’s hybrid approach.
The backward integration into API manufacturing is a core cost competitiveness pillar. Sun Pharma manufactures APIs for a significant portion of its own product portfolio through dedicated API manufacturing sites. This integration provides cost competitiveness on the formulation side, supply chain security against Chinese API disruptions, and the timeline control necessary for aggressive Paragraph IV filings.
Sun Pharma: IP Valuation Architecture
Sun Pharma’s IP architecture operates on two tracks simultaneously. In the generics business, it mirrors the Paragraph IV strategy of all major generic filers: systematic first-to-file challenges on high-revenue branded drugs. Its U.S. ANDA pipeline, which includes several hundred applications at various stages of development and review, represents an option portfolio on future generic exclusivity and commodity market revenue.
The specialty business adds a layer of proprietary IP that is absent from pure-play generic companies. Ilumya (tildrakizumab), a biologic for moderate-to-severe plaque psoriasis, and Winlevi (clascoterone), a topical androgen receptor inhibitor for acne, both carry composition-of-matter patent protection extending into the late 2020s and 2030s. These products compete in branded specialty markets where pricing power exists independent of generic competition dynamics. The valuation of these assets follows a branded pharmaceutical DCF model, not a generic market-entry NPV model.
The API vertical integration creates IP value through the process patents described earlier: synthesis routes developed in-house that are both proprietary and more cost-efficient than alternatives. Sun Pharma files process patents on synthesis routes for APIs used in its key products as a standard practice, creating a secondary IP layer that complicates competitor ANDA development for the same molecules.
Investment read on Sun Pharma: The specialty/generics split in revenue is the key valuation question. Specialty products carry higher multiples than generic products because they have IP-protected pricing power. As the specialty segment grows as a percentage of revenue, the blended multiple should expand. Watch for specialty launch execution and whether the company builds pipeline depth in specialty biologics to replace the current small-molecule specialty portfolio as it ages toward patent cliff.
Key Takeaways: Section 8
Teva, Sandoz, and Sun Pharma represent three distinct competitive archetypes: the diversified hybrid (Teva), the pure-play optimizer (Sandoz), and the scale-driven consolidator (Sun Pharma). All three use cost leadership as the foundation of their generics strategy, but the IP architectures they have built differ significantly. Teva’s IP value is concentrated in Paragraph IV litigation history and biosimilar manufacturing know-how. Sandoz’s IP moat is manufacturing science and biosimilar interchangeability designations. Sun Pharma’s IP value combines generics Paragraph IV options with specialty product branded IP and API process patents.
9. Biosimilar Cost Optimization: A Completely Different Game
Why the Generic Drug Cost Playbook Fails for Biosimilars
The cost optimization strategies that drive profitability in the conventional generic drug business, shaving API price, reducing tablet-level scrap, compressing distribution margins, do not transfer directly to biosimilars. The development economics, manufacturing complexity, and regulatory requirements of biosimilars are categorically different.
A biosimilar development program costs $100 million to $250 million and takes seven to eight years from initiation to approval. This is an order of magnitude more expensive than a conventional ANDA and comparable in cost to a Phase II/III NDA. The fundamental reason is biological complexity. A monoclonal antibody biosimilar, for instance, is a protein of approximately 150,000 daltons produced in mammalian cell culture systems. It cannot be proven to be chemically identical to the reference biologic because no two mammalian cell culture processes produce exactly identical product when considering the full profile of post-translational modifications, glycosylation patterns, and higher-order structures. The regulatory standard is ‘highly similar’ with ‘no clinically meaningful differences,’ a demonstration that requires a stepwise series of analytical, functional, preclinical, and often large-scale comparative clinical studies.
The cost structure of biosimilar manufacturing is also fundamentally different from small-molecule generics. Cell culture-based manufacturing operates in large bioreactors (2,000 to 25,000 liter scale) with complex media formulations, critical process control requirements, and extensive downstream purification operations using chromatography, filtration, and viral clearance steps. The capital cost of a biosimilar manufacturing facility is $200 million to $500 million, compared to $20 million to $50 million for a typical oral solid manufacturing plant. The per-gram production cost of a monoclonal antibody from a well-optimized cell line at commercial scale runs $50 to $200 per gram; for a complex glycoprotein biologic, the cost can be higher.
The Biosimilar Cost Optimization Roadmap: Where the Leverage Actually Is
Given the development cost structure, the highest-leverage cost optimization in biosimilar programs is not reducing per-unit COGS after commercial launch. It is reducing the probability and cost of development program failure before commercial launch.
Cell line development and characterization is the foundation. A highly productive, genetically stable cell line that expresses the target protein at high specific productivity in a chemically defined medium reduces both the time and the cost of process development and scale-up. Cell line productivity has improved dramatically over the past 15 years through advances in expression vector design, gene amplification technology, and high-throughput screening methods. Leading biosimilar manufacturers are targeting cell lines expressing greater than 10 grams per liter in fed-batch processes at commercial scale, compared to 1 to 2 grams per liter that was state-of-the-art in the early 2000s.
Process development using QbD principles identifies the critical process parameters that govern the quality of the expressed protein, particularly glycosylation profiles and aggregation characteristics, and defines the design space within which those parameters can vary without producing clinically meaningful product differences. Defining that design space precisely, through structured DoE studies, reduces the risk that a manufacturing deviation during clinical supply production or commercial launch will produce a product that fails similarity assessment. A failed lot at commercial scale on a biosimilar program costs not just the direct manufacturing cost but potentially the comparative clinical data that was generated using a different lot.
Analytical method development for biosimilar similarity assessment is a distinct scientific competency that many companies underinvest in. The range of analytical techniques required to characterize a monoclonal antibody completely, from amino acid sequence confirmation through peptide mapping to glycan analysis to higher-order structure assessment by techniques including hydrogen-deuterium exchange mass spectrometry, is formidable. Companies that develop this analytical infrastructure early in the development process, rather than building it in response to an FDA request for additional characterization data, consistently achieve shorter development timelines and lower total program costs.
Interchangeability: The Commercial Gold Standard and Its IP Implications
FDA’s interchangeability designation requires demonstration through switching studies that patients can alternate between the reference biologic and the biosimilar without increased risk relative to using the reference biologic without switching. The clinical and regulatory burden of achieving this designation is substantial, but the commercial return justifies it.
An interchangeable biosimilar can be dispensed by a pharmacist without prescriber intervention in all states that have enacted biologics substitution legislation, which currently covers most of the U.S. market. Formulary access and pharmacy-level substitution drive biosimilar market share penetration faster and more completely than non-interchangeable biosimilars, which require active prescriber switching. In markets like insulins, where pharmacy substitution is routine, biosimilar penetration rates following interchangeability approval have exceeded 60% market share within 18 months.
The first biosimilar to achieve interchangeability for a given reference biologic earns 12 months of interchangeability exclusivity under the BPCIA. During this period, no other biosimilar can receive interchangeability approval for the same reference product. This 12-month window functions analogously to the 180-day exclusivity in the conventional generic market: it is a legally protected period of differentiated commercial access that commands a price premium over non-interchangeable biosimilars and supports superior gross margins. Companies with the clinical and regulatory infrastructure to pursue interchangeability designations systematically are building IP-equivalent competitive moats through the regulatory pathway.
Key Takeaways: Section 9
Biosimilar cost optimization focuses on de-risking development program expenditure rather than reducing per-unit COGS. Cell line productivity, process QbD design space definition, and analytical method sophistication are the three technical competencies that determine whether a biosimilar program achieves approval on schedule. Interchangeability designation, while expensive to pursue, creates a 12-month exclusivity window and superior formulary access that justifies the additional clinical investment. Companies evaluating biosimilar programs should model the probability of development program failure as the primary cost variable, not the post-launch manufacturing cost.
10. The Next Frontier: Digital Twins, Green API Chemistry, and the Complex Generics Shift
The Digital Twin: From Concept to Operational Reality
The digital twin concept in pharmaceutical manufacturing means creating a continuously updated virtual replica of a manufacturing process, fed by real-time sensor data from the physical production line, capable of simulating process perturbations and predicting product quality outcomes without conducting physical experiments.
Digital twins built on rigorous mechanistic models (first-principles models based on mass transfer, reaction kinetics, and thermodynamic relationships) rather than purely empirical models can generalize to conditions outside the historical data range. This generalization capability is critical for pharmaceutical applications, where a digital twin needs to predict the impact of a new API lot with slightly different particle size distribution on downstream blend uniformity and dissolution performance, even if that specific combination has never been observed in the historical dataset.
The practical deployment roadmap for a pharmaceutical digital twin runs through four stages. The first is sensor infrastructure: PAT instrumentation at all critical process steps, connected to a unified data historian. The second is model development: building process models, initially empirical (data-driven) and progressively enriched with mechanistic understanding, that accurately reproduce observed process behavior across the historical data range. The third is real-time integration: connecting the process model to the live sensor data stream so the digital twin runs in parallel with the physical process and flags deviations between predicted and actual behavior. The fourth is predictive deployment: using the digital twin to simulate the impact of proposed process changes (new raw material lot, modified process parameters, equipment substitution) before implementing them physically.
The regulatory opportunity here is substantial. FDA has published guidance on the use of digital twins and computational modeling in pharmaceutical manufacturing, explicitly encouraging their use as tools for demonstrating process understanding under the QbD framework. A company that can demonstrate to FDA that its digital twin accurately predicts product quality outcomes across the approved design space can potentially reduce the scope of confirmatory physical experiments required for post-approval changes, accelerating the approval of manufacturing improvements and reducing the experimental cost of process development.
The Sustainability Imperative: Real Cost Reduction, Not Just ESG Optics
The pharmaceutical industry faces a genuine environmental footprint challenge. Energy consumption in pharmaceutical manufacturing is high because GMP HVAC requirements impose continuous air handling at controlled temperatures and humidity, regardless of production activity. Water consumption is substantial in both synthesis and formulation operations. Solvent use, as noted earlier, can account for up to 85% of total materials consumed in API synthesis.
The financial case for sustainability investment in pharmaceutical manufacturing runs through three distinct channels. Direct operating cost reduction comes from lower energy bills, lower solvent procurement and disposal costs, and lower water treatment costs. McKinsey analysis of pharmaceutical API manufacturing suggests green chemistry implementation can reduce a manufacturer’s scope 1 and 2 emissions by approximately 30%, with corresponding cost reductions proportional to the share of energy and materials in total operating costs.
Regulatory cost reduction comes from lower hazardous waste disposal costs and reduced environmental compliance burden. Companies managing large volumes of chlorinated solvents, for example, face substantial ongoing costs for waste characterization, transportation, treatment, and regulatory reporting. Eliminating those solvents through green chemistry redesign removes the cost stream entirely.
Capital market cost of capital effects are increasingly observable. Institutional investors with ESG mandates apply sustainability screens that affect the cost and availability of debt and equity capital for pharmaceutical manufacturers. A company with a credible decarbonization roadmap, documented reductions in hazardous waste generation, and transparent scope 1/2/3 emissions reporting may access capital at a modestly lower cost than a peer without those commitments, particularly in the investment-grade bond market where ESG-labeled instruments carry a 2 to 5 basis point yield discount.
Complex Generics: The Next Competitive Frontier
The oral solid dosage form generic market for well-characterized small molecules is reaching saturation. There are currently over 20,000 approved ANDAs in the U.S., and approximately 1,000 new ANDAs are filed each year. The median number of generic manufacturers per generic drug product has grown substantially over the past decade, and price erosion in the commodity segment continues to compress margins to levels where only the most efficient manufacturers can generate adequate returns on capital.
The strategic response from leading generic companies is a deliberate migration up the complexity curve toward product categories with higher development barriers and more sustainable margins. These categories include long-acting injectable formulations, which require specialized manufacturing equipment and extensive bioequivalence study designs; inhaled drug products including dry powder inhalers and metered-dose inhalers, which require device compatibility demonstration and complex device-drug interaction characterization; transdermal drug delivery systems, where the polymeric matrix and adhesive chemistry create formulation complexity; and ophthalmic preparations, particularly ophthalmic suspensions and emulsions that require sterile manufacturing conditions and complex particle size characterization.
The development cost for a complex generic using one of these delivery technologies runs from $10 million to $50 million, compared to $2 million to $10 million for a standard oral solid. The regulatory pathway involves additional data requirements: device performance characterization for inhaled products, comparative pharmacokinetic and pharmacodynamic data demonstrating bioequivalence for complex delivery systems, and in some cases clinical endpoint studies where PK/PD approaches are insufficient. These barriers limit the number of companies that can participate in the market, sustaining price levels that more closely resemble specialty pharmaceuticals than commodity generics.
Key Takeaways: Section 10
Digital twins move pharmaceutical process optimization from reactive (analyze historical data) to predictive (simulate before manufacturing), reducing experimental cost and regulatory approval timelines for process changes. Green chemistry implementation addresses both environmental compliance costs and direct operating costs, with decarbonization savings of approximately 30% achievable through systematic application of green synthesis principles. Complex generics (long-acting injectables, inhalation products, transdermal systems) offer development barriers that sustain margins in the 30% to 50% gross margin range, compared to sub-15% for commodity oral solids, justifying the higher per-product development investment.
11. Master Key Takeaways and Investment Strategy
The Five Core Principles of Generic Drug Cost Leadership
Cost leadership in the generic drug market is not a single decision or a single program. It is a system of mutually reinforcing capabilities that compound over time. The companies that build these capabilities deliberately, as a strategic priority, develop cost positions that are genuinely durable.
The first principle is that product selection determines everything else. A superior patent intelligence capability, one that identifies first-to-file Paragraph IV opportunities with high litigation probability of success and favorable competitive field dynamics, generates more NPV than any operational efficiency program. The capital deployed in Paragraph IV development is small relative to the exclusivity earnings it can unlock. Getting the product selection right is the highest-leverage act of capital allocation.
The second principle is that API cost is not a fixed variable. The traditional approach to API cost management, negotiating price with qualified suppliers, captures a fraction of the available value. AI retrosynthesis can redesign the synthesis to reduce cost by 30%. Green chemistry and biocatalysis can eliminate solvent and waste costs that represent 20% to 30% of total API production operating costs. Vertical integration, when tied to a Paragraph IV strategy, aligns manufacturing timeline control with legal and commercial objectives in ways that price negotiation cannot replicate.
The third principle is that the factory floor’s hidden factory (COPQ) is a bigger opportunity than headline API costs in most organizations. A company with a 7% batch failure rate is destroying 7% of its COGS before a single tablet reaches a patient. Continuous manufacturing, PAT, AI process optimization, and Lean Six Sigma methodology address the sources of that waste systematically. The compound effect of reduced failure rate, lower investigation costs, shorter cycle times, and improved scheduling efficiency typically exceeds the savings achievable from API price negotiation.
The fourth principle is that quality investment is profitable. The COQ framework makes this quantitative: preventing a Class I recall that would cost $50 million in direct costs and trigger a Warning Letter that forecloses $200 million in ANDA approval opportunities is worth spending $5 million per year on enhanced quality systems. First-cycle ANDA approval rates translate directly to revenue timing, and in the Paragraph IV context, to hundreds of millions of dollars in exclusivity earnings.
The fifth principle is that the future of the generic market is complex, biological, and digital. Companies that continue investing only in oral solid manufacturing efficiency while the margin pool migrates to biosimilars, complex generics, and digital manufacturing capabilities will find themselves competing in an increasingly commoditized segment while better-capitalized competitors occupy the higher-margin adjacencies.
Comprehensive Investment Strategy for Analysts and Portfolio Managers
Evaluating generic drug company investments requires a framework that is specific to the industry’s economics, not a generic consumer products or specialty pharmaceutical framework.
For pure-play generic companies, the most predictive financial metrics are gross margin trajectory by dosage form segment, first-cycle ANDA approval rate, Paragraph IV pipeline by product and year of potential market entry, and the capital intensity of the manufacturing network relative to revenue. A company with declining gross margins in oral solids but an expanding complex generic and biosimilar pipeline is executing the right strategic pivot; the gross margin compression is a transitional cost of building the next margin tier.
For diversified pharma companies with large generic segments (Teva, Sun Pharma), the key question is whether the generics business generates sufficient cash to fund the specialty pipeline without diluting returns on the branded side. Teva’s $700 million savings program should be evaluated not just on cost reduction achieved but on whether the freed cash flow is being deployed productively in the Austedo, Ajovy, and Uzedy growth programs that represent the highest NPV uses of incremental capital.
The biosimilar pipeline is the most important forward-looking value driver for companies that have made the development investment. Track the filing and approval timelines for each biosimilar program. Model the interchangeability designation probability and timeline separately from initial biosimilar approval, because the interchangeability exclusivity premium is commercially material. Apply a probability-weighted NPV to the interchangeability exclusivity for each biosimilar in the pipeline.
Manufacturing technology investment, including CM adoption, PAT deployment, and AI integration, should be modeled as a medium-term gross margin improvement driver with a three-to-seven-year payback period. Companies reporting progress on these programs in investor presentations, with specific metrics (OEE by site, first-cycle approval rate year-over-year, batch failure rate trend), are demonstrating management quality that predicts superior long-run financial performance.
Patent intelligence infrastructure is a qualitative competitive moat that should be reflected in a modest P/E or EV/EBITDA premium relative to companies with less sophisticated IP monitoring and analysis capabilities. A company that has been consistently first-to-file on Paragraph IV challenges for five consecutive years is demonstrating a systematic capability, not just luck.
12. Frequently Asked Questions
How does biosimilar development cost structure change the return on investment calculus for a mid-size generic company with limited capital?
A $150 million biosimilar development program is a portfolio-level commitment for a company with $500 million in revenue. The IRR depends on three probability-weighted scenarios: full approval with interchangeability designation (highest NPV), approval without interchangeability (moderate NPV), and program failure (loss of development cost). A company with insufficient analytical infrastructure to conduct the reference biologic characterization studies to the FDA standard, or insufficient clinical operations capacity to run the Phase III comparative clinical trial, should license biosimilar development rights from a partner rather than self-develop. The licensing royalty paid to the originator of the development program is less expensive than a failed proprietary program.
What is the most common reason generic companies fail to achieve first-cycle ANDA approval, and what does remediation cost?
The most frequent CRL drivers are bioequivalence study design deficiencies (inadequate study power, incorrect reference standard, non-recommended fed/fasted conditions), CMC deficiencies in the drug product section (inadequate degradation product specifications, missing impurity identification data), and facility inspection observations at the proposed manufacturing site. Remediation costs depend on the deficiency type. A bioequivalence study failure requiring a new clinical study adds $800,000 to $2 million and 18 to 24 months to the development timeline. A CMC deficiency requiring additional stability data can take 12 to 18 months to address with a new stability time point. A 483 observation that triggers a complete response pending facility remediation can delay approval by one to three years. The prevention cost for each of these scenarios is small relative to the remediation cost.
How should a generic company structure its patent intelligence investment: internal team, external counsel, or specialized platform?
The optimal structure combines all three in a tiered model. A specialized patent intelligence platform (DrugPatentWatch is purpose-built for this use case) provides systematic monitoring of patent expirations, Orange Book listings, Paragraph IV filing activity, and litigation outcomes across the entire generic drug universe. This automation layer handles the screening function that would otherwise require a large team of analysts conducting manual patent research. An internal patent intelligence team of four to six analysts, trained in pharmaceutical IP and data analysis, uses the platform data to conduct deeper analyses of specific drug targets that pass the initial screening criteria. External patent litigation counsel is engaged at the point where a specific Paragraph IV challenge is under serious consideration, bringing the litigation experience and claim analysis capability that internal teams and commercial platforms cannot replicate. This tiered model combines systematic coverage with targeted deep analysis and specialized legal expertise at each stage of the decision process.
What is the realistic payback period on a Continuous Manufacturing investment for a generic drug company, and what product characteristics justify it?
The payback period for a CM investment is a function of product volume, price stability, and the degree of COGS reduction achieved. Products with annual production volumes above 500 million dosage units, price stability over a five-to-seven-year horizon (which correlates with high market share concentration and limited new generic entrant risk), and complex formulations that benefit disproportionately from continuous processing offer the strongest CM ROI. For these products, payback periods of five to eight years are achievable. For products with volatile demand, rapid price erosion, or low annual volume, the economics of CM are challenging and the investment in flexible batch manufacturing optimization is more prudent.
How should generic drug companies think about their carbon reduction obligations given the API supply chain’s geographic concentration in Asia?
The scope 3 emissions from outsourced API manufacturing in India and China represent the largest component of most generic drug companies’ greenhouse gas inventories, but they are also the most difficult to influence directly. The most effective near-term strategies operate on scope 1 and 2 emissions (facility energy use) through renewable energy procurement and energy efficiency programs, and on scope 3 emissions through supplier engagement programs that encourage API manufacturers to measure and reduce their own energy intensity and emissions. Companies requiring API suppliers to complete CDP questionnaires and meet minimum environmental performance standards as a condition of supplier qualification are creating commercial pressure for upstream decarbonization. Over a 10-year horizon, vertical integration into API manufacturing for key products also provides direct control over the manufacturing carbon footprint, which may become commercially valuable as scope 3 emissions measurement requirements tighten under emerging reporting standards globally.
This pillar page is intended for pharmaceutical IP teams, portfolio managers, R&D leads, and institutional investors. Data points reflect publicly available industry analyses, regulatory guidance, and company disclosures. Patent landscapes change continuously; all IP analysis should be verified against current Orange Book listings and USPTO records before any business decision.