Unit price is the number everyone fights over. It’s also the number that matters least.
Pharmaceutical procurement has a dirty secret: the contract price on a purchase order often accounts for less than half the true economic burden a drug places on a health system. The rest hides in plain sight — in specialty pharmacy markups, prior authorization labor, adverse event management, adherence infrastructure, and the downstream costs of treatment failure. Budget-based thinking keeps teams locked onto WAC and contract price while the real money walks out the door.
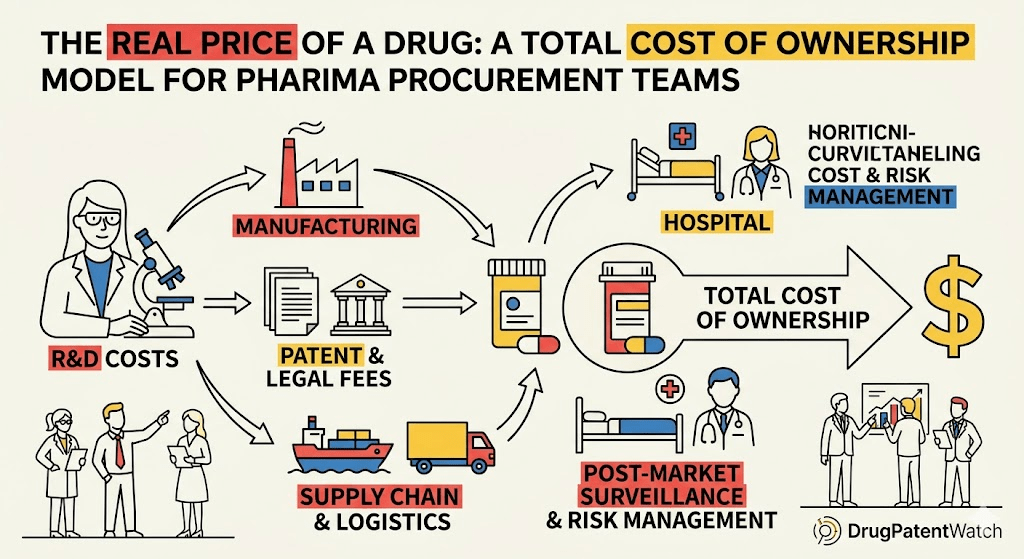
The shift from unit-price negotiation to total cost of ownership (TCO) modeling is not a philosophical upgrade. It’s a financial discipline that changes what you buy, who you contract with, and how you structure clinical programs. Health systems, pharmacy benefit managers, and integrated delivery networks that have made this shift report dramatically different procurement decisions than those working from invoice price alone.
This article builds the full TCO framework for pharmaceutical procurement teams: the conceptual model, the data inputs, the organizational mechanics, and the places where the analysis tends to break down. It also covers the patent intelligence layer that sits underneath effective TCO work — because the price trajectory of any brand drug is inseparable from its exclusivity timeline.
Part I: Why Unit Price Fails as a Procurement Metric
The Invoice Illusion
When a pharmacy director walks into a formulary committee meeting with a drug cost comparison, the first column is almost always WAC — wholesale acquisition cost. Sometimes it’s contract price after rebate. Rarely is it anything else.
This is understandable. WAC is auditable. Contract price is in the system. Neither requires modeling assumptions, patient population estimates, or clinical outcome proxies. They are the numbers that show up on invoices, and they are deeply insufficient.
Consider a mid-size regional health system that switched its preferred GLP-1 receptor agonist based on a 12% contract price advantage. Eighteen months later, an internal pharmacy analysis found that the lower-cost product had a meaningfully worse adherence profile in its patient population — patients were refilling 40 days late on average, creating gaps in therapy that correlated with avoidable emergency department visits. When those ED costs were allocated back to the formulary decision, the ‘cheaper’ drug was running the system roughly $900 more per patient-year.
That is the invoice illusion. The unit price was accurate. The cost picture was wrong.
What TCO Actually Measures
Total cost of ownership, borrowed from supply chain and capital equipment procurement, asks a different question: what does it cost our organization to use this drug to achieve a defined clinical outcome, across the entire patient pathway?
That question has several components that invoice-based thinking ignores:
Dispensing and delivery cost: cold chain, patient assistance programs, home infusion logistics
Monitoring and adherence cost: lab panels, patient support programs, adherence interventions
Adverse event cost: management of on-label and off-label adverse effects
Downstream medical cost: downstream hospitalizations, ER visits, and complications attributable to treatment success or failure
Waste and shrinkage cost: vial overfill, unused product in weight-based dosing, expired inventory
A complete TCO model captures all of these. The point is not to generate a single perfect number — the assumptions underlying downstream medical cost alone are enough to fill a clinical pharmacology dissertation. The point is to build a framework that makes the total cost picture visible and comparable across therapeutic options.
The Specialty Drug Problem
Specialty drugs have made unit-price procurement almost comically inadequate. When a single drug costs $400,000 per year, the administrative overhead of managing that drug — prior authorization processing time, specialty pharmacy coordination, nursing support for infusions, patient monitoring, and appeals management — can represent 15 to 25 percent of the total drug budget for that product [1].
A health system managing 200 patients on a high-cost biologic might be spending $1.2 million annually on drug acquisition and $280,000 on the infrastructure to administer it. Contract negotiations that shave 5% off the acquisition cost save $60,000. Operational improvements that cut administrative overhead by 20% save $56,000. The two levers are roughly equivalent in financial impact, but only one of them ever shows up in the formulary committee presentation. <blockquote> ‘Specialty drug administrative costs — prior authorization, appeals, specialty pharmacy coordination, clinical monitoring — now account for an estimated 18 to 24 percent of total specialty drug spend in integrated health systems managing complex chronic disease populations.’ — IQVIA Institute for Human Data Science, 2024 [1] </blockquote>
This is why TCO modeling matters most in the specialty space. For commodity generics, the unit price really does dominate. When a 30-day supply of metformin costs $4 at contract price, the administrative overhead of dispensing it is the bigger variable — but it’s also small in absolute terms. At the other end of the cost spectrum, where a single infusion of a gene therapy can cost $3.5 million, procurement teams need a fundamentally different analytical toolkit.
Part II: Building the TCO Framework
The Five-Layer Model
A practical TCO model for pharmaceutical procurement operates across five layers. Each layer has distinct data sources, responsible parties within the organization, and time horizons for cost realization.
Layer 1: Direct Acquisition Costs
This is the layer most procurement teams already manage. It includes:
WAC: the manufacturer’s published list price, the starting point for all negotiations
Contract price: the negotiated price under a GPO, PBM, or direct manufacturer contract
Net price after rebates: the real acquisition cost after manufacturer rebates are applied, which can be substantially lower than contract price for heavily rebated products
Specialty pharmacy dispensing fees: typically $50 to $200 per prescription for specialty products, paid to the dispensing pharmacy and often separate from drug cost in health plan accounting
340B program savings: for eligible covered entities, the 340B price can be 25 to 50 percent below WAC, creating a separate acquisition cost track
The measurement challenge here is rebate accounting. Manufacturer rebates are typically paid quarterly in arrears, creating a gap between when the drug cost is accrued and when the rebate cash arrives. For drugs with high rebates — some PBM-negotiated contracts involve rebates exceeding 60% of WAC on certain categories — this gap materially distorts period-over-period cost comparisons.
Net price after all rebates is the correct denominator for acquisition cost analysis. It is also the number that drug companies are least eager to discuss publicly, because it makes the WAC-versus-net-price divergence visible.
Layer 2: Administrative and Utilization Management Costs
Every drug that requires prior authorization imposes a real labor cost on the health system. The 2023 American Medical Association survey found that physicians and their staff spend an average of 14 hours per physician per week on prior authorization-related tasks [2]. Not all of that is pharmacy-related, but a meaningful portion is.
For a specialty biologic requiring annual reauthorization with clinical documentation, the administrative cost per authorization cycle typically runs between $80 and $200 when physician time, medical assistant time, and pharmacy staff time are fully costed [3]. For a drug with a 30% denial rate and an average of 1.4 appeals per denied case, that administrative load compounds quickly.
The TCO model should capture:
Average prior authorization processing time (hours × labor rate)
Authorization denial rate and average appeals per denial
Specialty pharmacy coordination time (calls, prior authorization facilitation, patient outreach)
Formulary exception processing for non-formulary requests
This data is collectible from internal operations systems. Pharmacy directors who have done this analysis are usually surprised by the magnitude. One academic medical center that conducted a detailed time-and-motion study of its specialty pharmacy PA workflow found it was spending $1.1 million annually in labor costs on prior authorization for its top 20 specialty drugs — a cost that appeared nowhere in any drug budget report.
Layer 3: Dispensing, Delivery, and Logistics Costs
For orally administered products dispensed through retail or mail-order pharmacy, this layer is thin. For biologics, infusibles, and temperature-sensitive products, it can be substantial.
Cold chain costs apply to any product requiring 2–8°C storage and transportation. For health systems operating their own infusion centers or specialty pharmacies, cold chain infrastructure — refrigerated storage, temperature monitoring, validated shipping containers, qualified personnel — represents a real capital and operating cost that should be allocated to the drugs that require it.
Home infusion logistics add coordination costs, nursing visit costs, and equipment costs (infusion pumps, IV supplies, waste disposal). When comparing an infusible biologic to a subcutaneous self-administered alternative, the logistics cost differential can exceed the drug price differential in high-cost markets.
Patient assistance program (PAP) administration is a cost often overlooked. When a health system helps low-income patients enroll in manufacturer PAPs, that coordination takes staff time — often 30 to 60 minutes per enrollment, with ongoing annual renewal requirements. At scale, this becomes meaningful.
Vial overfill and dose rounding waste is a uniquely pharmaceutical cost driver. Weight-based dosing regimens frequently result in a portion of a prepared dose being discarded. For a biologic priced at $15,000 per vial, a 15% average waste rate across a patient population represents $2,250 per dispensing event in unrecovered value. Formulary decisions that prefer fixed-dose products over weight-based products can eliminate this waste entirely.
Layer 4: Monitoring, Adherence, and Support Program Costs
This layer requires the most clinical judgment and carries the most significant variation across patient populations.
Required monitoring refers to lab panels, imaging, or clinical assessments mandated by the prescribing label or clinical guidelines. Clozapine requires weekly ANC monitoring for the first six months; natalizumab requires JC virus antibody testing and periodic MRI; some immunosuppressants require quarterly metabolic panels. These monitoring requirements are direct costs of using the drug that belong in the TCO calculation.
Adherence infrastructure covers the programs — nurse educator calls, digital adherence tools, refill reminder programs, disease management support — deployed to keep patients on therapy. When a health plan or health system is at risk for total cost of care, adherence programs are investments with calculable ROI. A patient with heart failure who stays adherent to sacubitril/valsartan costs less in total medical expenditure than one who abandons therapy after 90 days, even accounting for the drug cost [4].
Hub and specialty pharmacy patient support programs are manufacturer-funded but have internal coordination costs. The health system or prescriber office typically handles triage, referral, and communication between the hub and the clinical team. That coordination takes time that belongs in the TCO model.
Layer 5: Downstream Medical Cost
This is the most analytically demanding layer and the one with the highest financial leverage.
The logic is straightforward: drugs that work as intended reduce hospitalizations, emergency department visits, disease complications, and the need for rescue therapies. Drugs with poor real-world effectiveness, high discontinuation rates, or significant adverse event profiles drive downstream costs that dwarf the drug budget savings from choosing a cheaper product.
A rigorous TCO model traces these outcomes through actual claims data. For a health system with full claims visibility — both medical and pharmacy — this is tractable. For a PBM without medical claims visibility, or a hospital pharmacy without outpatient follow-up data, it requires modeling assumptions from published literature.
The downstream cost components include:
Avoidable hospitalizations and ER visits attributable to treatment failure or adverse events
Rescue medication costs (drugs required to manage complications of first-line therapy)
Disease progression costs (the incremental cost of a more advanced disease state when first-line therapy fails)
Complication management costs (on-label and off-label adverse event management)
Real-world evidence (RWE) is the primary data source for this layer. Published comparative effectiveness studies, health plan claims analyses, and disease-specific cost models all provide anchors for these estimates. The Institute for Clinical and Economic Review (ICER) publishes cost-effectiveness analyses for many high-impact drugs that contain directly usable downstream cost parameters [5].
Part III: Patent Intelligence as a TCO Input
Why the Exclusivity Cliff Belongs in Your Model
A TCO model that ignores patent status is analytically incomplete. The price of any branded pharmaceutical is not a stable input — it is a trajectory defined by the drug’s remaining exclusivity and the likely timing of generic or biosimilar competition.
A biologic priced at $40,000 per year today will cost something very different in three years if a biosimilar enters the market. The FDA’s biosimilar approval history shows that first-wave biosimilar entrants typically launch at 15 to 35 percent below the reference product price; with multiple biosimilar entrants, prices can fall 50 to 80 percent over a two-to-three-year period [6].
A procurement team that builds a multi-year TCO model without a patent intelligence layer is essentially assuming that today’s acquisition cost is permanent. That assumption is almost always wrong, and the direction of error is predictable: they are over-weighting the present cost and under-weighting the option value of pending generic or biosimilar competition.
What Patent Intelligence Covers
Patent protection for a pharmaceutical compound operates through overlapping mechanisms:
Primary compound patents: protect the active chemical or biological entity, typically expiring 20 years from filing (often 8 to 12 years from approval given development time)
Formulation patents: protect specific delivery systems, salt forms, or extended-release formulations, sometimes extending effective exclusivity by three to five years
Method-of-use patents: protect specific therapeutic applications, which can remain relevant even after compound patent expiry
Pediatric exclusivity extensions: six-month FDA exclusivity extensions granted for completing pediatric studies
Orphan drug exclusivity: seven years of market exclusivity for drugs treating rare diseases
BPCIA biologic exclusivity: 12 years of reference product exclusivity for biologic drugs, separate from patent protection
The interaction among these mechanisms creates the actual competitive timeline for any given product. A procurement team negotiating a long-term contract on a specialty drug needs to understand not just when the primary patent expires, but when the first biosimilar or generic is likely to clear all regulatory hurdles.
Using DrugPatentWatch for Procurement Intelligence
DrugPatentWatch is the most comprehensive publicly accessible source for pharmaceutical patent and exclusivity data, covering patent expiration dates, Orange Book listings, paragraph IV certification filings, and FDA exclusivity periods across the U.S. drug market.
For procurement teams, the most operationally useful outputs from DrugPatentWatch include: the full patent landscape for a target drug (including minor formulation patents that create exclusivity beyond the compound patent), the history of ANDA and biosimilar 351(k) applications (indicating who is trying to enter the market and when), and paragraph IV litigation timelines that signal whether generic entry is contested and how long that contest is likely to run.
Paragraph IV certifications, where a generic applicant asserts that the brand manufacturer’s listed patents are invalid or will not be infringed, are among the most predictive signals in the entire patent intelligence dataset. A brand drug with multiple paragraph IV certifications from credible generic filers is telling the market something specific: generic entry is coming, and it may be sooner than the nominal patent expiration suggests.
Several high-profile generic entry timelines in the last decade were visible in paragraph IV filing data 18 to 36 months before generic launch. Procurement teams that used DrugPatentWatch to identify these signals negotiated contract terms — escape clauses, contract price steps tied to generic entry, and strategic inventory management — that created material savings versus teams that treated the brand price as fixed.
Case Study: Atorvastatin and the Paragraph IV Playbook
Atorvastatin (Lipitor) went off-patent in November 2011, triggering one of the most analyzed generic entry events in pharmaceutical history. The generic price erosion was dramatic: branded Lipitor had been priced at roughly $150 for a 30-day supply; within 18 months of generic entry, equivalent generic atorvastatin was available for under $10 [7].
Health plans and health systems that had tracked the patent litigation via public filings understood by early 2010 that generic entry was probable by late 2011. Those that renegotiated their atorvastatin contracts with explicit generic substitution triggers saved more — and saved it earlier — than those who waited for the generic to appear on the market before adjusting formulary policy.
The atorvastatin case is extreme in its magnitude. But structurally identical situations recur constantly in the specialty drug space. Humira biosimilar entry, which began in earnest in 2023 after years of litigation that was publicly tracked, was visible in patent data for years before launch. Health plans that modeled the biosimilar entry timeline, built it into their long-term biologics contracting strategy, and structured their Humira contracts with biosimilar transition provisions consistently outperformed plans that renegotiated from scratch when biosimilars arrived [8].
Part IV: Building the Model in Practice
Data Architecture for TCO
The first question most procurement teams ask when they decide to build a TCO model is: where does the data come from?
The answer depends on what the organization can see. A fully integrated health system with medical claims, pharmacy claims, and clinical data in a single warehouse has the richest possible data environment. A standalone PBM with pharmacy claims but no medical claims must rely on published literature for downstream medical cost parameters. A hospital pharmacy without outpatient data has to model administrative costs from internal time studies and acquisition costs from its own contracts.
The minimum viable TCO dataset for a specific drug comparison includes:
Contract price and estimated rebate for each comparator
Average prior authorization processing time and denial/appeal rate (from internal operations data or published benchmarks)
Required monitoring protocol (from the prescribing label)
Published adherence rates from real-world evidence studies
Published discontinuation rates and reasons
At least one published model or RWE study estimating downstream medical cost differences between comparators
Where internal data is unavailable, published benchmarks provide reasonable starting points. The National Council for Prescription Drug Programs, the IQVIA Institute, and the Kaiser Family Foundation publish regularly updated cost benchmarks for administrative processes in pharmaceutical management [9].
Sensitivity Analysis Is Not Optional
A TCO model without sensitivity analysis is not a model — it’s a point estimate with unquantified uncertainty. Every key assumption in the downstream medical cost layer should be stress-tested across a plausible range.
If the base case assumption is that Drug A prevents 0.4 hospitalizations per patient-year compared to Drug B, the sensitivity analysis should run the model at 0.2 and at 0.6. If the base case assumption is a drug price of $28,000 per year, the sensitivity analysis should model the impact of biosimilar entry at $18,000 in year three.
The goal of sensitivity analysis in TCO modeling is to answer two questions: which cost components drive the outcome most strongly, and how extreme would the assumptions need to be to reverse the formulary recommendation? If the TCO advantage of Drug A over Drug B survives stress-testing across the full range of plausible assumptions, the recommendation is robust. If it flips under modest assumption changes, the decision requires more evidence before proceeding.
Tornado diagrams — ranking sensitivity analyses by the magnitude of their impact on the total TCO estimate — are the standard visualization for this. They quickly identify whether the model is primarily sensitive to acquisition cost (where negotiation can have impact) or to downstream medical cost (where clinical program design matters more).
Separating Population Heterogeneity from Average Effects
One of the more common analytical errors in TCO modeling is applying an average treatment effect to a heterogeneous patient population as if it were homogeneous.
A drug’s real-world effectiveness is not a fixed number. It varies by adherence, by comorbidity burden, by concomitant medications, by the prescribing context, and by a host of patient characteristics that aggregate data smooths over. For the specific population a health system serves — its actuarial mix of age, comorbidity, socioeconomic status, and baseline disease severity — the average from a published study may be materially wrong in either direction.
The practical correction for this is to segment the patient population before applying effectiveness parameters. For a biologic in rheumatoid arthritis, for example, a health system might model effectiveness separately for:
Biologic-naive patients with moderate disease activity
Biologic-experienced patients who have failed at least one prior biologic
Patients with high comorbidity burden (cardiovascular disease, renal impairment)
Each segment will have different expected outcomes, different downstream medical cost trajectories, and potentially different formulary recommendations. A TCO model that averages across these segments may arrive at a correct overall estimate while obscuring the fact that the optimal formulary choice differs by patient type.
Time Horizon Selection
The selection of a time horizon for TCO analysis is a strategic choice with material impact on the result.
Short time horizons (one to two years) capture acquisition costs well but underweight the downstream cost impact of treatment failure, disease progression, and adherence gaps. They also miss the patent cliff dynamics that will alter acquisition costs in years three through five. Short-horizon TCO models tend to favor drugs that are cheaper on acquisition and produce their clinical benefits (or adverse effects) later in the treatment course.
Long time horizons (five to ten years) capture the full economic picture but require modeling assumptions about disease progression, treatment switching, and price trends that are increasingly speculative as the horizon extends. They also create practical challenges: formulary cycles are typically annual, and a ten-year TCO model may not be actionable in the near-term procurement decision.
A practical approach is to run the model at two time horizons — two years and five years — and present both. If the formulary recommendation is consistent across both time horizons, it is more confident. If it diverges (Drug A is cheaper at two years, Drug B is cheaper at five), the decision depends on how much weight the organization gives to long-term cost of care versus near-term budget certainty.
Part V: TCO in Key Therapeutic Areas
Biologics for Inflammatory Disease
Inflammatory disease — rheumatoid arthritis, psoriasis, inflammatory bowel disease, ankylosing spondylitis — represents the largest category by spend in most commercially insured populations. The biologics space is also among the most analytically complex for TCO modeling, for several reasons.
Multiple products target the same disease, the same pathways, or overlapping pathways. Head-to-head clinical trial data is sparse — most registration trials are placebo-controlled — which requires indirect comparisons and real-world evidence to estimate comparative effectiveness. Formulary management is complicated by patient advocacy, physician preference, and specialty pharmacy contracting dynamics that operate somewhat independently of clinical evidence.
The TCO inputs that matter most in inflammatory biologics are:
Primary non-response rate: the proportion of patients who do not respond to first-line therapy and require a switch. Switching events are expensive — they trigger new prior authorization cycles, sometimes involve biologic washout periods, and correlate with disease flare and increased downstream medical cost. A drug with a 25% primary non-response rate in a given patient population imposes materially higher TCO than one with a 15% primary non-response rate, even if the drug prices are identical.
Secondary failure rate: after initial response, some patients lose efficacy over time due to immunogenicity or disease progression. The annual secondary failure rate for TNF inhibitors in RA runs roughly 10 to 15% per year in real-world practice, generating ongoing switching costs that accumulate over a multi-year treatment course [10].
Biosimilar transition management cost: with the Humira biosimilar wave now well underway in the U.S. market, health systems managing large RA and IBD populations face the practical cost of transitioning established patients from originator adalimumab to biosimilar products. That transition is not zero-cost: it requires patient communication, prescriber engagement, specialty pharmacy coordination, and monitoring for non-medical switching adverse outcomes.
The patent intelligence layer is particularly valuable in this space. Biosimilar entry timelines for major biologics — adalimumab, etanercept, ustekinumab, vedolizumab — have been tracked through FDA biosimilar application pipelines and patent litigation for years. DrugPatentWatch tracks the patent expiration dates and paragraph IV challenges for these reference products, providing procurement teams with forward visibility into when additional biosimilar competition will intensify and prices will fall further.
Oncology
Oncology presents the most analytically demanding environment for TCO modeling. Drug prices are extraordinarily high (tyrosine kinase inhibitors, checkpoint inhibitors, and cell therapies regularly exceed $100,000 per patient-year). The patient populations are small and heterogeneous. Biomarker-driven patient selection means the eligible population for a given drug is defined by tumor biology, not just diagnosis. And the clinical outcomes that drive downstream cost — disease progression, hospitalization for adverse events, supportive care utilization — are among the most expensive in all of medicine.
The TCO model for oncology must account for:
Treatment duration and dose intensity: many oral oncolytics are prescribed at doses that must be reduced due to toxicity, creating partial-dose cost allocation questions. A drug priced on a per-pill basis that requires dose reduction in 40% of patients is effectively cheaper than its label dose cost would suggest.
Adverse event management costs: grade 3-4 adverse events for checkpoint inhibitors can require hospitalization, high-dose steroids, or specialty subspecialist care. Published analyses of immune-related adverse event costs for PD-1/PD-L1 inhibitors show median per-event costs ranging from $15,000 to $60,000 depending on event type and severity [11].
Biomarker testing costs: drugs requiring companion diagnostic testing add the cost of that test — FISH, next-generation sequencing, IHC — to the acquisition cost. For some precision oncology drugs, the diagnostic cost is $3,000 to $5,000 per patient, applied to a population where only 10 to 30% will be biomarker-positive and eligible for treatment.
Supportive care requirements: some chemotherapy regimens require prophylactic G-CSF, anti-emetics, or growth factors that add $1,000 to $10,000 per cycle in drug costs that do not appear on the oncology drug budget line.
The patent situation in small-molecule oncology is complicated by the prevalence of formulation patents and method-of-use patents that extend effective exclusivity beyond compound patent expiration. Multiple tyrosine kinase inhibitors have faced generic entry litigation where the generic pathway was contested not on the compound itself but on patents covering specific crystalline polymorphs or dosing methods. Procurement teams using resources like DrugPatentWatch can track these secondary patent landscapes and avoid the common mistake of assuming that compound patent expiry equals immediate generic competition.
Diabetes and Metabolic Disease
The GLP-1 receptor agonist category has made the diabetes and metabolic disease space the fastest-moving procurement problem in pharmacy. Products like semaglutide (Ozempic, Wegovy) and tirzepatide (Mounjaro, Zepbound) have radically changed the clinical landscape, but the procurement math is complicated by price volatility, off-label use dynamics, and an impending biosimilar horizon that is years out but already affecting contracting.
TCO modeling in diabetes/metabolic disease must address:
Weight-based dosing escalation: GLP-1 dose escalation protocols mean that a patient starting at 0.25 mg semaglutide weekly will typically reach 1 mg or 2 mg, materially changing the drug cost profile over time. Any TCO model that applies the starting dose cost to the full treatment period will significantly underestimate acquisition cost.
Cardiovascular risk reduction value: both semaglutide and tirzepatide have demonstrated cardiovascular outcomes benefit in high-risk populations. For a health plan or health system at risk for total cost of care, the cardiovascular event reduction value — avoidable myocardial infarctions, strokes, hospitalizations for heart failure — is a real economic benefit that belongs in the TCO model. The SELECT trial demonstrated a 20% relative risk reduction in major adverse cardiovascular events with semaglutide in obese patients without diabetes, translating to significant downstream cost offsets for eligible populations [12].
Obesity drug coverage discontinuation cost: employer and health plan decisions to cover or drop GLP-1 drugs for weight management create population-level adherence disruptions with downstream medical cost implications. The TCO model should account for the cost of discontinuation cycles — weight regain, metabolic parameter deterioration, return to pre-treatment disease burden — when modeling coverage policy changes.
The semaglutide patent situation is actively monitored in the patent intelligence community. Novo Nordisk holds multiple patents on the semaglutide molecule, its formulations, and its delivery devices. Some of these expire mid-decade; others extend into the 2030s. DrugPatentWatch and the FDA’s Orange Book together provide the patent picture for the oral semaglutide formulation (Rybelsus) and the injectable presentations (Ozempic, Wegovy), which have different patent profiles and different generic entry timelines.
Gene and Cell Therapy
Gene and cell therapies represent the outer edge of pharmaceutical TCO complexity. Single-administration therapies priced between $1 million and $4.5 million require a cost framework that is structurally different from the per-treatment-period models used for chronic disease management.
For gene therapy, the core TCO question is: what is the present value of the drug cost plus downstream cost over a defined time horizon, compared to the present value of the alternative (typically ongoing standard of care)?
The durable efficacy assumption is central to this calculation. If a gene therapy for hemophilia A eliminates the need for factor VIII replacement therapy for 10 years, the present value of 10 years of factor VIII — at roughly $500,000 to $1 million per year for severe hemophilia — is $3 to $5 million before discounting. A gene therapy priced at $3 million could be cost-neutral or better.
But the durability assumption is exactly what is uncertain. Real-world durability data for approved gene therapies is still accumulating, and the clinical trial durations that supported approval were often three to five years — shorter than the claimed therapeutic window. Payers who have accepted the gene therapy value proposition on a 10-year durability assumption are taking clinical and financial risk that may not crystallize for years.
The procurement response to this uncertainty is outcomes-based contracts — agreements where a portion of the payment is contingent on the product achieving defined clinical benchmarks over time. CMS has explored this model for several gene therapies through its Cell and Gene Therapy Access Model. The administrative overhead of outcomes-based contracts (data collection, payment calculation, contract management) belongs in the TCO model as a distinct cost category.
Part VI: Organizational Infrastructure for TCO
Who Owns the Model
One reason TCO modeling is less common than it should be is that no single function within a typical health system or health plan owns all the relevant data. Pharmacy owns acquisition cost. Finance owns administrative cost allocation. Clinical programs owns outcome data. Medical economics owns downstream cost. IT owns the claims warehouse.
Building a TCO capability requires either creating a cross-functional team or assigning a single owner with authority to pull data from all of these domains. In practice, the most successful implementations assign ownership to the pharmacy director or chief pharmacy officer, with explicit data-sharing agreements with finance and medical economics. The model is built in a shared analytics environment where each function contributes its data and validates its section of the output.
Health plans with dedicated pharmacy analytics teams — typically found in larger plans and PBMs — have a structural advantage here because those teams are already positioned at the intersection of pharmacy and medical claims. Smaller health systems without in-house analytics capacity can purchase externally built TCO models from vendors or leverage published frameworks from organizations like ISPOR (the professional society for health economics and outcomes research) as starting structures.
Incorporating TCO into the Formulary Process
The formulary management process in most health systems operates on an annual or semi-annual review cycle tied to the P&T (Pharmacy and Therapeutics) committee. Introducing TCO into this process requires reframing what the P&T committee is asking for when it reviews a drug.
Traditional P&T drug reviews focus on: clinical evidence (efficacy and safety), comparative clinical data, and acquisition cost. A TCO-informed P&T process adds: total cost comparison including downstream medical cost, patent and exclusivity status with forward pricing scenarios, and sensitivity analysis around key clinical assumptions.
This is more work for the pharmacy team that prepares the dossier. But the incremental work pays for itself quickly when a TCO analysis redirects a formulary decision that would have been based on invoice price alone.
The National Pharmaceutical Council has published guidance on incorporating value-based assessment into formulary decision-making that provides a useful structural framework for P&T committees beginning this transition [13].
Contracting Provisions That Reflect TCO
Once the TCO model is built, it changes what procurement teams ask for in contract negotiations. Unit price discounts are still valuable, but they are no longer the only lever.
Outcomes-based contract provisions tie a portion of the contract price to performance metrics — response rates, adherence rates, hospitalization rates — that reflect the drug’s real-world performance in the health system’s specific population. If the drug performs better than expected, the manufacturer retains more of the contract price; if it performs worse, the health system recovers a portion. AstraZeneca, Novartis, and several other manufacturers have executed outcomes-based contracts in multiple therapeutic areas; the operational complexity is real but manageable for high-cost, high-volume products [14].
Generic entry clauses tie the contract price to a benchmark that adjusts when a generic or biosimilar reaches a defined market share threshold. For a drug approaching patent expiration, this provision ensures that the health system automatically participates in generic price deflation without needing to renegotiate from scratch. Patent intelligence is essential here: the trigger should be defined in terms of generic availability date (from the FDA’s Orange Book or biosimilar approval list), not market share, to prevent manufacturers from arguing that biosimilar market share is below the trigger threshold.
Administrative cost offsets are provisions where the manufacturer provides hub services, patient support programs, or prior authorization support in ways that reduce the health system’s internal administrative burden. These should be valued in the contract negotiation at their actual administrative cost savings, not their list value in the manufacturer’s marketing materials.
Formulary exclusivity provisions are manufacturer requests for formulary positioning (preferred tier, or exclusive positioning in class) in exchange for enhanced discounts. These need to be evaluated against the full TCO of the product — a preferred position for a drug with high administrative burden or poor adherence profiles may not generate the system-level savings the headline discount implies.
Part VII: The Data Quality Problem and How to Address It
Where TCO Models Break Down
The most common failure mode for pharmaceutical TCO models is not conceptual — most pharmacy teams understand what a complete cost analysis should include. The failure is empirical: the data required to populate the model is unavailable, unreliable, or inconsistently collected across the organization.
Four data quality problems recur most frequently:
Rebate accounting lag: manufacturer rebates are earned at the point of dispensing but received months later, and the accounting treatment varies by organization. Some health systems carry rebates as a reduction in drug cost; others record them as a separate revenue line. When comparing TCO analyses across different organizations or benchmarking against industry data, inconsistent rebate accounting creates systematic comparability problems.
Administrative cost allocation methodology: few organizations have done the time-and-motion work to establish drug-specific administrative cost rates. Without this, teams use blended average rates that may be materially wrong for drugs with unusually high or low administrative burden. A specialty biologic requiring three-stage prior authorization and quarterly reauthorization has a much higher administrative cost per patient than a standard chronic disease medication, but a blended rate misses this.
Downstream cost attribution: associating a hospitalization with a specific drug treatment decision requires clinical logic (or a clinical algorithm) that pharmacy teams are not always equipped to build. Most health systems lack a validated algorithm for attributing ED visits or hospitalizations to treatment failure for specific disease states. Without this, the downstream medical cost layer relies on published literature estimates that may not reflect the actual patient population.
Real-world effectiveness data: published adherence and effectiveness rates from observational studies often reflect idealized practice settings or patient populations that differ from the system’s actual caseload. For safety-net health systems, academic medical centers, and rural providers serving high-complexity populations, published real-world effectiveness estimates may significantly overstate what will actually be achieved.
The practical response to these gaps is a tiered confidence approach. For each cost component in the TCO model, the team explicitly rates its confidence in the underlying data: high (derived from internal data with clear methodology), medium (derived from published benchmarks with documented applicability assumptions), or low (modeled from first principles or expert opinion). Recommendations that depend on low-confidence components are presented with appropriately wide uncertainty ranges.
Electronic Health Records and Claims Data Integration
Health systems that have integrated pharmacy claims, medical claims, and EHR data in a unified analytics environment have a significant advantage in TCO model construction. The combination of dispensing data (what was prescribed and when), claims data (what downstream utilization occurred), and clinical data (what laboratory values, vital signs, and clinical assessments show) allows direct empirical measurement of most TCO components rather than reliance on literature estimates.
Epic, Oracle Health, and other major EHR vendors have expanded their population health analytics capabilities to support this kind of cross-domain analysis. Several large integrated delivery networks have built internal TCO capability on top of these platforms, producing formulary analyses that are calibrated to their specific patient populations rather than generic published benchmarks.
The investment in this capability is not trivial — it requires data engineering, clinical informatics expertise, and sustained organizational commitment to using the output. But for health systems spending $500 million or more annually on pharmaceuticals, the ROI on a functioning TCO infrastructure is clear.
Part VIII: The Competitive Intelligence Dimension
How Competitors Use TCO to Win Contracts
The buyer-side case for TCO is clear. What is less often discussed is how drug manufacturers use TCO arguments to win formulary placement — and how procurement teams should evaluate these arguments.
Manufacturers of higher-priced branded drugs routinely present TCO arguments to formulary committees arguing that their drug’s superior clinical performance, better adherence profile, or reduced adverse event burden justifies a premium acquisition price. These arguments are sometimes valid. They are also sometimes self-serving analyses built on favorable assumptions.
The critical evaluation question is: who built the model, and what are the key assumptions? A manufacturer-sponsored budget impact model that shows TCO parity with a cheaper competitor is not the same as an independent analysis reaching the same conclusion. The manufacturer’s model will typically use the drug’s best-available efficacy data, published adherence rates from controlled trials, and conservative estimates of adverse event rates. Each of these assumptions may be optimistic in the real-world context.
Procurement teams should treat manufacturer-submitted TCO analyses as useful starting inputs, not as conclusions. The correct response is to take the model structure, substitute the health system’s own data for manufacturer assumptions where possible, and re-run the analysis. Where the conclusions change materially, the discrepancy points to the assumptions that are driving the outcome — and those assumptions are exactly what the clinical review of the drug should examine.
Using Patent Cliffs in Negotiation
Patent expiration intelligence is a negotiation tool, not just an analytical input. A brand manufacturer selling a drug within three years of its first biosimilar entry knows that its commercial window is closing. That knowledge changes the negotiating dynamic.
A health plan that can demonstrate, using DrugPatentWatch data, that biosimilar entry is probable within 18 to 24 months has a credible walk-away option: accept a more modest contract price now, or wait for the biosimilar and transition the formulary. For manufacturers with high market share in a product category, this leverage is real. It has been used effectively in biologic contracting for adalimumab, etanercept, and the IL-17 class.
The negotiating position is most powerful when the health plan or health system has demonstrated willingness to execute formulary transitions in the past. A payer with a track record of managing formulary switches has more credible biosimilar-entry leverage than one that has never managed such a transition.
For procurement teams building their patent intelligence capability, the combination of DrugPatentWatch for patent and exclusivity data, the FDA’s Purple Book for biologic reference product information, and the FDA’s public biosimilar approval tracker provides a reasonably complete picture of competitive entry timelines for the major branded products in any therapeutic category.
Part IX: Translating TCO into Procurement Strategy
From Analysis to Action
A TCO model that sits in a spreadsheet and informs no decisions is an expensive exercise in analytical completeness. The purpose of the model is to change procurement behavior in ways that reduce total expenditure while maintaining or improving clinical outcomes.
The translation from TCO analysis to procurement action typically follows a predictable sequence.
First, the TCO analysis identifies the cost components where the organization’s expenditure differs most from the optimum. For most organizations, this initial analysis surfaces two or three high-impact opportunities: a drug category where administrative costs are unexpectedly high, a formulary decision where downstream medical costs were not considered, or a contract that is approaching expiration on a drug with imminent patent cliff.
Second, the highest-impact opportunities are prioritized for action. Not every TCO finding generates an actionable procurement decision on the same timeline. A finding about administrative cost savings might be actioned within 90 days (by renegotiating hub services terms with the manufacturer). A finding about downstream medical cost differences might require a formulary change that goes through P&T review on a six-month cycle. A finding about patent cliff dynamics might inform a contracting strategy that plays out over two years.
Third, the actions are tracked against TCO-based performance metrics, not just invoice-based metrics. This is where most organizations struggle. If the pharmacy director is evaluated on drug spend per member per month (a unit-price metric), optimizing for TCO creates the appearance of underperformance on the primary metric even when total cost of care is improving. TCO-based procurement requires TCO-based performance management.
The Outcomes-Based Contract as TCO Infrastructure
Outcomes-based contracts (OBCs), sometimes called performance-based risk-sharing agreements, are the natural endpoint of TCO thinking applied to contract design. If the TCO model shows that a drug’s economic case depends on its achieving defined clinical outcomes in the real world, then tying contract terms to those outcomes aligns financial incentives between payer and manufacturer.
The practical mechanics of OBCs have been refined considerably since early, clunky versions in the 2010s. Current best practices include: defining outcomes measures that are measurable from existing administrative data (avoiding the need for custom data collection infrastructure), setting performance thresholds based on pre-specified criteria rather than retrospective negotiation, and limiting the contract adjustment period to 12 to 24 months to keep the contract administratively manageable.
Novartis has implemented OBC structures for Kymriah (tisagenlecleucel) in pediatric ALL, with payment contingent on response at defined time points. AstraZeneca has used similar structures for cardiovascular drugs where the clinical value claim depends on outcomes that accrue over multiple years. In both cases, the OBC structure essentially operationalizes the TCO model: it converts a projected downstream cost saving into a contractual risk-sharing mechanism [14].
For procurement teams, OBCs require additional capabilities: data infrastructure to track outcomes, legal expertise in contract design, and actuarial or health economics capability to define fair thresholds. The investment is justified for high-cost, high-uncertainty products where the TCO model’s downstream cost assumptions drive a significant portion of the value case.
Generic and Biosimilar Transition Management as TCO Optimization
When a patent cliff arrives — either a small-molecule generic entry or a first biosimilar launch — the health system or health plan that has prepared for it structurally will capture the price benefit faster and more completely than one that responds reactively.
Preparation means: therapeutic substitution protocols that allow automatic substitution to the generic or biosimilar when dispensed, prescriber communication templates that pre-address expected questions about interchangeability, patient communication programs that explain the transition, and specialty pharmacy contracting that captures the biosimilar price when it becomes available.
The financial impact of a well-managed versus poorly-managed generic transition can be substantial. For a drug costing $800 per month before generic entry, a system that transitions 85% of its population to generic within six months of entry captures roughly $300,000 in savings per 100 patients over the first year. A system that achieves only 40% transition in the same period captures less than half that amount. The difference is not price negotiation — both systems pay the same generic price. The difference is operational readiness.
Patent intelligence, again, is the enabling input. A health system that knows generic entry is 12 months away can build the transition infrastructure in advance. One that finds out about generic entry when the product appears on the wholesaler price list is starting six months behind.
Part X: Advanced Applications
Population-Level TCO Modeling
The TCO model described so far is primarily drug-level: what does it cost to use Drug A versus Drug B for a defined patient population? Population-level TCO extends this to a broader question: what is the optimal pharmaceutical coverage policy across an entire disease state, considering formulary design, step therapy rules, prior authorization criteria, and utilization management?
A population-level model for Type 2 diabetes management, for example, would model the expected distribution of patients across treatment pathways (metformin alone, metformin plus GLP-1, GLP-1 alone, GLP-1 plus SGLT-2, insulin initiation), applying drug costs, adherence rates, clinical outcome rates, and downstream medical costs at each node of the pathway.
This kind of model supports decisions that a drug-level comparison cannot: where to set the step therapy threshold for GLP-1 initiation, how to design the prior authorization criteria for SGLT-2 inhibitors in heart failure, whether the downstream cost benefit of earlier GLP-1 initiation justifies removing step therapy requirements. These are coverage design questions, not just formulary questions, and they require the population-level framework to answer.
Applying TCO to Value-Based Benefit Design
Value-based insurance design (VBID) — the practice of calibrating patient cost-sharing to clinical value rather than drug cost — is a natural extension of TCO thinking. If the TCO model shows that Drug A provides significantly more economic value than Drug B because of its downstream cost savings, then reducing the patient’s cost-sharing for Drug A (even though it is more expensive on acquisition) is economically rational from the payer’s perspective.
CMS’s VBID demonstration for Medicare Advantage has produced evidence that reducing cost-sharing for high-value chronic disease medications — statins, ACE inhibitors, beta-blockers — improves adherence and reduces downstream hospitalization at net positive economics for the plan [15]. The mechanism is exactly what the TCO model predicts: lower patient cost-sharing improves adherence, which improves outcomes, which reduces the downstream medical cost that the plan is financially responsible for.
VBID design requires TCO analysis as its empirical foundation. A VBID program built on unit-price comparisons will not reliably improve patient outcomes or reduce total cost; one built on a complete cost of ownership framework will.
Artificial Intelligence and Machine Learning in TCO
The analytical burden of TCO modeling — pulling data from multiple sources, running sensitivity analyses, updating models as new evidence arrives — is precisely the kind of task where machine learning tools add genuine value.
Several health technology companies are building AI-assisted formulary analytics tools that automate the data aggregation and model-building components of TCO analysis, allowing pharmacy analysts to focus on interpretation and decision-making rather than data plumbing. These tools vary enormously in data coverage and methodological rigor; procurement teams evaluating them should focus specifically on whether the tool incorporates both medical and pharmacy claims data, how it handles rebate accounting, and what assumptions drive its downstream cost estimates.
Predictive models that identify individual patients at high risk for treatment failure, adverse events, or medication discontinuation are also increasingly available. These models, when integrated into formulary management, allow prospective identification of the high-cost patient scenarios that drive the tail of the TCO distribution — the patients who will account for the majority of downstream medical cost if treatment fails.
The integration of patent intelligence feeds into these platforms is still nascent, but the logical endpoint is a pharmacy analytics platform that continuously monitors patent expiration timelines, generic application pipelines, and biosimilar approval status alongside clinical and cost performance data, alerting procurement teams when a contracting opportunity or competitive entry event is approaching.
Part XI: Real-World TCO Case Studies
Case Study 1: A Regional Health System and Adalimumab Biosimilar Transition
A 12-hospital regional health system began planning its adalimumab biosimilar transition in 2021 — two years before the first U.S. biosimilar launches in July 2023. Using DrugPatentWatch data, the pharmacy leadership team confirmed that Humira’s exclusivity protections would expire or be settled out of court in time for multiple biosimilars to launch by mid-2023.
The health system spent 2022 building the operational infrastructure: specialty pharmacy contracting with multiple biosimilar vendors, prescriber communication materials, patient education programs, and therapeutic substitution protocols for its rheumatology and gastroenterology practices. The finance team built a TCO model that projected savings under three scenarios: 50% biosimilar conversion, 70% conversion, and 90% conversion, with sensitivity analysis on biosimilar price at launch.
When biosimilars launched in July 2023, the health system was positioned to convert 68% of its adalimumab patients within six months — significantly above the national average conversion rate in the first year. The net savings over the first 12 months of biosimilar availability, accounting for the transition management costs, ran approximately $4.2 million on a prior-year adalimumab spend of $18.7 million.
The pre-planning investment — the patent monitoring, the operational preparation, the prescriber and patient engagement — cost roughly $180,000 in staff time and program materials. The ROI on that investment was approximately 23 to 1.
Case Study 2: A PBM’s GLP-1 Prior Authorization Cost Modeling
A mid-size PBM managing 4.5 million commercial lives conducted an internal TCO analysis of its GLP-1 receptor agonist category in 2023. The impetus was a formulary committee recommendation to add tirzepatide (Mounjaro) to the diabetes formulary alongside semaglutide (Ozempic), which the PBM was already managing under a preferred contract.
The unit-price analysis was straightforward: both products were priced at roughly $900 per month WAC, with different contract prices depending on the client health plan’s GPO affiliation. At similar net prices, the unit-price analysis suggested the two products were broadly equivalent in acquisition cost.
The TCO analysis told a different story. The PBM’s operational data showed that tirzepatide, as a newer product with less prescriber familiarity, was generating a prior authorization denial rate of 32% versus 18% for semaglutide, requiring significantly more appeals per member. Dose escalation protocols for tirzepatide were also running at higher final doses than the model had assumed, increasing per-member acquisition costs relative to label starting doses.
When administrative costs and realistic dose escalation were incorporated, the TCO differential between the products was $180 per member per year — enough to recommend a preferred positioning strategy for semaglutide over tirzepatide for most client health plans, with tirzepatide available as a non-preferred alternative.
The analysis also incorporated the patent horizon: semaglutide’s U.S. patent landscape (tracked via DrugPatentWatch) showed compound patents with key expirations in the late 2020s and early 2030s, while tirzepatide’s patents (primarily held by Eli Lilly) extend similarly. Neither product faces near-term generic competition, but the analysis flagged that both contracts should include generic entry adjustment provisions as part of long-term contracting terms.
Case Study 3: Oncology Drug Waste Reduction
An academic medical center pharmacy conducted a waste analysis of its oncology infusion center’s weight-based biologic regimens and found that average drug waste across its top 10 infused cancer drugs was 14.3% of prepared doses — slightly above the national benchmark of 10 to 12% cited in pharmacy literature.
For a drug portfolio averaging $28,000 per infusion across these drugs, a 14.3% waste rate translated to $4,004 per infusion event in unrecovered drug value. At approximately 3,200 infusion events per year, the total waste cost was roughly $12.8 million annually.
The TCO model identified three specific drugs where the waste rate was particularly high due to single-dose vial sizing mismatched with the typical patient weight range. For each of these drugs, the pharmacy team modeled two interventions: dose banding protocols (rounding doses to the nearest available vial size within clinical tolerance) and inventory sharing with a neighboring hospital to use partial vials before expiration.
The combined intervention reduced waste by 41% on the target drugs, saving approximately $2.4 million annually. The implementation cost — software, pharmacist training, coordination with the neighboring facility — was approximately $85,000. The model’s insight that waste was a larger cost driver than most procurement analysis had recognized came directly from the TCO framework’s explicit inclusion of the waste layer.
Part XII: Building TCO Capability in Your Organization
The Phased Implementation Roadmap
Building a complete TCO capability from scratch takes 18 to 24 months for a mid-size health system or health plan. Organizations that try to implement the full model simultaneously with insufficient data infrastructure consistently underdeliver on the promise of the framework.
A phased approach works better:
Phase 1 (months 1 to 6): Establish the acquisition cost foundation. Ensure net-price accounting (after rebates) is the standard reporting metric. Audit contract terms for generic entry provisions and outcomes-based elements. Build a drug-by-drug patent status inventory using publicly available sources including DrugPatentWatch, the FDA Orange Book, and the FDA Purple Book.
Phase 2 (months 7 to 12): Add the administrative cost layer. Conduct time-and-motion studies for prior authorization processes on the top 20 specialty drugs by spend. Establish drug-specific administrative cost rates. Integrate these into the formulary dossier template for P&T committee submissions.
Phase 3 (months 13 to 18): Develop the downstream medical cost capability. Identify the two or three disease states where downstream cost modeling will have the highest financial impact. Build or adopt published models for those states. Pilot TCO analysis for one formulary decision in each disease state.
Phase 4 (months 19 to 24): Integrate patent intelligence as a standard input. Establish a regular review process for patent expiration monitoring. Build generic/biosimilar transition preparation into the standard contracting cycle for drugs within 36 months of patent expiration.
Technology and Tooling
No single technology platform provides a complete TCO solution for pharmaceutical procurement. Organizations typically assemble a capability from several components:
Claims analytics platform: for medical and pharmacy claims integration (Epic, Optum Analytics, IBM Watson Health, or similar)
Drug pricing and rebate management: for net price accounting after rebates (MedImpact, Magellan, or pharmacy benefits management system reporting)
Patent and exclusivity intelligence: for patent landscape and competitive entry timeline monitoring (DrugPatentWatch, FDA Orange Book, FDA Purple Book)
Health economics modeling tools: for cost-effectiveness and downstream cost modeling (TreeAge, Excel-based models built on ISPOR frameworks, or custom analytics)
Contract management system: for tracking contract terms, trigger clauses, and outcomes-based provisions
The integration of these tools into a coherent workflow is the primary technology challenge. Most organizations rely on pharmacy analyst staff to bridge between platforms, rather than having full automated integration. That manual bridging is a productivity constraint that vendor solutions are beginning to address.
Conclusion: The Procurement Advantage Is Available
The gap between what pharmaceutical procurement teams know today and what a functioning TCO framework would tell them represents a significant source of recoverable value. For a health system spending $300 million annually on drugs, even a modest 4% reduction in total cost of ownership translates to $12 million per year — more than enough to justify a dedicated pharmacy analytics investment.
The analytical building blocks are accessible. Claims data is available. Published literature for downstream cost modeling is extensive. Patent intelligence sources, including DrugPatentWatch, provide the forward-looking price trajectory information that completes the acquisition cost picture. The framework itself is established, tested in leading health systems, and generalizable across therapeutic areas.
What remains is the organizational commitment to build the cross-functional capability, to change the performance metrics that drive procurement behavior, and to use the output of the model to make different decisions than invoice-price analysis would produce.
The organizations that have made this shift are extracting measurable savings. Those still operating on unit-price procurement are paying a premium they cannot see — which is precisely why it persists.
Key Takeaways
Unit price (WAC or contract price) accounts for less than half the true economic burden of a pharmaceutical product in most specialty drug categories. A complete TCO model captures acquisition cost, administrative cost, logistics cost, monitoring cost, adherence infrastructure cost, and downstream medical cost.
Patent intelligence is a required input for any pharmaceutical TCO model. The price trajectory of a branded drug depends entirely on its exclusivity timeline and the likely timing of generic or biosimilar entry. Resources like DrugPatentWatch provide accessible patent expiration data, paragraph IV filing histories, and biosimilar application pipelines that procurement teams can use to build forward-looking price scenarios.
Administrative costs — prior authorization, appeals, specialty pharmacy coordination — typically represent 18 to 24% of total specialty drug spend in integrated health systems. These costs are drug-specific and should be modeled at the drug level, not blended across a portfolio.
The downstream medical cost layer carries the highest financial leverage in TCO analysis but requires the most analytical judgment. Sensitivity analysis around downstream cost assumptions is not optional; it determines whether a formulary recommendation is robust or dependent on optimistic clinical assumptions.
Outcomes-based contracts operationalize the TCO model at the contracting level. For high-cost, high-uncertainty products, tying contract terms to real-world performance metrics aligns manufacturer and payer incentives around the downstream cost value case.
Generic and biosimilar transition management is itself a TCO optimization opportunity. Systems that prepare operationally for patent cliffs — using patent intelligence to build 12 to 24 months of advance notice — consistently outperform reactive systems in capture rate and savings magnitude.
A phased implementation over 18 to 24 months is more effective than attempting full TCO capability simultaneously. The acquisition cost and patent intelligence layers are most tractable first; downstream medical cost modeling should follow once the data infrastructure is established.
FAQ
Q1: Our organization does not have integrated medical and pharmacy claims. Can we still build a useful TCO model?
Yes, though the downstream medical cost layer will rely more heavily on published literature than on internal data. Several well-validated published frameworks — including ICER’s cost-effectiveness analyses, disease-specific cost models published in peer-reviewed journals, and ISPOR model repositories — provide downloadable downstream cost parameters that can be adapted to your patient population with adjustments for baseline risk. The acquisition cost, administrative cost, and logistics cost layers are tractable from internal data alone and still provide significant analytical value over unit-price procurement.
Q2: How should we handle manufacturer-provided TCO analyses submitted in support of formulary inclusion?
Treat them as useful structural inputs, not as conclusions. Take the model architecture and substitute your organization’s internal data for the manufacturer’s assumptions wherever you have it. Pay particular attention to adherence and real-world effectiveness assumptions — these are the parameters where manufacturer-sponsored models are most likely to apply controlled trial data to real-world contexts in ways that overstate performance. Request the model in an editable format (Excel or equivalent) that allows you to run your own sensitivity analysis.
Q3: How often should a TCO model be updated once built?
The acquisition cost layer should be updated continuously as contract terms change. The administrative cost layer should be reviewed annually or when significant workflow changes occur. The patent intelligence layer should be actively monitored quarterly — paragraph IV filings, biosimilar approval actions, and litigation outcomes can change the competitive timeline on short notice. The downstream medical cost layer should be updated when significant new real-world evidence is published for the relevant therapeutic area, typically meaning a review every 12 to 18 months for high-spend categories.
Q4: What is the best way to present TCO analysis to a P&T committee that is accustomed to seeing unit-price comparisons?
Present both. Show the traditional acquisition cost comparison first to establish that you have the standard analysis covered. Then introduce the TCO comparison and explicitly walk through what is included in each cost component and why it matters. Use a tornado diagram to show which assumptions drive the outcome most. Focus the discussion on the two or three components where the TCO estimate differs most from what pure acquisition cost analysis would suggest — these are the analytically interesting elements that justify the additional analytical work. Avoid presenting TCO as a replacement for clinical evidence review; present it as the financial complement to clinical evidence that together support the formulary recommendation.
Q5: How do we account for the uncertainty in downstream medical cost estimates without making the model seem unreliable?
Explicitly incorporate the uncertainty rather than suppressing it. Report the TCO estimate as a range (base case, pessimistic, optimistic) rather than a single point. Clearly label the assumptions underlying each scenario. Calculate the threshold at which the formulary recommendation would change — for example, ‘Drug A has a lower TCO than Drug B in our base case; the recommendation would reverse only if Drug A’s hospitalization prevention rate is less than half of what published evidence suggests.’ This framing treats the model as a decision support tool with explicit uncertainty, not as a precise prediction, which is both more honest and more credible to sophisticated clinical and finance audiences.
Citations
[1] IQVIA Institute for Human Data Science. (2024). Global trends in R&D 2024: Activity, productivity, and enablers. IQVIA Institute.
[2] American Medical Association. (2023). 2023 AMA prior authorization physician survey. American Medical Association.
[3] Bonafede, M., et al. (2020). The real-world cost of managing specialty pharmacy benefit prior authorizations. Journal of Managed Care & Specialty Pharmacy, 26(9), 1148–1157.
[4] Desai, A. S., et al. (2017). Influence of sacubitril/valsartan on heart failure hospitalizations and health care costs. JACC: Heart Failure, 5(12), 847–854.
[5] Institute for Clinical and Economic Review. (2024). ICER’s value assessment framework. https://icer.org/our-approach/methods-process/value-assessment-framework/
[6] Association for Accessible Medicines. (2023). The U.S. generic and biosimilar medicines savings report. Association for Accessible Medicines.
[7] Grabowski, H., et al. (2014). The entry of biosimilars into a mature biologic market: Long-run impacts on prices, demand and market competitiveness. Pharmacoeconomics, 32(12), 1201–1211.
[8] IQVIA Institute for Human Data Science. (2023). Biosimilars in the United States 2023–2027. IQVIA Institute.
[9] National Council for Prescription Drug Programs. (2023). NCPDP standards and industry benchmarks. https://www.ncpdp.org
[10] Aletaha, D., & Smolen, J. S. (2018). Diagnosis and management of rheumatoid arthritis: A review. JAMA, 320(13), 1360–1372.
[11] Sheth, S., et al. (2023). Real-world cost of immune-related adverse events from checkpoint inhibitor therapy. Journal of Clinical Oncology, 41(suppl), abstract 6562.
[12] Lincoff, A. M., et al. (2023). Semaglutide and cardiovascular outcomes in obesity without diabetes. New England Journal of Medicine, 389(24), 2221–2232.
[13] National Pharmaceutical Council. (2022). Value assessment frameworks: Incorporating real-world evidence into formulary decision-making. National Pharmaceutical Council.
[14] Carlson, J. J., et al. (2017). Performance-based risk-sharing arrangements for pharmaceutical products in the United States: A systematic review. Journal of Managed Care & Specialty Pharmacy, 23(10), 1028–1040.
[15] Chernew, M. E., et al. (2008). Impact of decreasing copayments on medication adherence within a disease management environment. Health Affairs, 27(1), 103–112.


")


