Pharmaceutical procurement teams spend enormous effort negotiating the price on a purchase order. Then they lose more money in the thirty days after it is signed than they saved in the negotiation. Drug shortage labor runs $900 million a year in U.S. hospitals alone. Seven percent of all pharmaceutical stock never reaches a patient. A compounding series of tariffs, port charges, and distributor markups adds an average of 68.6% on top of whatever the manufacturer charged in the first place.
None of these costs appear on the negotiation scorecard.
This article dismantles the illusion that purchase price is the primary lever of pharmaceutical procurement value. It maps every significant category of hidden cost, explains the macro forces that generate them, and lays out a phased transformation roadmap that procurement leaders can execute starting this quarter. The framework draws on case studies from Pfizer, Roche, GlaxoSmithKline, and Midwinter Solutions, as well as data from Vizient, the World Health Organization, Gartner, and the industry’s most comprehensive patent intelligence platform, DrugPatentWatch.
If you manage pharmaceutical spend and you are not tracking patent expiration schedules, supplier segmentation scores, and AI-generated demand signals as core procurement metrics, you are leaving a significant percentage of value on the table. This is what the full picture looks like.
Part I: The Illusion of the Purchase Price
Why Price-Only Procurement Is a Value Destruction Strategy
The procurement function in most pharmaceutical organizations was built around a clear, defensible logic: get the inputs you need at the lowest possible price. That logic made sense when supply chains were short, regulatory requirements were simpler, and product portfolios did not span both cutting-edge biologics and commoditized generics. None of those conditions exist anymore.
The dominant model today is still what consultants call ‘price-in, price-out’: negotiate hard on unit cost, hit the savings target, move to the next category. The problem is not that price negotiation is wrong. The problem is that it is incomplete by an order of magnitude. Every pharmaceutical procurement organization has an official cost structure that appears on the P&L, and a shadow cost structure that does not. The shadow cost structure is frequently larger.
Consider what a pharmaceutical supply chain actually does between the moment a raw material leaves a supplier’s dock and the moment a finished dose reaches a patient. The product changes hands multiple times. It crosses borders. It sits in temperature-controlled warehouses. It gets tested, documented, re-labeled, and tracked. Each of those steps costs money. Some of those costs are negotiated, many are not. Most are not even visible in a standard procurement dashboard.
The result is a systematic underestimation of what procurement actually costs. Organizations optimize the 30% of spend they can see clearly and ignore the 70% that drives most of their risk and a substantial fraction of their total expenditure. The term ‘Total Cost of Ownership’ (TCO) has been in the supply chain vocabulary for decades, but genuine TCO thinking, where every downstream consequence of a sourcing decision is factored into the upfront choice, remains rare in pharmaceutical procurement.
This article exists to change that calculation.
Direct Versus Indirect Spend: A Distinction That Creates Blind Spots
Pharmaceutical procurement divides its world into two categories: direct and indirect spend. Direct procurement covers everything that goes into the finished product: Active Pharmaceutical Ingredients (APIs), excipients, raw materials, primary packaging. Indirect procurement covers everything else: IT systems, marketing services, logistics contracts, facility management, clinical trial supplies, consulting.
The split is operationally convenient, but it generates a structural blind spot. Direct procurement receives strategic attention because the consequences of failure are immediate and visible. A shortage of a critical API stops production. A quality failure in a raw material triggers a recall. The link between procurement decision and business outcome is short and legible [1].
Indirect procurement, by contrast, is often managed department by department, with individual budget holders making ad-hoc purchasing decisions outside negotiated contracts. This decentralized approach makes it ‘challenging to account for all expenditures’ [2]. Spend is dispersed, invoices are fragmented, supplier rosters are bloated with unvetted vendors, and the organization loses all volume leverage. Worse, it loses visibility. You cannot manage what you cannot see.
The real problem with the direct/indirect split is not the classification itself but the strategic attention it allocates. An organization might have a highly sophisticated API sourcing strategy while its logistics spend is completely unmanaged, its ERP system contracts are auto-renewed without market testing, and its clinical trial supply chain operates on spreadsheets. The downstream costs of those failures, whether expedited freight charges, system downtime, or trial delays, do not show up in the direct procurement budget. They show up in operational costs, project overruns, and revenue timing misses.
A mature procurement organization applies the same strategic discipline to its most critical indirect categories that it applies to APIs. The two most important questions are: ‘Which categories create existential risk if they fail?’ and ‘Which categories represent enough spend to justify strategic management?’ The answers to those questions determine where TCO thinking should go first.
What Total Cost of Ownership Actually Measures
TCO is not a formula. It is a discipline of systematically asking, ‘What are all the costs associated with this sourcing decision, including the ones that occur after the purchase order is signed?’
For a pharmaceutical company sourcing a generic API, a TCO analysis would include:
The unit price of the API is only the starting point. Add to it: inbound freight and insurance, import tariffs, customs brokerage fees, and any applicable VAT. Then add: internal receiving and quality control labor, analytical testing costs, and the cost of any holds or rejections. Factor in: the carrying cost of safety stock held against supply risk from that specific supplier, estimated as a percentage of inventory value. Calculate: the cost of switching suppliers if this one fails, including the time and expense of qualification studies. Estimate: the probability-weighted cost of a supply disruption and its impact on production schedules and customer commitments.
When you add all of that up, the supplier charging 8% less per kilogram of API is not always cheaper. In many documented cases, the lower-price supplier generates higher total cost because their quality rejection rate is higher, their lead times are less reliable, and the safety stock required to buffer their performance ties up more working capital than the price difference saves.
That is what TCO thinking reveals. The rest of this article quantifies exactly how large these hidden costs are and what procurement leaders can do about them.
Part II: A Taxonomy of Hidden Costs
The Financial Iceberg: What the Balance Sheet Misses
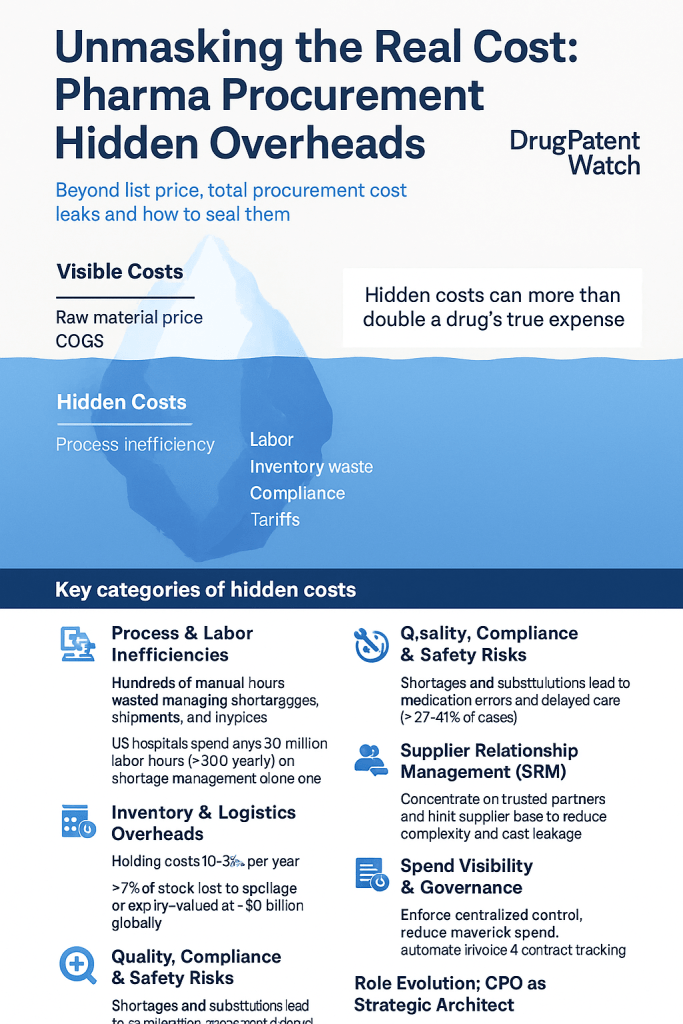
The visible part of pharmaceutical procurement cost, unit prices for APIs, raw materials, excipients, and operating expenses for indirect goods, is what finance teams track and report. The invisible part is what this section maps. Think of it as a financial iceberg: the surface is neat and manageable; what is below the waterline is far larger and far more dangerous.
The categories below are not theoretical. Each is supported by data from industry surveys, WHO studies, and documented case histories. Together, they paint a picture of a cost structure that most pharmaceutical procurement organizations are only partially managing.
Category 1: Drug Shortage Labor – $900 Million Per Year
The most documented and least discussed hidden cost in pharmaceutical procurement is the labor consumed by drug shortages. When a drug is unavailable, somebody has to find an alternative. That somebody is typically a pharmacist, a clinical pharmacy technician, or a physician. Their time is expensive and their attention is the most valuable resource in a healthcare organization.
A 2023 Vizient survey quantified this burden with precision that should disturb every pharmaceutical supply chain professional. U.S. hospitals collectively spent approximately 20 million hours managing drug shortages in the survey period, converting to nearly $900 million in annual labor costs [3]. That figure more than doubled compared to a similar survey conducted in 2019. The work involved is not strategic: it is identifying the shortage, sourcing alternative therapies that are typically more expensive, communicating with clinical teams, documenting substitutions for regulatory purposes, and updating internal systems.
Pediatric facilities carry a disproportionate share of this burden. Because they manage both adult and pediatric dosing regimens, they monitor at least 25% more shortages than general hospitals [3]. The complexity of weight-based dosing calculations for alternative drugs adds additional clinical risk on top of the administrative cost.
What makes this cost invisible to most procurement organizations is its location in the budget. The labor hours do not appear in the procurement department’s cost center. They appear in pharmacy operations, nursing, and medical staff accounts. From a procurement reporting perspective, a drug shortage looks like a sourcing problem. From a finance perspective, it looks like an operations cost. Nobody connects the two in a single measurement framework, which means nobody sees the full bill.
The implication is direct: every percentage point improvement in supply continuity for critical drugs has a value that extends far beyond the avoided emergency purchase cost. It includes the labor savings from not managing the shortage, the clinical error reduction from not needing to switch therapies, and the patient outcome improvement from not delaying treatment. Procurement organizations that can quantify this full value have a compelling business case for investment in resilience infrastructure that far exceeds what a narrow savings-focused justification would support.
Category 2: Manual Logistics Overhead – Thousands Per Month, Per Operator
Pharmaceutical logistics is operationally intensive. Shipments require temperature monitoring, chain-of-custody documentation, and compliance with a dense regulatory framework that varies by market. Overlaid on this complexity is a baseline of manual labor that represents pure, avoidable cost.
One logistics analysis found that a typical operator spends more than 15 minutes manually creating each individual shipment: checking carrier rates across fragmented contract portfolios, printing labels, entering data into multiple systems, and generating the required documentation [4]. Multiply that time by the number of shipments an organization processes per day, and the monthly labor cost reaches into the thousands of dollars per logistics operator, before accounting for the error rate that manual data entry introduces.
The error rate matters because errors in pharmaceutical logistics are not free. A mislabeled shipment can trigger a quarantine, a regulatory inquiry, or a recall. A data entry mistake in a temperature log can invalidate a quality release. The direct cost of correcting these errors adds to the labor cost of creating them in the first place.
Fragmented logistics contracts compound the problem. When different departments or business units manage their own carrier relationships, the organization loses the volume leverage that would allow it to negotiate better rates. It also generates scattered invoices, duplicate accounts, and an accounts payable workload that is entirely avoidable with centralized, automated management [4].
Category 3: Maverick Spending – The Cost of Decentralization
Maverick spending occurs when an employee purchases goods or services outside the organization’s negotiated contracts and established procurement channels. In pharmaceutical organizations, this happens most frequently in indirect categories: a clinical team sources lab supplies from a preferred vendor rather than the contracted supplier, a marketing department engages an agency without procurement involvement, an IT team purchases software licenses on a departmental credit card.
Each individual instance seems minor. The cumulative effect is not. Maverick spending does three things that all cost money. First, it pays above-contract prices because the negotiated rates and volume discounts are not applied. Second, it bypasses quality and compliance vetting, introducing supplier risk that the organization has not evaluated. Third, it consumes finance and procurement team hours in reconciliation, exception processing, and vendor onboarding for suppliers who should never have been engaged [2].
The scale of maverick spending in pharmaceutical organizations is underestimated precisely because it is, by definition, outside the visibility of the procurement system. Industry data consistently suggests that 20 to 40% of organizational spend in complex, decentralized environments falls outside procurement control. In a company with $500 million in annual indirect spend, that represents $100 to $200 million of expenditure with no systematic price optimization, no supplier compliance requirement, and no strategic leverage.
Category 4: Inventory Carrying Costs and Stock Loss – $10.3 Billion Globally
The cost of holding inventory is one of the best-documented hidden costs in supply chain management and one of the most consistently underestimated. Industry estimates place carrying costs at 10% to 35% of the inventory’s total value annually [5]. These costs include:
Warehousing space and utilities, security and environmental monitoring systems, insurance premiums, and the cost of capital tied up in stock that could otherwise be deployed productively. For temperature-sensitive biologics and specialty drugs, add the cost of cold chain infrastructure and monitoring to every percentage point of that range.
The consequence of over-forecasting demand is excess inventory that generates all of these costs without generating revenue. The consequence of under-forecasting is stockouts, which generate their own cascade of costs described in the shortage labor section above. Most pharmaceutical organizations oscillate between both failure modes, under-forecasting for some products and over-forecasting for others, often within the same product portfolio.
The stock loss problem is even more alarming. A study analyzing pharmaceutical supply chains globally found that 7.1% of all pharmaceutical stock is lost before reaching patients [6]. The breakdown is instructive: 4.1% perishes, spoils, or is damaged in transit or storage, while an additional 3% is lost to overproduction that never finds a market. The total value of this lost stock comes to $10.3 billion globally [6].
That $10.3 billion is not a rounding error. It is a direct consequence of inadequate demand forecasting, insufficient cold chain management, poor inventory visibility, and suboptimal production planning. Every dollar of it represents a cost that was paid and a therapy that did not reach a patient.
When a drug expires on a warehouse shelf, the organization has paid for manufacturing, packaging, quality release, and storage, and received nothing in return. When temperature excursions damage a cold chain product in transit, the cost of the damaged goods is only part of the loss. The investigation, documentation, regulatory notification, and potential patient safety review that follow add substantial overhead to every incident.
Category 5: Supply Chain Markups – 68.6% Over Manufacturer Price
The manufacturer’s price for a pharmaceutical product is the beginning of the price, not the end. As that product moves through the global distribution system, it accumulates a compounding series of charges that can transform a $10 product into a $17 product by the time it reaches the end customer.
A WHO study analyzing pharmaceutical supply chains across nine countries quantified this markup cascade with granular precision [5]. The cumulative effect of import tariffs, VAT, port charges, wholesale markups, and retail margins added an average of 68.6% to the original manufacturer’s price. The components of that markup varied significantly by country and product type:
Import tariffs ranged from zero in duty-free markets to 11.7% in South Africa. VAT added up to 20% in Armenia. Port clearance and handling fees contributed several additional percentage points. Wholesale and retail margins were the largest single component in most markets, with retail markups reaching 50% in Tanzania and South Africa [5].
The compounding effect is what makes this cost so significant. Each new charge is not applied to the manufacturer’s price but to the cumulative price that already incorporates all previous charges. A 5% import tariff, a 10% VAT, a 3% port charge, and a 30% retail margin do not add up to 48%; they compound to something higher, because each subsequent charge is applied to a base that has already been inflated by all previous charges.
For procurement professionals managing global distribution networks, this cascade has three practical implications. First, sourcing from markets with lower tariff structures and more competitive distribution sectors can reduce total acquisition cost even if the ex-manufacturer price is slightly higher. Second, supply chain consolidation, reducing the number of intermediaries between manufacturer and end customer, reduces the number of markups applied. Third, direct-to-market distribution models, where feasible from a regulatory standpoint, can eliminate entire layers of the markup stack.
Category 6: Quality Failures and Patient Safety Costs
The most expensive category of hidden cost is also the hardest to quantify in advance: the cost of quality failures, medication errors, and patient care disruptions caused by supply chain problems.
The Vizient 2023 survey found that 43% of responding healthcare facilities reported medication errors as a direct result of drug shortages, up from 38% in 2019 [3]. When a drug is unavailable, clinicians substitute an alternative, often under time pressure and without the full familiarity they have with the standard therapy. Different concentrations, different dosing schedules, and different drug interactions create the conditions for error.
The financial consequences of a medication error are difficult to separate from the human ones, but they are substantial. Corrective treatment, extended hospital stays, legal liability, and regulatory response all generate direct costs. Reputational damage to healthcare providers and, by extension, to the pharmaceutical supply chain that caused the shortage, generates indirect costs that persist long after the immediate incident is resolved.
The care disruption data from the same survey is equally striking. Twenty-seven percent of responding facilities reported that drug shortages caused delays, omissions, or cancellations of patient care [3]. Outpatient infusion services were the most severely affected, with 41% of patient cases impacted by shortage-related disruptions [3]. Each cancelled infusion appointment is simultaneously a patient outcome problem and a revenue problem for the provider. For specialty drugs with high per-treatment costs, the revenue impact of a single cancellation can be significant. <blockquote> ‘New Vizient survey finds drug shortages cost hospitals nearly $900 million annually in labor expenses, with 43% of facilities reporting medication errors directly linked to shortage-driven therapy substitutions.’ (Vizient, 2025) [3] </blockquote>
These costs accrue in clinical operations budgets, legal reserves, and patient satisfaction scores, not in procurement reports. That is why they are invisible to procurement-focused cost management. The only way to see the full cost of a supply chain failure is to track consequences across the entire organizational cost structure, from procurement through operations through clinical outcomes through legal liability. Very few organizations do this systematically.
Part III: The External Forces That Amplify Every Hidden Cost
The Patent Cliff: $200 Billion in Revenue at Risk by 2030
Pharmaceutical procurement does not operate in a stable environment. It operates in one of the most dynamic and disruptive market environments of any industry sector, where the competitive landscape for a single product can change overnight when a patent expires.
The ‘patent cliff’ is the sheer drop in revenue that an innovator company experiences when its blockbuster drug loses market exclusivity. Historical patterns are consistent and severe. Pfizer’s Lipitor, which had annual U.S. sales exceeding $10 billion, lost more than half its revenue within twelve months of generic entry in 2011 [7]. Across the industry, blockbuster drugs have lost up to 80% of their revenue in the first year of generic competition [8].
The scale of the current cliff makes this a defining issue for pharmaceutical procurement through the end of the decade. DrugPatentWatch, which tracks patent expiration schedules and exclusivity timelines across the global pharmaceutical market, estimates that approximately $200 billion in annual pharmaceutical revenue is at risk globally between now and 2030 as major drugs face generic and biosimilar competition [7]. For procurement teams managing both branded and generic product portfolios, this figure represents both a cost-saving opportunity and a sourcing complexity challenge.
The procurement implications of patent expiration divide into two simultaneous strategic demands that pull in opposite directions.
For the innovator company facing generic competition, the imperative is revenue protection. This might involve aggressive formulary management, patient loyalty programs, or the launch of authorized generics to capture some of the price-sensitive market. It requires a procurement strategy that can support these commercial responses quickly and at scale.
For the payer, hospital system, or generic manufacturer, patent expiration represents an opportunity to drive prices down dramatically. Prices for off-patent small molecules typically fall 80 to 90% within the first year of generic entry [7]. Capturing that price reduction requires a procurement organization capable of executing rapid multi-supplier sourcing events, managing a competitive supply base, and switching qualified suppliers based on price and performance.
The complication is that the current cliff is dominated by biologic drugs rather than traditional small molecules, which changes the economics considerably [8]. Biosimilars, the complex-molecule equivalents of generics, do not create the same immediate, steep price competition as small-molecule generics because they are not automatically substitutable in most markets, require more complex manufacturing, and face higher regulatory hurdles for market entry. Revenue decline for originators facing biosimilar competition tends to be shallower and slower than the cliff seen with small-molecule generics. That difference is strategically significant for procurement teams on both sides of the transaction.
The organizations that execute this bifurcated strategy best, managing deep innovation partnerships for on-patent assets while running aggressive, data-driven sourcing events for off-patent products, will capture significantly more value from the patent cliff than those that apply a single procurement model across their entire portfolio.
The Regulatory Labyrinth: Compliance as a Structural Cost
Pharmaceutical procurement operates within one of the most heavily regulated environments in the global economy. The U.S. Food and Drug Administration (FDA), the European Medicines Agency (EMA), and their equivalents in major markets set requirements for API sourcing, manufacturing practices, product testing, packaging, distribution, and pharmacovigilance that create a structural compliance overhead on every procurement decision.
That overhead is not trivial. Supplier qualification under Good Manufacturing Practice (GMP) standards requires extensive audits, documentation review, and ongoing monitoring. Analytical testing of incoming materials consumes laboratory capacity and creates time delays between receipt and release for production. Change management requirements, which mandate that any change to an approved manufacturing process or supply chain be validated and potentially re-approved by regulators, make procurement agility expensive and slow [9].
Two pieces of recent legislation have added significantly to this compliance burden. The Drug Supply Chain Security Act (DSCSA) in the United States and the Falsified Medicines Directive (FMD) in Europe both require end-to-end traceability of prescription drugs through the distribution chain. Implementing these requirements has forced pharmaceutical companies to invest in 2D barcoding infrastructure, electronic track-and-trace systems, and interoperable data sharing with supply chain partners [10]. These are not optional investments; they are legal requirements with significant penalties for non-compliance.
The Inflation Reduction Act (IRA) in the United States has added a different kind of complexity. By granting Medicare the authority to directly negotiate prices for certain high-cost drugs, the IRA has altered the contracting landscape for a significant segment of the pharmaceutical market. Procurement teams managing government formulary contracts must now navigate a process with no historical precedent and uncertain parameters [8]. The compliance infrastructure required to participate in this process and to manage its downstream implications adds to the already substantial overhead of regulatory compliance.
The procurement response to this regulatory environment cannot be to minimize compliance investment. The cost of non-compliance, including potential product seizures, market access delays, civil penalties, and reputational damage, vastly exceeds the cost of maintaining robust compliance systems. The strategic imperative is to make compliance efficient: to build systems that generate and maintain required documentation automatically, to choose suppliers whose own compliance infrastructure is strong, and to use technology to transform compliance from a manual, labor-intensive activity into an automated, data-driven one.
Post-Pandemic Supply Chain Fragility: Building Resilience in Permanent Disruption
The COVID-19 pandemic did not create vulnerabilities in pharmaceutical supply chains. It revealed them. The just-in-time inventory models, single-source supplier relationships, and geographic concentration in API manufacturing that had been optimized for efficiency under stable conditions collapsed rapidly when disruption hit at scale.
The aftermath has produced a consensus that the pre-pandemic operating model for pharmaceutical supply chains was structurally fragile and that rebuilding it for resilience requires significant strategic investment. As one executive panel on pharmaceutical supply chain transformation concluded, ‘We have to build in additional redundancies, additional capacity, both nationally and globally’ [11].
That statement has direct procurement implications. Building in redundancy means qualifying multiple suppliers for critical materials, even when a single supplier offers a better price. It means maintaining strategic safety stock at levels that reduce supply risk, even when carrying costs would argue for leaner inventory. It means investing in supply chain mapping, so that organizations know not just who their first-tier suppliers are but who supplies those suppliers, and where the concentration risks in the extended network sit.
The macroeconomic environment of 2025 amplifies this challenge. Global inflation has increased the baseline cost of manufacturing inputs, energy, and logistics. International shipping tariffs are evolving in response to trade policy shifts, particularly affecting API supply chains that run through Asia. These cost pressures hit procurement budgets directly and make the efficiency case for digital transformation and strategic sourcing even more compelling [4].
The organizations that emerge from this environment in the strongest competitive position will be those that treated the post-pandemic period as an opportunity to rebuild their supply chains on a better architectural foundation, rather than simply restoring what existed before. The procurement function is the primary lever for that rebuilding work.
Part IV: Digital Tools That Target Hidden Costs Directly
E-Procurement and Automation: The Foundational Layer
The most direct route to eliminating procurement process inefficiency is digitization. E-procurement platforms automate the procure-to-pay lifecycle, from supplier selection and contract management through purchase order creation, invoice processing, and payment, creating a systematic replacement for manual, fragmented, error-prone processes.
The ROI case for e-procurement is well-supported by documented outcomes. McKinsey estimated that procurement digitization can generate savings of up to 25% of total procurement spend, primarily by centralizing spend visibility, enforcing contract compliance, eliminating maverick purchasing, and reducing administrative overhead [12]. These are not aspirational projections; they reflect achieved outcomes at companies that have executed the implementation well.
The pharmaceutical industry’s major players have produced documented evidence of what these platforms can deliver:
Pfizer deployed a dedicated e-sourcing platform and reported a 30% reduction in procurement cycle times, meaning faster supplier selection, faster contracting, and faster time-to-supply for new initiatives [12]. Roche’s implementation of a comprehensive e-procurement platform delivered a 50% reduction in procurement cycle times, a result that reflects not just automation but process re-engineering built on top of the platform [12]. GSK deployed a global procurement system that created a centralized repository for supplier management, purchase orders, and invoices, generating significant cost savings and improving supplier relationship management at scale [12].
The common thread in these case studies is that the platform itself is not the value. The value comes from what the platform enables: complete spend visibility, enforcement of negotiated contracts, a consolidated data set for strategic analysis, and the freeing of procurement talent from administrative tasks to focus on supplier development and sourcing strategy.
For organizations still operating primarily on manual or fragmented systems, the implementation of a foundational e-procurement platform should be the first priority in any cost reduction program. Without it, none of the more advanced tools, whether AI-powered forecasting, strategic supplier management, or blockchain traceability, can be deployed effectively. The data foundation must come first.
AI and Machine Learning: From Reactive to Predictive
The most significant structural driver of hidden costs in pharmaceutical procurement is the mismatch between supply and demand. Over-forecast, and you hold excess inventory at 10 to 35% annual carrying cost while some of it expires. Under-forecast, and you scramble for emergency supply at premium prices while clinical teams manage shortages and medication errors increase.
Traditional forecasting methods, which rely primarily on historical sales data with simple trend-line projections, are structurally inadequate for this challenge. They cannot account for sudden changes in disease incidence, competitor supply disruptions, regulatory events that affect prescribing, or the complex interaction of multiple variables that simultaneously influence demand for a given drug.
AI-powered forecasting engines represent a genuine improvement over these methods, not because artificial intelligence is inherently magical, but because it can analyze far more variables simultaneously and identify non-obvious patterns in complex datasets. Modern pharmaceutical AI forecasting systems incorporate macroeconomic indicators, public health surveillance data, epidemiological trends, weather patterns that affect disease incidence, competitor behavior data, and social media signals alongside traditional sales history [13]. The result is a demand forecast that is more accurate across more product lines and more time horizons than any human analyst can produce manually.
The procurement implications of better forecasting flow directly to the bottom line. Reduced inventory variance lowers average inventory levels, cutting carrying costs. More accurate supply signals reduce the frequency and severity of stockouts, cutting emergency purchase spend and shortage management labor. Automated replenishment, where the AI system generates purchase orders when inventory reaches a calculated reorder point, reduces the manual workload of inventory management and the human error rate that manual systems carry.
Several pharmaceutical manufacturers have moved beyond pilot programs to full deployment of AI forecasting systems. The documented outcomes include reductions in inventory costs, improvements in service levels, and reductions in the labor associated with manual inventory management. The technology is mature enough to deploy at scale; what remains is the organizational commitment to feed it clean data and act on its outputs.
The data quality dependency is critical. An AI forecasting system trained on fragmented, incomplete, or inconsistent data will produce forecasts that are wrong in unpredictable ways. This is why the e-procurement platform, which creates a clean and centralized data foundation, must precede AI deployment in any properly sequenced digital transformation roadmap.
Blockchain for Traceability: A Trust Layer for a Fragmented Chain
The pharmaceutical supply chain has a fundamental trust problem. At any given point, a product’s history depends on paper documents, manual entries, and the integrity of dozens of intermediaries who may or may not have kept accurate records. The traditional ‘one-up, one-down’ visibility model, where each participant can verify only the transaction immediately before and after their own, creates a chain of limited and potentially unreliable information.
The consequence of this opacity is visible in the counterfeit drug market. Estimates of its scale reach $431 billion annually [6]. Counterfeit drugs reach patients who believe they are receiving legitimate therapy. The harm is direct: subtherapeutic counterfeits allow diseases to progress; toxic counterfeits cause direct injury. The financial harm to legitimate manufacturers is also substantial: lost revenue, brand damage, and the cost of fighting counterfeit infiltration in their distribution networks.
Blockchain technology addresses this trust problem by creating a shared, immutable record of every transaction in a product’s journey from API synthesis to patient dispensing. Every participant in the network writes their transactions to the ledger. Once written, records cannot be altered. The full chain of custody is visible to all authorized participants simultaneously, creating a single verifiable truth rather than a collection of individual claims.
The pharmaceutical industry has moved beyond theoretical discussion of blockchain to operational deployment. The MediLedger Project, a consortium that includes Pfizer and other major pharmaceutical companies, uses blockchain to verify the authenticity of saleable drug returns, meeting a specific requirement of the DSCSA [14]. The network creates a verifiable record that a returned product is what it purports to be, solving a problem that previously required manual processes and telephone verification between trading partners.
The regulatory compliance value of blockchain is significant on its own terms. Both the DSCSA and the European FMD mandate end-to-end traceability, and blockchain provides an automated, tamper-evident audit trail that satisfies these requirements without the overhead of manual documentation [10]. ‘Smart contracts,’ which execute automatically when pre-defined conditions are met, can further automate compliance: a logistics contract might include a smart contract that releases payment automatically when temperature monitoring data confirms an acceptable cold chain throughout the shipment, eliminating invoicing delays and disputes [15].
The sustainability value of blockchain is emerging as an additional driver. Supply chain transparency, verified by blockchain records, allows pharmaceutical companies to document and publish the environmental footprint of their products with confidence and to certify that raw materials were sourced according to ethical standards, preventing the ‘greenwashing’ that plagues self-reported sustainability claims [16].
For pharmaceutical procurement teams, the practical question is not whether blockchain will be part of the pharmaceutical supply chain architecture, but how quickly to build capability and which use cases to prioritize first. DSCSA compliance and counterfeit detection are the most mature use cases with the clearest ROI; they should be the starting point.
The Integrated Digital Ecosystem: Why Tools Only Work Together
The important insight about digital procurement tools is not what each one does individually but what they accomplish when they work together. The value of an e-procurement platform compounds when it feeds clean data to an AI forecasting engine. The value of better demand signals compounds when those signals are shared across the supply chain via a blockchain network, giving suppliers visibility into actual consumption patterns rather than the distorted signals that pass through multiple layers of ordering systems.
The ‘bullwhip effect,’ where small fluctuations in consumer demand are amplified into large swings in manufacturing orders as information passes through a multi-tier supply chain, is a well-documented driver of inventory waste and cost. It persists because each tier of the supply chain makes ordering decisions based on the orders it receives from the next tier, rather than on actual end-market demand. When a blockchain network gives all participants real-time visibility into actual consumption data, the bullwhip effect weakens significantly, reducing inventory variance and cost throughout the chain [17].
Similarly, the performance data captured in an e-procurement platform, supplier delivery reliability, quality acceptance rates, pricing compliance against contract, becomes the input for a strategic supplier management platform that enables evidence-based supplier development conversations. Instead of subjective discussions about supplier performance, procurement teams can walk into reviews with objective metrics that identify specific improvement opportunities and track progress against agreed targets [18].
The sequencing of digital investment therefore matters as much as the investment itself. Organizations that deploy AI forecasting before they have clean data will waste their AI investment. Organizations that build blockchain traceability networks before they have internal systems that can write to the ledger will struggle to demonstrate value. The right order is: data foundation first, then analytics, then collaborative network tools that share the analytical outputs with supply chain partners. This sequence is not a limitation; it is the logic of compounding value creation.
Part V: The Human Dimension — Strategic Supplier Relationships
Why Supplier Relationship Management Is a Financial Strategy, Not a Soft Skill
Technology is the infrastructure of modern procurement. The value that technology delivers still depends on the quality of the relationships through which it operates. An AI-powered demand forecast that is shared with a supplier through a transparent data-sharing arrangement creates more value than the same forecast kept internal, because the supplier can plan production more efficiently and pass the savings back through lower pricing or improved service.
This is the core argument for Strategic Supplier Relationship Management (SRM): supplier relationships are not just operational necessities, they are financial assets that can be cultivated to generate measurable returns. The question is not whether to manage supplier relationships but how systematically to do it and with which suppliers.
Eric Espinasse, the CPO of Ferring Pharmaceuticals, framed the unique challenge of pharmaceutical supplier relationships with precision: ‘In the pharmaceutical world, it is very difficult and effort-consuming to change the supplier base of raw materials, meaning that supplier relationships are paramount’ [19]. The supplier qualification process in regulated pharmaceutical manufacturing is not a commercial formality; it is an expensive, time-consuming, regulatory-intensive exercise that creates strong economic incentives to make existing relationships work rather than switch to new ones. The cost of that switching creates an asymmetry of negotiating power that a purely adversarial procurement approach will eventually exploit in the wrong direction.
A more productive framing is to recognize that both parties, buyer and supplier, have strong incentives to make a long-term relationship work well. The buyer needs a reliable, high-quality supply at a cost it can manage. The supplier needs a predictable demand signal, clear performance expectations, and a relationship stable enough to justify investment in capacity and improvement. When both parties understand and act on these shared interests, the relationship generates more value than either could extract through adversarial negotiation.
Supplier Segmentation: Allocating Strategic Attention Where It Creates Most Value
The practical challenge of SRM is resource allocation. A global pharmaceutical company may have thousands of suppliers across its direct and indirect spend categories. It cannot manage all of them with the same level of strategic engagement; that would consume more resources than the engagement could possibly generate in return.
Supplier segmentation solves this problem by creating a structured framework for allocating procurement attention. The standard segmentation model classifies suppliers along two dimensions: strategic importance (a composite of supply criticality, innovation potential, and risk concentration) and commercial leverage (spend volume and substitutability).
The resulting matrix typically identifies four categories:
Strategic suppliers: high importance, high interdependence, where joint value creation and deep collaboration generate returns beyond what any amount of price negotiation could achieve. These suppliers receive dedicated relationship management, executive engagement, and investment in joint improvement programs.
Preferred suppliers: solid performance, meaningful spend, where consistent performance management and volume consolidation create value. Regular reviews, clear performance targets, and preferred status in new business decisions are the appropriate management tools for this tier.
Transactional suppliers: commoditized categories where the primary driver is price and where automation of the procurement process, through catalogs and automated ordering, is the most efficient management approach.
Problematic suppliers: underperforming on quality, delivery, or compliance, requiring structured improvement programs or active replacement planning.
Gartner’s research on SRM best practices identifies a critical evolution in how organizations measure supplier performance at the strategic tier. Traditional supplier scorecards focus on operational metrics: on-time delivery, quality acceptance rate, pricing compliance. These metrics are necessary but insufficient. Best-in-class organizations augment them with value-driven metrics that assess suppliers’ contribution to broader organizational priorities: collaborative innovation, supply chain resilience, environmental performance, and total cost improvement [18].
The ‘voice-of-the-supplier’ dimension of SRM is frequently overlooked and strategically important. Organizations that solicit structured feedback from their strategic suppliers on the ease of doing business, the clarity of their requirements, and the predictability of their demand signals often discover that their own internal processes are creating cost and inefficiency for their suppliers. Since suppliers recover those costs through pricing, fixing internal process problems often generates savings more quickly than negotiating harder on unit price.
Value-Based Procurement: Redefining What ‘Best Price’ Means
Value-Based Procurement (VBP) is the philosophical counterpart to SRM’s operational framework. Where SRM asks ‘How do we manage our key supplier relationships?’, VBP asks a more fundamental question: ‘What are we actually trying to achieve with this procurement decision?’
The traditional answer to that question, ‘the lowest possible price for acceptable quality,’ is too narrow to capture the full range of costs and outcomes that a procurement decision affects. VBP replaces it with a broader answer: ‘The best total value for the patient and the organization, at a sustainable cost.’
In practice, VBP changes the decision-making framework in several important ways. A purely price-focused evaluation might select a cheaper diagnostic reagent. A VBP evaluation would also factor in the reagent’s precision, the implications of false positive or false negative results for patient treatment decisions and downstream costs, the supplier’s technical support capability, and the total cost of running the test including technician time and equipment consumables [20].
A diagnostic reagent that costs 15% less per unit but generates twice the rate of ambiguous results requiring repeat testing might cost significantly more on a per-reliable-result basis. VBP makes that calculation visible and makes it determinative.
Implementing VBP requires breaking down the organizational silos that allow procurement to make decisions in isolation from the clinical, operational, and quality teams that live with the consequences of those decisions. A cross-functional team that includes a procurement analyst, a clinical user, a quality assurance specialist, and a finance partner, evaluating a procurement decision against a weighted scorecard of total value criteria, will consistently make better decisions than a procurement-only team optimizing for unit price. The investment in cross-functional coordination generates returns in better procurement outcomes; those returns are measurable in reduced total cost, fewer quality problems, and improved operational performance.
Strategic Sourcing in Action: The Midwinter Solutions Case Study
The most powerful illustration of strategic sourcing’s potential is a case where the conventional procurement path was set aside in favor of a more creative and financially superior alternative.
Clinical trial supply procurement is one of the most complex and cost-intensive procurement challenges in the pharmaceutical industry. Comparator drugs, which are required in randomized controlled trials to provide the standard-of-care treatment against which an investigational drug is compared, are often expensive, sometimes scarce, and subject to complex regulatory requirements that vary by trial site location.
In a documented case study, a pharmaceutical sponsor needed to procure a high-cost oncology comparator drug for a large global Phase III trial. The conventional approach was to source the drug domestically in the United States for U.S. trial sites, an approach that presented two problems: the U.S. price was extremely high, and accessing the drug through domestic channels required a level of trial disclosure that the sponsor was not ready to make.
Midwinter Solutions, the clinical trial supply specialist engaged to solve this problem, took a different approach. Rather than accepting the domestic sourcing constraint as fixed, the team conducted a global market analysis and identified that the identical drug was available in the European Union at a significantly lower price [21]. The strategic insight was to use this EU-sourced supply for all global trial sites, including U.S. sites, rather than managing separate regional supply chains.
Executing this strategy required navigating FDA regulatory requirements for using foreign-sourced drug products in U.S. clinical trials. The team prepared and submitted the necessary documentation demonstrating manufacturing equivalency between the EU-sourced product and the U.S. equivalent, and secured FDA approval for the approach.
The result was a 65% reduction in comparator drug spend for U.S. trial sites, a simplified global supply chain drawing from a single source, and the preservation of trial confidentiality [21]. The savings alone were transformative on the trial’s budget. The simplification of the supply chain, from two regional supply chains to one, reduced operational complexity and associated management overhead. The confidentiality preservation removed a significant commercial risk.
This case illustrates what distinguishes strategic sourcing from purchasing: it starts with the desired outcome and works backward to find the best sourcing solution, rather than starting with the conventional sourcing solution and negotiating on price. The 65% savings came not from negotiating harder with domestic suppliers but from identifying a fundamentally better supply option that conventional procurement assumptions had ruled out before the analysis even began.
Supply Chain Resilience: Learning From Cross-Industry Leaders
The pharmaceutical industry does not have a monopoly on supply chain resilience strategy. General Mills’ documented approach to geographic supplier diversification, deliberately building redundant supply from multiple regions to reduce the risk of quality problems or supply interruptions concentrated in a single location, offers a directly applicable lesson for pharmaceutical procurement teams managing API and raw material supply [22].
The pharmaceutical version of this strategy involves qualifying multiple suppliers for critical APIs and raw materials, distributing that supply across geographic regions to reduce correlation risk (a disruption affecting one region should not automatically affect supply from another), and maintaining qualification of alternative suppliers even when they are not actively receiving purchase orders. The carrying cost of maintaining that qualification is insurance against a disruption that could otherwise shut down production or force patients to switch therapies.
Johnson & Johnson’s CPO Shashi Mandapaty, who oversees approximately $30 billion in annual procurement spend, has articulated the procurement function’s mandate in terms that capture the evolution from cost center to strategic function: driving ‘sustainable and innovative healthcare solutions’ is the stated purpose of the procurement organization, not just executing cost targets [23]. That framing reflects an organization that understands the strategic nature of its supplier base and manages it accordingly.
Part VI: The CPO’s Transformation Roadmap
The Business Case for Transformation
The evidence assembled in this article points to a single conclusion: the gap between what pharmaceutical procurement currently costs and what it could cost, if managed strategically and with modern tools, is large enough to materially affect organizational financial performance. The $900 million in shortage management labor, the $10.3 billion in global stock loss, the 68.6% markup cascade, the medication errors, and the care disruptions are not inevitable features of the pharmaceutical supply chain. They are consequences of underinvestment in procurement capability, and they are addressable.
The business case for transformation does not require extraordinary assumptions. It requires applying documented savings rates from comparable companies to the actual cost base of the organization. If Pfizer achieved a 30% reduction in procurement cycle times and Roche achieved 50%, and if McKinsey’s estimate of 25% savings on total procurement spend from digitization is even half right, the value at stake in most large pharmaceutical procurement organizations runs to hundreds of millions of dollars annually.
That value does not materialize from a single initiative. It accumulates through a phased transformation that builds capability systematically, with each phase creating the foundation for the next. The roadmap below maps that progression in practical terms.
Phase 1: Establish Visibility and Control (Months 0 Through 6)
The first objective of any procurement transformation is to see the full picture. You cannot reduce costs you cannot measure, and you cannot measure costs that are not captured in a central system.
The cornerstone of Phase 1 is the implementation of a unified e-procurement platform that consolidates spend data from across the organization into a single, accessible repository [12]. This platform becomes the single source of truth for all procurement activity: who is buying what, from whom, at what price, against what contract. For organizations currently operating on fragmented systems or manual processes, this is a significant undertaking, but it is the necessary prerequisite for everything that follows.
Alongside platform implementation, Phase 1 should include a comprehensive spend analysis that uses the newly consolidated data to map the organization’s full spend landscape. This analysis will identify: categories with significant maverick spending; suppliers where the organization is fragmented across multiple business units without capturing the available volume leverage; contracts that are auto-renewing without market testing; and categories where the total cost, once properly calculated, is significantly higher than the purchase price suggests.
The immediate financial return from Phase 1 comes from clamping down on maverick spending, consolidating volumes with preferred suppliers to activate contracted rates, and identifying and renegotiating the most obviously suboptimal contracts. These gains typically pay for the platform investment within the first year.
The strategic return from Phase 1, which takes longer to materialize but is ultimately more valuable, is the data foundation that makes every subsequent phase possible.
Phase 2: Strategic Sourcing and Partnership Development (Months 6 Through 18)
With a data foundation in place, Phase 2 shifts the procurement function’s focus from visibility to strategy. The work of this phase is to build the supplier relationships and sourcing approaches that deliver value beyond what price negotiation alone can achieve.
The starting point is formal supplier segmentation: using the spend and performance data from Phase 1 to classify the entire supply base and identify the suppliers that warrant strategic partnership investment versus those that should be managed transactionally [18]. This segmentation determines where SRM resources are deployed and what form of engagement each supplier relationship receives.
For the strategic tier, Phase 2 involves launching formal joint business planning processes: structured conversations with strategic suppliers about shared objectives, collaborative improvement opportunities, and metrics that reflect total value rather than just operational compliance. These conversations require procurement teams with strong relationship management skills and the organizational authority to make commitments that bind the business. They also require cross-functional involvement; meaningful conversations about innovation, quality improvement, and supply chain resilience require input from R&D, manufacturing, and quality as well as procurement.
Pilot programs in Value-Based Procurement, applied to two or three key categories where the gap between purchase price and total value is most pronounced, build the organizational capability and evidence base for wider VBP adoption. These pilots should be designed to generate documented financial outcomes that can justify the organizational investment in cross-functional procurement processes.
The target state at the end of Phase 2 is a procurement organization that has shifted its primary value proposition from ‘we negotiate low prices’ to ‘we build supplier partnerships that deliver total value.’ That shift takes time, requires cultural change, and depends on executive sponsorship. It also generates measurably better financial outcomes than the alternative.
Phase 3: Predictive Optimization and Ecosystem Leadership (Month 18 and Beyond)
Phase 3 deploys the advanced digital tools that create predictive, rather than reactive, supply chain management. The data foundation from Phase 1 and the supplier relationships from Phase 2 are the prerequisites for Phase 3 to succeed.
AI-powered demand forecasting, deployed using the clean and comprehensive data from the e-procurement platform, generates the more accurate demand signals that reduce both overstock and stockout costs [13]. The financial impact of this improvement can be projected using the actual cost rates from Phase 1’s spend analysis: if the organization carries $500 million in inventory at a 20% annual carrying cost, a 10% reduction in average inventory driven by better forecasting saves $10 million per year. If it experiences $50 million per year in emergency purchase premium spend driven by stockouts, reducing emergency purchases by 30% through better forecasting saves an additional $15 million.
For high-risk supply chains, including those for high-cost specialty drugs, temperature-sensitive biologics, or products destined for markets with significant counterfeit risk, Phase 3 includes engagement with blockchain traceability consortia. The MediLedger Project provides an established network entry point for U.S. pharmaceutical manufacturers [14]; similar initiatives exist in Europe and Asia. Participation in these networks not only addresses regulatory compliance requirements but also provides the supply chain visibility that allows earlier detection of supply disruptions and more targeted, efficient response when quality or authenticity issues arise.
The ambition of Phase 3 is not just to optimize the organization’s own procurement operations but to extend optimization across the supply network. When an organization shares accurate demand signals with its strategic suppliers through a transparent data platform, and when those suppliers can see actual consumption data rather than the distorted demand signals that flow through traditional order systems, inventory efficiency improves at every level of the supply chain. The financial benefits of that system-wide improvement accrue to every participant, including the buying organization through lower supplier costs and better service.
The CPO as Transformation Architect
The transformation described in this roadmap does not succeed as a procurement department initiative. It requires the CPO to operate as a strategic leader at the executive level, securing the investment, the cross-functional collaboration, and the organizational change management that the transformation demands.
The capabilities this requires from the CPO are more diverse than the traditional procurement leadership profile. As a technologist, the CPO must understand the digital architecture of modern procurement and make credible business cases for platform investments that require significant upfront cost and deliver returns over a multi-year horizon. As a diplomat, the CPO must break down the organizational silos, particularly between procurement, R&D, clinical, and quality, that prevent value-based procurement from operating effectively. As a strategist, the CPO must build the bimodal procurement organization that can simultaneously manage strategic innovation partnerships for on-patent assets and run aggressive, data-driven sourcing events for off-patent commodities. As a change agent, the CPO must lead a cultural shift that moves the procurement organization’s self-image from ‘cost center that saves money on purchases’ to ‘value center that manages total cost and builds strategic supply capability.’
The CPOs who have most successfully navigated this transformation, including Mandapaty at Johnson & Johnson and Webber at Merck [23], have common characteristics: they operate at the executive table rather than as functional managers, they speak the language of business strategy rather than procurement process, and they measure their function’s value in terms of business outcomes rather than purchasing metrics. Those characteristics are not accidents of personal style; they are deliberate choices about how the CPO role should be defined and exercised.
Part VII: The Information Advantage — Patent Intelligence as a Procurement Tool
Why Patent Timelines Are Procurement Intelligence
There is a category of information that is publicly available, financially significant, and routinely underused by pharmaceutical procurement teams: pharmaceutical patent expiration data.
Patent timelines determine when generic and biosimilar competition enters a market. They determine how long a manufacturer can sustain premium pricing and how quickly prices will fall when exclusivity ends. For procurement organizations on the buy side, whether hospital systems, pharmacy benefit managers, insurers, or generic manufacturers, understanding patent timelines is not just useful background information. It is the core intelligence that determines when to lock in long-term contracts at current prices versus waiting for generic entry to drive prices down, when to begin supplier qualification for generic alternatives to an on-patent drug, and when to accelerate formulary switching to capture the savings from generic competition.
DrugPatentWatch provides exactly this type of intelligence: a comprehensive database of pharmaceutical patents, exclusivity periods, regulatory filing timelines, and competitive intelligence on generic and biosimilar market entry. For procurement professionals managing drug spend across a complex formulary, this data enables the same kind of forward-looking planning that institutional investors use to manage equity portfolios around corporate events. Patent expiration is a predictable event with predictable financial consequences; the organizations that plan for it in advance capture far more of the available savings than those that react to it after the fact.
The practical use case is direct. If a procurement team knows that a major drug currently costing $50,000 per course of treatment will face its first generic competition in 18 months, it can make a deliberate choice about how to structure current contracting. A short-term contract at current pricing preserves flexibility to capture generic discounts quickly. A long-term commitment with price protection might be appropriate if supply continuity risk for the generic alternatives is high. A hybrid approach, with a partial volume commitment on the branded drug and a parallel generic supplier qualification process, might be optimal for a high-volume product where transition planning is complex.
None of these decisions can be made well without the patent intelligence that defines the timeline. With it, procurement teams can build financial models that compare the expected costs of different contracting strategies over a two-to-five-year horizon, making the choice between them a data-driven decision rather than a guess.
From Patent Data to Supplier Qualification Planning
The time required to qualify a new supplier in the pharmaceutical industry is substantial. For a GMP-regulated API supplier, the qualification process typically involves an initial assessment of the supplier’s quality management system, an on-site audit, analytical testing of sample batches, and potentially a regulatory filing if the new supplier must be added to an approved drug application. Depending on the complexity of the product and the regulatory pathway, this process can take anywhere from six months to several years.
This qualification timeline creates a direct strategic requirement: if procurement teams want to have qualified generic or biosimilar suppliers ready at the moment of patent expiration, they must begin the qualification process well in advance. The practical lead time is typically 12 to 24 months for a simple generic API and potentially longer for complex biologic materials.
This is where patent intelligence from platforms like DrugPatentWatch becomes a procurement planning tool rather than just a reference resource. By tracking patent expiration schedules and mapping them against the supplier qualification timelines for their current supply base, procurement teams can build a forward calendar of qualification initiatives that ensures they are ready to move when market opportunities open.
The financial value of being ready on day one of generic availability, rather than 12 months later while a qualification process completes, is substantial. If a drug currently costs $10 million per year on the formulary and generic competition drives the price down by 70%, every month of delay in transitioning to generic supply costs approximately $583,000 in avoidable brand spend. For a hospital system or insurer managing a formulary of hundreds of drugs, the cumulative value of systematic patent-expiration planning, versus reactive purchasing, can reach tens of millions of dollars annually.
Part VIII: Building the Evidence for Investment
Quantifying the ROI of Procurement Transformation
One of the persistent challenges in securing executive support for procurement transformation is the difficulty of quantifying the expected return on investment with the precision that finance teams require. The hidden costs described in this article are real and large, but they are dispersed across the organization’s cost structure in ways that make attribution difficult.
The most effective approach to building a financial case for procurement transformation is to work from the bottom up: start with specific, quantifiable cost categories; apply documented improvement rates from comparable cases; and project the total value at stake against the investment required.
For a mid-sized pharmaceutical company with $1 billion in total procurement spend, the analysis might look like this. Inventory carrying costs, assuming $200 million in average inventory and a 20% annual carrying rate, total $40 million per year. A 10% reduction in average inventory driven by better forecasting saves $4 million. Emergency purchase premium, if the organization spends 5% of its procurement budget on spot purchases at a 30% premium over contract price, totals $15 million annually; reducing emergency purchasing by half saves $7.5 million. Maverick spending, if 25% of indirect spend is outside contract, represents $50 million in unmanaged spend; consolidating half of it to contract prices at an average discount of 15% saves $3.75 million. E-procurement automation, reducing manual processing time by 60%, saves the equivalent of multiple full-time procurement and finance staff, representing $2 to $3 million in annual labor cost.
These four categories alone, conservatively estimated, represent $17 to $18 million in annual savings against a baseline of $1 billion in spend. At a 2% savings rate on total spend, the return on investment from a multi-year platform implementation and capability-building program is typically achieved within two to three years.
The harder-to-quantify but potentially larger value comes from the avoided costs of quality failures, supply chain disruptions, and medication errors. If a single major supply disruption costs the organization $20 to $50 million in emergency supply, overtime, regulatory response, and customer impact, and if better supply chain resilience reduces the probability of such a disruption from once every three years to once every seven years, the expected annual savings from that risk reduction alone is $7 to $24 million.
Measurement Frameworks for Procurement Performance
The transformation of pharmaceutical procurement from a cost center to a value creator requires a measurement framework that reflects the full scope of value the function delivers. A framework limited to ‘savings versus last year’s price’ will systematically undervalue strategic procurement and create incentives for short-term price negotiation over long-term value creation.
A comprehensive procurement performance dashboard should include:
Total Cost of Ownership metrics: not just unit price but the full cost of supply including logistics, carrying costs, quality rejection rates, emergency purchases, and supplier switching costs. These metrics tell the story of what procurement actually costs, rather than what purchase orders say it costs.
Supply continuity metrics: the frequency and duration of supply disruptions, the percentage of demand met from first-choice suppliers, and the financial impact of shortages on downstream operations. These metrics connect procurement performance to clinical and operational outcomes.
Supplier performance metrics: on-time delivery, quality acceptance rates, pricing compliance against contract, responsiveness to issues, and collaborative innovation contributions. These metrics provide the objective foundation for supplier development conversations.
Process efficiency metrics: cycle time from need identification to purchase order, invoice processing time and error rate, percentage of spend under contract, and maverick spending rate. These metrics track the operational health of the procurement process itself.
Strategic value metrics: the contribution of strategic supplier relationships to innovation pipeline, the savings delivered through proactive patent-expiration planning, and the avoided costs of supply chain disruptions prevented by resilience investments. These metrics capture the value that is hardest to see but largest in magnitude.
A procurement function that can report across all of these dimensions is in a position to demonstrate its full contribution to organizational value, and to make a credible case for continued investment in the capability-building that makes that contribution possible.
Key Takeaways
The financial case for transforming pharmaceutical procurement from a price-focused function to a total-cost-of-ownership discipline is not close. The hidden costs are large, documented, and addressable. Here is what this analysis establishes:
The visible purchase price captures a minority of total procurement cost. Process inefficiencies, inventory waste, logistics markups, quality failures, and regulatory overhead collectively dwarf the savings available from price negotiation alone. Organizations that optimize only what appears on the purchase order are managing the wrong number.
Drug shortage management alone costs U.S. hospitals nearly $900 million per year in labor. This figure has more than doubled since 2019. It does not appear in procurement budgets. It is a direct consequence of upstream supply chain failures that strategic procurement can prevent.
Seven percent of pharmaceutical stock is lost globally, valued at $10.3 billion. This is not a quality problem or a logistics problem in isolation. It is the cumulative consequence of inadequate demand forecasting, insufficient inventory management, and poor supply chain visibility. All three are addressable through the tools and approaches described in this article.
The markup cascade adds an average of 68.6% to manufacturer prices by the time drugs reach patients. Strategic procurement teams that understand and actively manage distribution architecture, sourcing geography, and supply chain tier structure can reduce this markup significantly.
Digital transformation generates documented, not theoretical, returns. Pfizer cut procurement cycle times by 30%. Roche cut them by 50%. McKinsey estimates 25% savings on total procurement spend from full digitization. These outcomes are achievable by any organization willing to invest in the phased capability-building they require.
Patent intelligence is an underused procurement tool. Systematic tracking of patent expiration schedules, and proactive supplier qualification planning aligned to those schedules, can generate tens of millions of dollars in savings annually for large formulary managers. DrugPatentWatch provides exactly the intelligence needed to execute this approach.
The transformation requires C-suite leadership, not departmental initiative. The CPO who can articulate procurement’s value in terms of clinical outcomes, patient safety, enterprise risk, and total financial performance, not just unit price savings, will secure the investment and the cross-functional collaboration that a genuine transformation requires. The CPO who cannot will remain confined to a cost center role that captures a fraction of the available value.
FAQ
Q1: What is the single largest hidden cost in pharmaceutical procurement, and why does it rarely appear in procurement reports?
The single largest hidden cost is not a single line item but a cascade of supply disruption consequences, anchored by the $900 million in annual labor costs that U.S. hospitals spend managing drug shortages. This cost is invisible in procurement reports because it accrues in clinical operations and pharmacy labor budgets, not in procurement cost centers. Procurement teams report savings on purchase prices; nobody formally reports the organizational cost generated when supply continuity fails. Until organizations build cross-functional cost tracking that connects procurement sourcing decisions to downstream clinical and operational outcomes, this cost will remain invisible to the people best positioned to prevent it.
Q2: How does a patent expiration date translate into a procurement action?
When a major drug approaches its patent expiration date, three procurement actions become relevant in sequence. First, 12 to 24 months before expiration, begin qualifying alternative suppliers for the generic or biosimilar versions expected to enter the market. Supplier qualification in regulated pharmaceutical manufacturing takes time; starting early means being ready to switch on day one of generic availability rather than months later. Second, evaluate current contracting strategy for the branded product: a short-term contract or flexible purchasing arrangement preserves the ability to transition quickly to generic pricing once it is available. Third, at the moment of generic market entry, execute a competitive sourcing event among qualified generic suppliers to capture the price reduction that competition creates. This planned approach, enabled by patent intelligence from platforms like DrugPatentWatch, consistently captures more savings and creates less supply disruption than reactive purchasing.
Q3: Is blockchain technology practical for mid-sized pharmaceutical companies, or is it only viable for large enterprises?
Blockchain is most efficiently implemented through industry consortia rather than proprietary networks built by individual companies. The MediLedger Project in the United States includes companies of various sizes and provides a shared network that individual participants can access without building and maintaining the full infrastructure themselves. For mid-sized companies, joining an established consortium is significantly more cost-effective than building a proprietary blockchain and provides access to a network of supply chain partners who are already participating. The compliance benefit, specifically meeting DSCSA traceability requirements, is available to any size of organization through consortium membership. The decision is therefore less about scale than about identifying the right consortium for the products and markets the company operates in.
Q4: How do you make the financial case for supply chain resilience investments to a CFO focused on quarterly results?
The most effective framing is expected value, not worst-case scenario. Calculate the probability and financial impact of a significant supply disruption based on the organization’s historical experience or industry data, then present the annual expected cost of disruption (probability times impact) as the baseline risk being managed. A supply chain resilience investment that costs $5 million annually but reduces the expected cost of disruption from $15 million to $5 million per year is a clearly positive NPV investment. Add to this the secondary financial benefits of resilience investments, including reduced emergency purchase spend, lower safety stock requirements from better supply predictability, and avoided shortage management labor, and the business case typically becomes compelling. The CFO concern about quarterly results is addressed by phasing the investment to front-load the quick-win cost reductions that pay for the broader transformation program.
Q5: What is the most common mistake organizations make when implementing e-procurement platforms?
The most common mistake is treating platform implementation as an IT project rather than a business transformation. Organizations that focus on technical deployment without simultaneously redesigning the processes the platform will automate, training the users who will operate it, and enforcing the behavioral changes required to drive spend through the platform rather than around it consistently see adoption rates that are too low to generate the projected financial returns. The platform itself is the easy part; the change management required to make the organization actually use it is where most implementations struggle. Best-practice implementations designate executive sponsors who are accountable for adoption metrics, not just technical go-live, and design financial incentives for departments that drive spend through the platform and consequences for those that continue to bypass it through maverick purchasing.
[2] KissFlow Procurement Cloud. (n.d.). The key differences between direct and indirect procurement. SDC Executive. https://www.sdcexec.com/sourcing-procurement/erp/article/21563345/kissflow-procurement-cloud-the-key-differences-between-direct-and-indirect-procurement
[3] Vizient. (2025). New Vizient survey finds drug shortages cost hospitals nearly $900 million annually in labor expenses. Vizient Newsroom. https://www.vizientinc.com/newsroom/news-releases/2025/new-vizient-survey-finds-drug-shortages-cost-hospitals-nearly-900m-annually-in-labor-expenses
[4] Airpals. (2025). Pharma logistics in 2025: Trends, challenges, and solutions. Airpals Blog. https://airpals.co/blog/pharma-logistics-cost-optimization
[5] World Health Organization. (2003). The hidden costs of essential medicines. WHO Essential Drugs and Medicines Policy. https://www.rhsupplies.org/uploads/tx_rhscpublications/WHO_EDM33_Hidden%20costs_2003.pdf
[6] DrugPatentWatch. (2025). Real world blockchain uses in the pharmaceutical industry. DrugPatentWatch Blog. https://www.drugpatentwatch.com/blog/real-world-blockchain-uses-in-the-pharmaceutical-industry/
[7] DrugPatentWatch. (2025). The impact of patent expiry on drug prices: A systematic literature review. DrugPatentWatch Blog. https://www.drugpatentwatch.com/blog/the-impact-of-patent-expiry-on-drug-prices-a-systematic-literature-review/
[8] Bailey Walsh. (n.d.). The impact of patent cliff on the pharmaceutical industry. Bailey Walsh News. https://bailey-walsh.com/news/patent-cliff-impact-on-pharmaceutical-industry/
[9] Accelerate Procurement. (2024). Procurement in pharma: What are the major challenges in 2024? AccelerateProcurement.com. https://accelerateprocurement.com/procurement-in-pharma-what-are-the-major-challenges-in-2024/
[10] Supply Chain Dive. (2024). 3 things to expect from the pharmaceutical supply chain in 2024. SupplyChainDive. https://www.supplychaindive.com/news/3-things-to-expect-from-the-pharmaceutical-supply-chain-in-2024/705776/
[11] McKesson. (n.d.). Supply chain advancements are meeting the moment and beyond. McKesson Stories & Insights. https://www.mckesson.com/stories-insights/supply-chain-advancements-are-meeting-the-moment-and-beyond/
[12] Factwise. (n.d.). Digital tools driving procurement in the pharmaceutical industry. Factwise Blog. https://factwise.io/blog/post/digital-tools-driving-procurement-in-the-pharmaceutical-industry
[13] PlanetTogether. (n.d.). The impact of AI-enabled demand forecasting models in pharmaceutical manufacturing. PlanetTogether APS Trends. https://www.planettogether.com/aps-trends/the-impact-of-ai-enabled-demand-forecasting-models-in-pharmaceutical-manufacturing
[14] John Cabot University. (n.d.). Blockchain technology and supply chain transformation in the pharmaceutical industry. JCU Repository. https://archive.johncabot.edu/bitstreams/04b2aac0-4016-4a1c-b70b-9d3e8223e59f/download
[15] AIMultiple Research. (2025). Top 20 blockchain in supply chain case studies in 2025. AIMultiple. https://research.aimultiple.com/blockchain-in-supply-chain-case-study/
[16] PharmaTrace. (n.d.). How blockchain can help pharma companies build more sustainable supply chains. PharmaTrace Blog. https://www.pharmatrace.io/post/how-blockchain-can-help-pharma-companies-build-more-sustainable-supply-chains
[17] Innoplexus. (n.d.). Five use cases for blockchain in pharma. Innoplexus News. https://www.innoplexus.com/news/five-use-cases-for-blockchain-in-pharma-pharmaphorum
[19] Procurement Leaders. (n.d.). Eric Espinasse interview: ‘The more we depend on a supplier, the closer we need to be to them.’ Procurement Leaders Content. https://procurementleaders.com/content/interview-ferring-inflation-supplier-relationships-srm/
[20] Greiner Bio-One. (n.d.). What is value-based procurement? GBO Safety Blog. https://www.gbo.com/en-int/podcast-blog/blog/article/what-is-value-based-procurement-vbp
[21] Midwinter Solutions. (n.d.). Case study: Optimizing global sourcing for a clinical trial. Midwinter Solutions. https://midwinter-solutions.com/optimizing-global-sourcing
[23] Procurement Magazine. (n.d.). Top 10: CPOs in healthcare and pharmaceuticals. Procurement Magazine. https://procurementmag.com/top10/top-10-cpos-in-healthcare