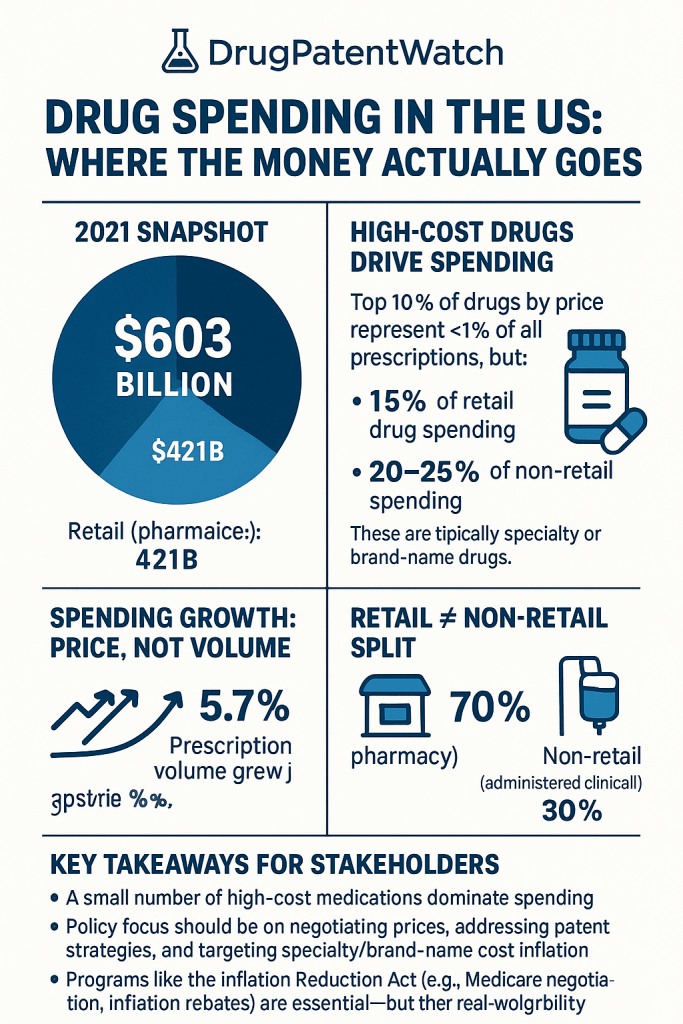
The United States spent $603 billion on prescription drugs in 2021 before rebates, $421 billion at retail and $182 billion in clinical settings. That number is not primarily a story about Americans taking more pills. Prescription volume grew roughly 5.7% between 2016 and 2021. Spending grew 16%. The gap between those two figures is the story: a pricing system that extracts maximum revenue per prescription, fortified by patent portfolios, regulatory exclusivity stacking, and a distribution chain whose economics are deliberately opaque.
This pillar page deconstructs that system layer by layer. It covers the macroeconomic scale of the market, the molecular economics of brand versus generic, the IP architecture that keeps specialty biologics priced above $100,000 per patient-year, the distribution chain from Wholesale Acquisition Cost to the pharmacy shelf, the actual cost of drug development (not the industry’s preferred figure), and the post-Inflation Reduction Act policy environment that is, for the first time, inserting federal price leverage into Part D negotiations. Each section includes Key Takeaways for pharma/biotech IP teams and R&D leads, and Investment Strategy notes for institutional analysts.
1. The Scale of the Market: $600 Billion and What Drives It
1.1 Total Expenditures in Context
US prescription drug spending reached $603 billion in 2021. For reference, that exceeds the entire GDP of Sweden. The global prescription drug market is projected to reach $1.33 trillion by 2029, and the US will maintain its position as the largest single national market, likely accounting for 40-45% of global pharmaceutical revenue while representing under 5% of world population.
From 2010 to 2020, US pharmaceutical spending climbed from $322 billion to $570 billion, a 77% increase. Wage growth over the same period ran at roughly 30% in nominal terms. The divergence matters not just for affordability but for IP valuation: if spending growth consistently outpaces GDP and wage growth, the risk-adjusted NPV of a drug’s patent life is structurally higher in the US than anywhere else. That calculation is what makes US market exclusivity the single most valuable asset in global pharma.
The top 10% of drugs by price account for fewer than 1% of all prescriptions but generate 15% of retail spending and 20-25% of non-retail spending. This concentration is not accidental. It reflects a patent system and regulatory exclusivity regime that allows originator manufacturers to price without competitive constraint for the duration of their exclusivity window, which for a well-constructed biologic IP portfolio can extend 15 to 20 years beyond NDA approval.
1.2 Volume vs. Price: The Real Driver
In 2021, Americans filled over 8.7 billion prescriptions. That averages to more than 26 per person annually. Volume alone, at that scale, would generate substantial spending even at moderate per-unit prices. But the cost-per-prescription curve has outrun volume growth decisively.
Between 2016 and 2021, the cost per retail prescription increased approximately 9% in real terms while total retail volume increased around 7%. In non-retail settings, where specialty biologics administered by infusion or injection dominate, the per-unit cost trajectory is steeper. A single infusion of a monoclonal antibody for a condition like Crohn’s disease or relapsing multiple sclerosis can carry a list price of $20,000-$40,000 per dose. Non-retail non-retail drug expenditures grew 25.1% from 2016 to 2021 against retail’s 12.5%, a divergence that tracks directly to infusion-administered biologic uptake.
Key Takeaways: Section 1
The spending growth rate consistently outpacing prescription volume growth is a structural feature, not a temporary deviation. It persists because IP protection removes price competition from the highest-volume specialty categories.
Non-retail growth (25.1% in five years) signals where the next generation of high-cost therapeutics sits: infused or injected biologics administered in clinical settings, where billing complexity and physician buy-and-bill economics add additional margin layers above the WAC.
At $603 billion pretax and pre-rebate, US drug spending is large enough that a 1% shift in any major therapeutic category, oncology, immunology, CNS, represents roughly $6 billion in revenue at stake.
2. IP Valuation as the Core Asset: How Patent Portfolios Underpin Spending Concentration
2.1 The Patent as a Revenue Guarantee
A drug patent is not primarily a scientific document. It is a revenue guarantee with a defined term. Under 35 USC 156 and the Hatch-Waxman Act framework, an originator drug company can claim a base 20-year patent term from filing, extended by Patent Term Extension (PTE) or Supplemental Protection Certificates in international markets to compensate for FDA regulatory review time. For small molecules, effective market exclusivity after FDA approval typically runs 7-12 years. For biologics under the Biologics Price Competition and Innovation Act (BPCIA), the statutory exclusivity floor is 12 years from the reference product approval date, independent of patent term.
That difference in exclusivity architecture is the primary reason specialty drug spending has grown from 32% of total US drug spend in 2012 to roughly 51% by 2022. Small molecule patents erode through generic Paragraph IV challenges. Biologic exclusivity under the BPCIA is a separate statutory right that is far harder to circumvent, and biologic IP portfolios are typically constructed as thickets of dozens to hundreds of patents covering the molecule, formulation, manufacturing process, delivery device, and method of use.
2.2 Evergreening Tactics: The Technology Roadmap
Evergreening is the practice of filing secondary patents or obtaining additional regulatory exclusivities that extend effective market protection beyond the original compound patent. It is legal, common, and worth dissecting in detail because it explains why many brand drugs remain at high list prices years after their original composition-of-matter patents expire.
The main evergreening mechanisms, in rough order of frequency, are:
Formulation patents cover new dosage forms: extended-release tablets, film coatings, modified dissolution profiles, and transdermal delivery systems. An XR version of a small molecule can carry a new Orange Book-listed patent extending exclusivity 3-5 years beyond the immediate-release compound patent. The clinical value may be modest (reduced pill burden, slightly smoother pharmacokinetics), but the IP value is substantial.
Polymorph patents cover crystalline or amorphous forms of the active pharmaceutical ingredient. A manufacturer who files on a stable crystalline form used in commercial manufacturing can block generics that use that polymorph, even after the compound patent expires.
Method-of-use patents cover new indications, new patient subpopulations, or new dosing regimens. A drug approved for rheumatoid arthritis gains an Orange Book listing when the manufacturer files a method-of-use patent for psoriatic arthritis at a different dose. Paragraph IV filers must either design around all listed patents or face a 30-month stay of ANDA approval.
Pediatric exclusivity is a six-month exclusivity extension granted under the Best Pharmaceuticals for Children Act when a manufacturer conducts FDA-requested pediatric studies. This extension attaches to all Orange Book patents and can be worth billions in revenue for a blockbuster. Pfizer’s atorvastatin (Lipitor) earned its pediatric exclusivity extension that effectively delayed generic entry by six months in a market generating over $10 billion per year in US sales.
Device combination patents apply particularly to biologics and inhalables: auto-injectors, prefilled syringes, and inhaler devices carry their own patent protection. Humira’s (adalimumab) IP thicket included over 100 patents covering the molecule, formulation, manufacturing process, and delivery device. AbbVie’s settlement agreements with biosimilar manufacturers structured US market entry around these device and formulation patents, not the primary compound patents, which began expiring years earlier. The result was that US patients did not see biosimilar competition until January 2023, years after European patients.
2.3 The Humira IP Thicket: A Valuation Case Study
AbbVie’s adalimumab (Humira) is the canonical study in biologic IP portfolio construction. At its peak, Humira generated over $20 billion in annual global sales, with the US market contributing roughly $14-16 billion. The compound patent for adalimumab expired in 2016. AbbVie had filed approximately 136 additional patents covering formulation, manufacturing, and devices. These patents, listed in the Purple Book equivalent regulatory filings, formed the thicket that biosimilar entrants had to navigate.
AbbVie entered into settlement agreements with biosimilar manufacturers including Amgen, Samsung Bioepis, Sandoz, and others. The settlements structured US market entry dates between July 2023 and 2023, with European entry earlier. The financial impact of this delay is estimable: if US biosimilar entry in 2018 (when European competition began) had occurred, and biosimilar interchangeability designations from FDA had been in place, conservative modeling suggests AbbVie would have seen $30-50 billion less in US revenue over the 2018-2023 period than it actually collected.
For IP valuation purposes, this case illustrates that a biologic’s IP portfolio value is not simply the NPV of cash flows through compound patent expiry. It is the NPV of all cash flows achievable through the full thicket, accounting for the probability and timing of biosimilar entry. Analysts who fail to model the thicket undervalue the asset during the exclusivity window and underestimate the revenue cliff when the thicket ultimately collapses.
2.4 Small Molecule Paragraph IV Dynamics
For small molecules, the primary IP battle runs through Paragraph IV Abbreviated New Drug Application (ANDA) challenges. A generic manufacturer files a Paragraph IV certification stating that the Orange Book-listed patents are invalid, unenforceable, or will not be infringed by the proposed generic. The originator then has 45 days to file suit; doing so triggers a 30-month stay of FDA final approval for the generic.
The financial calculus for the first generic filer is well-established: a 180-day market exclusivity period during which the filer is the only approved generic competitor. In a large market, the 180-day exclusivity for a first-filer ANDA can be worth $500 million to over $2 billion, depending on the brand’s annual US sales. This creates intense competition to be the first filer, which in turn has created the specialized litigation economy around Hatch-Waxman challenges.
For originator IP teams, the question is not whether Paragraph IV challenges will come. They will. The question is whether secondary patents are defensible enough to win the litigation or force a settlement with a late entry date. The average district court win rate for originator defendants in Paragraph IV cases has historically run below 50%, which is why multi-patent thickets are strategically superior to single compound patent reliance.
Key Takeaways: Section 2
IP portfolio depth, measured in defensible Orange Book listings and BPCIA patent claims, is the primary determinant of effective market exclusivity duration, which is in turn the primary driver of the brand/generic spending split.
Biologic IP thickets are more durable than small molecule patent estates because biosimilar interchangeability designation requires additional clinical evidence from the biosimilar manufacturer, and because device/formulation patents are harder to design around than compound patents.
Evergreening is not an edge case. Among the 50 highest-revenue US drugs, the median gap between original compound patent filing and expected last-valid-patent expiry is approximately 12-15 years post-approval.
Investment Strategy: Section 2
Institutional investors assessing originator pharma should model IP portfolio depth, not just patent expiry dates. The relevant metric is the probability-weighted expected revenue through all plausible exclusivity scenarios, accounting for likelihood of Paragraph IV challenge, estimated litigation outcome, and biosimilar interchangeability timeline for biologics. A biologic with a 100-patent thicket and no granted biosimilar interchangeability designation in a $5 billion US market carries materially different risk than a small molecule with three Orange Book patents and a first Paragraph IV filer already in litigation.
3. Retail vs. Non-Retail Expenditures: Where the Money Flows by Channel
3.1 The Channel Split
Of the $603 billion spent in 2021, $421 billion (70%) moved through retail channels: independent pharmacies, chain pharmacies, mail-order pharmacies, and specialty pharmacies. The remaining $182 billion (30%) moved through non-retail channels: hospitals, clinics, physician offices, and home health care settings.
Non-retail spending grew at twice the rate of retail from 2016 to 2021 (25.1% vs. 12.5%). This divergence has a direct IP explanation. Biologics approved as Reference Listed Drugs under the PHS Act Section 351(a) are predominantly administered in clinical settings, where the physician buy-and-bill model applies. Under buy-and-bill, the physician or facility purchases the drug from the wholesaler, administers it, and bills the payer (typically Medicare Part B or commercial insurer) at Average Sales Price plus 6% or at a negotiated rate. The ASP+6% add-on under Part B has historically incentivized selection of higher-priced drugs, though CMS has introduced adjustments to reduce this incentive in certain drug classes.
3.2 Dispensing Channel Shifts: What the 2016-2021 Data Shows
The 2016-2021 period saw significant redistribution across dispensing channels. Mail-order pharmacy grew 35%. Clinic settings grew 45%. Home health care settings grew 95%. Those gains came at the expense of independent pharmacies (down 5%), long-term care facilities (down 17%), and federal facilities (down 9%).
The home health care surge (95% growth over five years) reflects two converging trends: the COVID-19 pandemic accelerating shift to home-based care, and payer pressure to move infusion-administered biologics out of hospital outpatient departments (HOPDs) into lower-cost home infusion settings. Several large commercial payers and PBMs now have site-of-care programs that redirect eligible patients from HOPD infusion to home infusion or ambulatory infusion centers, where the facility margin above drug cost is lower.
For manufacturers, the channel shift has contracting implications. A drug reimbursed under the hospital outpatient prospective payment system carries different margin dynamics than the same drug reimbursed under a specialty pharmacy benefit. Manufacturers with strong relationships with specialty pharmacy operators can capture market share in home infusion channels, while those reliant on HOPD volume face payer-driven erosion.
Key Takeaways: Section 3
Non-retail’s faster growth rate tracks biologic adoption, not generic volume, making it the channel to watch for specialty drug spending forecasts.
Home infusion’s 95% growth over five years is not just a channel preference shift. It is a payer-driven intervention to reduce site-of-care costs, and it will accelerate as payers institutionalize site-of-care programs through specialty pharmacy carve-outs.
4. Brand vs. Generic: The 80/20 Spending Split and Its Patent Mechanics
4.1 The Fundamental Asymmetry
Brand-name drugs represent approximately 20% of US prescriptions but account for 80% of prescription drug spending in both retail and non-retail settings. Generics account for 80% of prescriptions but only 20% of spending. On a per-prescription basis, the average brand costs roughly 16 times more than the average generic.
Generics contain the same active ingredient at the same strength, route, and dosage form as the reference listed drug and must demonstrate bioequivalence under FDA ANDA standards. The price differential is not a quality differential. It is an IP differential: once a molecule’s patents and exclusivities expire, multiple manufacturers compete, and prices compress rapidly.
4.2 The Generic Entry Curve
Price erosion after generic entry follows a well-documented curve. In the first 180-day exclusive generic period, the single generic typically prices at 80-90% of the brand WAC. With the second generic entrant, price falls to 50-60% of brand. By six to eight generic entrants, pricing typically reaches 20-30% of the brand reference price. Markets with more than 10 generic entrants often see commodity-level pricing at 5-15% of brand.
This curve means the brand/generic spending split is driven less by the existence of generics than by the pace of patient conversion from brand to generic after generic entry. Formulary tiering is the primary mechanism: most commercial plans and PBMs move generics to Tier 1 (lowest cost-sharing) and preferred brands to Tier 2 or 3 immediately after generic launch, which drives dispensing of generics to 80-90% of eligible prescriptions within 12-18 months. The remaining brand volume consists largely of patients with manufacturer-provided copay assistance cards (PAP cards), which effectively zero out out-of-pocket costs and reduce patient incentive to switch.
4.3 Copay Assistance and the Accumulator Programs
Manufacturer copay assistance programs are card-based subsidy mechanisms that pay the patient’s cost-sharing (copay or coinsurance) for brand drugs. From the patient’s perspective, the drug costs nothing out of pocket. From the payer’s perspective, the manufacturer’s subsidy counts against the patient’s deductible and out-of-pocket maximum under most plan designs.
Payers have responded with copay accumulator adjustment programs: plan designs that exclude manufacturer copay assistance from counting toward the patient’s deductible. Under an accumulator, once the manufacturer’s annual copay card limit is reached, the patient faces full cost-sharing for the brand drug. This creates a mid-year switch point where patients convert to generic or biosimilar options at high rates, which is precisely the payer’s intent.
The pharmaceutical industry has lobbied against accumulators at the state level with partial success. As of 2024, over 20 states have enacted laws limiting accumulator application, primarily for drugs with no generic or biosimilar alternative. For drugs with available alternatives, accumulators remain common and effective at driving generic substitution.
Key Takeaways: Section 4
The 80/20 spending split is a direct financial output of IP-protected market exclusivity. The split narrows when patents expire and generic uptake follows formulary tiering.
Copay assistance programs are the primary tool for maintaining brand volume after generic entry. Accumulator programs are the primary payer countermeasure. The legal and regulatory fight over accumulators is, at its core, a fight over which party captures the manufacturer subsidy.
5. Specialty Drugs and the Biologic IP Roadmap
5.1 Specialty Drug Spending: Scale and Growth Rate
Specialty drugs totaled $301 billion in US spending in 2021, a 43% increase from 2016. They represented roughly 50% of all US drug spending despite being used by a small fraction of the patient population. That share has grown from 32% in 2012 to approximately 51% in 2022. The Congressional Budget Office projects continued growth, driven primarily by the clinical and commercial pipeline.
The category ‘specialty drug’ lacks a single regulatory definition but is operationally defined by payers as drugs that meet three or more of the following: price above $600 per month, complex administration, requirement for special handling or storage, limited distribution networks, requirement for patient monitoring, or low prescribing volume concentrated among specialists.
5.2 Immunology and Oncology as the Dominant Cost Drivers
In Medicare Part D, the top 10 selling specialty drugs accounted for 22% of total gross Part D spending in 2021 while representing just 0.3% of covered drugs. In Medicare Part B, the infused biologic segment, biologics for oncology and immunology dominate expenditures, with drugs like pembrolizumab (Keytruda, Merck), nivolumab (Opdivo, BMS), and the JAK inhibitor/biologic portfolio for inflammatory diseases collectively representing tens of billions in annual Medicare spending.
Pembrolizumab illustrates the specialty drug IP and spending architecture in detail. Keytruda’s compound patent was filed in the early 2010s. Merck has built a portfolio of secondary patents covering PD-1 binding domain engineering, formulation, and method-of-use patents across multiple tumor types. Keytruda generated approximately $25 billion in global sales in 2023, with the US market contributing the majority. At a WAC of approximately $12,000 per 200mg dose for a non-small cell lung cancer patient receiving treatment every three weeks, annual per-patient drug cost at WAC exceeds $200,000.
5.3 The Biologic IP Technology Roadmap
A biologic’s IP roadmap from IND filing to biosimilar interchangeability has four distinct phases:
Phase 1: Foundational IP (Years 1-5 from development). The composition-of-matter patent, covering the antibody sequence or protein structure, is the core asset. For a monoclonal antibody, the composition patent typically covers the CDR sequences that define antigen binding specificity. This patent is the most valuable and most difficult for a biosimilar manufacturer to design around.
Phase 2: Process and Formulation IP (Years 3-10). Manufacturing process patents cover upstream cell culture conditions, downstream purification steps, and fill-finish specifications. Formulation patents cover excipients, pH, and concentration optimized for stability and tolerability. These are secondary to the compound patent but create additional Paragraph IV filing requirements for biosimilar ANDAs under 351(k) pathway applications.
Phase 3: Indication Expansion and Method-of-Use IP (Years 5-15). As the reference biologic gains additional FDA-approved indications, new method-of-use patents are filed and entered in the Purple Book. Biosimilar manufacturers seeking approval for all indications of the reference product must address all listed patents. This phase is also where combination use patents (biologic plus standard-of-care chemotherapy regimens) extend the IP thicket.
Phase 4: Device and Delivery IP (Years 8-20). Auto-injector and prefilled syringe patents cover the delivery device, latching mechanism, needle shield design, and patient-facing features. These patents typically expire 8-15 years after the device design is finalized, often well after the compound patent expires. Biosimilar interchangeability designation from FDA requires the biosimilar to use a comparable device that does not introduce additional risk from switching, which means biosimilar manufacturers must either license the device or engineer an equivalent, incurring additional development cost.
5.4 Biosimilar Interchangeability: What It Means and Why It Matters
Biosimilar interchangeability is a higher standard than basic biosimilar approval under Section 351(k). An interchangeable biosimilar can be substituted for the reference product at the pharmacy level without prescriber intervention, just as a generic can be substituted for a small molecule brand. Non-interchangeable biosimilars require an explicit prescriber decision to switch.
FDA granted its first interchangeable biosimilar designation in July 2021 (Semglee, insulin glargine-yfgn from Viatris/Biocon). As of 2024, approximately 12-15 interchangeable biosimilar designations have been granted. The therapeutic areas where interchangeability has been achieved first, insulins and certain adalimumab biosimilars, are where substitution rates at pharmacy have climbed most rapidly.
The commercial importance of interchangeability is large. In markets where pharmacy-level substitution is possible, biosimilar market share capture can approach 70-80% of new prescriptions within 12-18 months of launch, comparable to small molecule generic uptake curves. Without interchangeability, biosimilar penetration has been slower, typically 20-40% share after two years in markets with multiple competitors.
For biosimilar developers, interchangeability designation is worth a significant premium on market share modeling. For reference product manufacturers, avoiding interchangeability through device and formulation differentiation is a core commercial defense strategy.
Key Takeaways: Section 5
Specialty drugs at 50% of total US spending from a small fraction of patients represent a concentrated risk in insurance pool economics. Every percentage point of specialty drug penetration in a given therapeutic area translates to hundreds of millions in premium impact across commercial markets.
The biologic IP roadmap from composition patent to device patent covers 15-20 years of potential IP-backed revenue, far longer than most small molecule exclusivity windows.
Biosimilar interchangeability designation is the functional equivalent of generic substitution for biologics. Its commercial and policy importance will grow as more biologics face biosimilar competition after 2025.
Investment Strategy: Section 5
For analysts assessing reference biologic manufacturers facing biosimilar entry, the key variable is not just whether biosimilars will launch but whether they will achieve interchangeability. Model at least three scenarios: no interchangeable biosimilar for 5+ years (slow erosion), interchangeable biosimilar launch concurrent with molecule launch (moderate erosion at 40-60% volume loss in 24 months), and rapid interchangeability grant with formulary tier equivalence (severe erosion at 70-80% volume loss). AbbVie’s Humira revenue trajectory post-January 2023 biosimilar entry is the best current data set for calibrating US biologic erosion modeling.
6. The Distribution Chain: WAC, Rebates, PBM Economics, and Spread Pricing
6.1 The WAC-to-Net Price Gap
The Wholesale Acquisition Cost is the manufacturer’s list price to wholesalers and is the reference price for most US drug pricing discussions. It does not represent what any payer actually pays. Net price, what the manufacturer receives after rebates, discounts, and chargebacks, can be 30-70% below WAC for brand drugs with substantial rebate obligations.
The WAC-to-net gap has widened steadily over the past 15 years. In 2007, estimated average rebate levels for brand drugs in commercial markets ran at 10-15% of WAC. By 2022, research by the USC Schaeffer Center and others estimated average commercial rebates at 45-55% of WAC for brand drugs in competitive therapeutic categories. In some immunology categories with multiple branded competitors, manufacturers have offered rebates of 60-70% of WAC to secure preferred formulary position.
This creates a counterintuitive dynamic: list prices (WAC) have risen steadily, sometimes by 8-15% per year for major brand drugs, even as net prices have remained flat or declined. The list price increase finances the rebate the manufacturer must offer to maintain formulary access. The patient on a high-deductible plan who pays cost-sharing based on list price, not net price, bears the full increase. The payer who receives the rebate is largely insulated.
6.2 PBM Market Concentration and Revenue Mechanics
Three pharmacy benefit managers, CVS Caremark (part of CVS Health), Express Scripts (Cigna), and OptumRx (UnitedHealth Group), control approximately 80% of the US PBM market by covered lives. Each manages pharmacy benefits for tens of millions of plan members and negotiates rebates with manufacturers on their behalf.
PBMs generate revenue through several mechanisms. The most discussed is the retention of a portion of manufacturer rebates, the difference between what the PBM negotiates from the manufacturer and what it passes through to the plan sponsor. Historically, this retention has not been disclosed transparently, though the No Surprises Act and various state and federal transparency initiatives have increased reporting requirements.
Spread pricing is a second revenue mechanism: the PBM charges the plan sponsor more for a dispensed drug than it pays the dispensing pharmacy. On a generic drug priced at $5 acquisition cost at the pharmacy, the PBM might charge the plan $8, retaining $3 in spread. This mechanism is particularly prevalent in Medicaid managed care PBM contracts, where spread pricing on generics has been the subject of multiple state audits and lawsuits.
The administrative fee mechanism is the most transparent: a per-claim fee paid by the plan sponsor for PBM administrative services. These fees are disclosed in PBM contracts.
Total PBM revenue capture, across all mechanisms, is estimated at 3-5% of total drug spending, which at $600 billion represents $18-30 billion annually for the three major PBMs. The opacity of the system makes precise estimation difficult, which is itself a regulatory and policy concern that has driven bipartisan interest in PBM reform legislation.
6.3 Wholesaler Mechanics
McKesson, AmerisourceBergen (now Cencora), and Cardinal Health collectively handle approximately 90% of US drug distribution volume. Their business model is built on the ‘buy side’ margin between the manufacturer’s sale price and their acquisition cost, not on a fixed markup over WAC. For brand drugs, their effective acquisition cost is typically close to WAC due to limited chargeback structures. For generics, they benefit from prompt payment discounts and volume allowances that can result in effective acquisition costs materially below listed prices.
Wholesaler gross margins run at approximately 2-3% of revenues, thin but sufficient on the volume they handle. Operating leverage is high: fixed costs at scale are low relative to drug throughput, and the three major wholesalers collectively process hundreds of billions of dollars in drug inventory turnover annually.
6.4 Pharmacy Economics: Dispensing Fee and Margin Structure
Independent pharmacies earn a professional dispensing fee per prescription, typically $8-15, plus a margin on the drug. For brand drugs, pharmacy margin is typically 2-4% above their cost. For generic drugs, the dynamics are more complex: pharmacies can negotiate acquisition costs well below the reimbursement rates set by PBMs and payers, capturing margin between the two. When PBM reimbursement rates for generics are set at maximum allowable cost (MAC) pricing, pharmacies that source generics below MAC can generate substantial margin. When MAC pricing is set below acquisition cost, pharmacies absorb a loss on that prescription.
The shift toward mail-order and specialty pharmacy, which grew 35% in the 2016-2021 period, has pressured independent pharmacy economics. Large mail-order operations, many owned by PBMs (CVS Caremark’s Caremark Mail Service, Express Scripts’ specialty pharmacy), benefit from scale economies in dispensing and can negotiate tighter acquisition costs than independents.
Key Takeaways: Section 6
The WAC-to-net gap, now 40-60% for major brand biologics, means that list price increases are partially a mechanism for financing rebate obligations, not simply a direct revenue increase.
PBM rebate retention is a transfer from plan sponsors (employers, government programs) to PBMs that does not reduce patient cost-sharing when cost-sharing is calculated on WAC.
Spread pricing on generics is a contested practice that has attracted state and federal regulatory attention. Biosimilar pricing under specialty pharmacy benefit management may replicate spread dynamics if not explicitly addressed in plan sponsor contracts.
Investment Strategy: Section 6
PBM transparency reform, which has bipartisan Congressional support as of 2024-2025, poses material earnings risk to CVS Health, Cigna, and UnitedHealth Group’s PBM segments. If rebate pass-through mandates are extended beyond Part D to commercial plans, and if spread pricing is prohibited in Medicaid and Medicare, PBM earnings models will need to be restructured around transparent administrative fees. Analysts modeling these three holding companies should stress-test PBM segment EBITDA against a 50% and 75% rebate pass-through scenario over the next five years.
7. R&D Cost Reality: What the Literature Actually Says
7.1 The Range of Estimates and Why They Diverge
Industry-cited figures for drug development cost frequently reference the Tufts Center for the Study of Drug Development’s $2.5 billion estimate (2014) for a new approved compound, inclusive of capital costs and the cost of failures. Academic research using actual FDA approval data and company financial disclosures produces lower figures, and understanding the methodological differences matters for policy and investment analysis.
A 2022 study in the Journal of Health Economics covering approvals from 2000-2018 estimated mean direct development cost (no capital cost adjustment) at $172.7 million in 2018 dollars. Accounting for failures, the expected mean rises to $515.8 million. Capitalizing the cost of failures at a 10.5% discount rate pushes the mean expected capitalized cost to $879.3 million. These figures are methodologically credible but use cost data from companies that disclose clinical trial costs, a sample that may underrepresent the largest, most expensive late-stage development programs.
The range across therapeutic areas is wide: anti-infectives average $378.7 million in capitalized expected cost including failures, while pain and anesthesia programs average $1.76 billion. Oncology, where trial failure rates are high and pivotal trials are large, falls near the top of the cost distribution. CNS programs have historically had the highest capitalized costs relative to approval probability.
7.2 R&D Intensity Trends (2008-2019)
R&D intensity (R&D spend as a percent of sales) for the pharmaceutical industry increased from 11.9% to 17.7% between 2008 and 2019. For large pharma specifically, it increased from 16.6% to 19.3% over the same period, as total large-pharma sales increased 10% from $380 billion to $418 billion.
The increase in R&D intensity is partly a reflection of genuine clinical investment and partly a reflection of accounting and corporate structure: as small biotechs advance clinical candidates through Phase II and are acquired by large pharma, the acquired R&D pipeline cost is capitalized on the acquirer’s balance sheet as in-process R&D, which affects reported R&D intensity calculations.
7.3 Marketing vs. R&D: The Persistent Imbalance
Multiple peer-reviewed analyses have found that large pharmaceutical companies spend more on marketing and administration combined than on R&D. A widely cited JAMA Internal Medicine analysis covering 2016-2019 found that the median large pharma company spent 1.5 times more on sales and marketing than on R&D. An AHIP-sponsored analysis of COVID-era spending found that 7 out of 10 large pharma companies spent more on sales and marketing than R&D during the 2020-2021 period.
These figures do not invalidate the case for R&D-funded innovation. They do complicate the specific argument that high US drug prices are necessary to fund R&D, when a substantial share of the surplus extracted from high US prices funds sales force deployment, DTC advertising, and physician engagement activities.
DTC pharmaceutical advertising in the US totaled approximately $6.5 billion in 2021, up from $3 billion in 2012. The US and New Zealand are the only high-income countries that permit DTC prescription drug advertising. Research suggests DTC advertising disproportionately promotes high-revenue drugs with modest incremental clinical benefit over existing therapies.
Key Takeaways: Section 7
The true capitalized R&D cost per approved drug, accounting for failures, runs in the $500 million to $1.5 billion range depending on therapeutic area, not the $2.5 billion figure frequently cited by industry. The difference matters for price justification arguments in policy settings.
R&D intensity has risen over the past decade, but so has M&A-driven pipeline acquisition, which inflates reported R&D cost without necessarily reflecting internal discovery investment.
The marketing-R&D spending imbalance, documented in multiple peer-reviewed studies, is relevant to any regulatory or legislative argument that current US pricing levels are structurally necessary to sustain innovation.
8. Who Pays: Payer Mix, Out-of-Pocket Trends, and Benefit Design
8.1 The Payer Landscape
US prescription drug spending is financed through a mix of private insurance, Medicare, Medicaid, other government programs, and direct patient out-of-pocket payment. Private insurance covers the commercially insured population, primarily employer-sponsored health plans and individual market plans under the ACA. Medicare Parts B and D cover the 65+ and certain disabled populations. Medicaid covers low-income adults and children. The Veterans Health Administration covers eligible veterans under a separate formulary.
The federal government is the largest single payer when Medicare and Medicaid are combined, accounting for approximately 45-50% of total prescription drug spending. But the programs’ negotiating structures differ significantly. Medicaid receives statutory best-price rebates from manufacturers: the Medicaid Drug Rebate Program (MDRP) requires manufacturers to provide a rebate equal to at least 23.1% of AMP for brand drugs, or the best price offered to any commercial customer, whichever is larger. This has historically resulted in lower net prices for Medicaid than for Medicare Part D, which until the IRA had no direct price negotiation authority.
8.2 Out-of-Pocket Trends: The Aggregate vs. the Individual
Total out-of-pocket prescription drug spending fell slightly from $48 billion in 2010 to $47 billion in 2020, despite total spending rising 77% over the same period. The aggregate stability masks distributional volatility. Most patients with good commercial coverage pay low fixed copays for generics. A patient on a high-deductible plan (deductible of $1,500-$3,000) who needs a specialty biologic costing $30,000 per month faces the full deductible before insurance kicks in. In a commercial plan with 20% coinsurance, the same patient faces $6,000 in monthly cost-sharing until the out-of-pocket maximum is reached.
The ACA’s out-of-pocket maximum for 2024 is $9,450 for an individual in a marketplace plan. For a patient on a $200,000-per-year specialty drug, the patient reaches that maximum in roughly six weeks of calendar year, after which the plan covers 100% of drug costs. This front-loaded cost burden has driven demand for manufacturer patient assistance programs and specialty pharmacy financial counseling.
8.3 Medicare Part D Benefit Design: Pre- and Post-IRA
Pre-IRA Part D had a four-phase structure: an initial deductible ($505 in 2023), an initial coverage phase with standard cost-sharing, a coverage gap (the ‘donut hole’), and catastrophic coverage with 5% coinsurance. For a beneficiary on a $100,000 drug in pre-IRA Part D, annual out-of-pocket costs could reach $7,000-$8,000 before catastrophic coverage began, and the 5% coinsurance in the catastrophic phase continued to accrue.
The IRA caps Medicare beneficiary out-of-pocket drug costs at $2,000 starting in 2025 and eliminates the catastrophic phase coinsurance. This is a material improvement for the subset of beneficiaries on high-cost specialty drugs. The Congressional Budget Office projects this provision reduces beneficiary out-of-pocket costs by approximately $25 billion over the 2026-2031 window.
Key Takeaways: Section 8
Aggregate out-of-pocket stability conceals significant distributional exposure among high-cost specialty drug users. Policy analyses that cite stable aggregate out-of-pocket figures miss this distributional reality.
The IRA’s $2,000 out-of-pocket cap in Part D eliminates catastrophic cost-sharing exposure for Medicare beneficiaries, but shifts financial risk to plan sponsors and through premium adjustments, to the broader Medicare beneficiary pool.
9. Geographic and Demographic Concentration
9.1 State-Level Variations
Average household prescription drug spending in the US is approximately $4,571 annually. Delaware leads at $6,513, followed by Kentucky at $6,033 and Tennessee at $6,007. These are the only states where average household prescription costs exceed $6,000.
The geographic spread tracks multiple variables simultaneously: population age structure (older populations use more drugs), chronic disease prevalence (the Southeast has high rates of diabetes, hypertension, and cardiovascular disease), insurance coverage rates (states with lower coverage see higher out-of-pocket burdens per insured household), and prescribing practice variation.
States like Delaware with relatively high costs despite not having the highest poverty rates reflect prescribing patterns and insurance design as much as raw disease burden. The correlation between high-deductible plan prevalence and higher household prescription cost is positive: patients in high-deductible plans face the full WAC-proximate price for early-year prescriptions, inflating household spending data.
9.2 Age and Gender Concentration
Americans 65 and older regularly take four to five prescription medications. Those under 40 average one to two. This age gradient is the primary driver of Medicare’s disproportionate share of total prescription drug spending relative to its share of the US population.
Women fill more prescriptions across most age cohorts than men, a pattern driven by a mix of higher rates of autoimmune disease diagnosis in women (lupus, multiple sclerosis, rheumatoid arthritis), higher rates of mental health prescription use, and greater health services utilization generally. Reproductive health prescriptions including contraceptives and prenatal vitamins contribute in the 18-44 cohort.
Key Takeaways: Section 9
State-level per-household spending data is a proxy measure for plan design, age structure, and chronic disease burden, but not a reliable indicator of pharmaceutical company market opportunity. County-level analysis of specialty drug prescribing patterns by therapeutic area produces more actionable commercial intelligence.
10. Medicare Part D Spending Concentration
10.1 The 10-Drug Problem
The ten top-selling Medicare Part D drugs in 2021 accounted for just 0.3% of covered drugs but generated 22% of total gross Part D spending. This concentration has intensified since 2010, when specialty drugs represented 13% of net Part D spending. By 2015 that share reached 31%, and trends through 2022 suggest continued growth toward 40-45%.
The ten drugs driving this concentration in recent years include pembrolizumab (Keytruda), apixaban (Eliquis, BMS/Pfizer), rivaroxaban (Xarelto, Janssen/Bayer), ustekinumab (Stelara, J&J), adalimumab (Humira, AbbVie), and several oncology agents. These are not niche orphan drugs. They are large-indication treatments in oncology, cardiology, and immunology with multi-billion-dollar US revenue profiles.
10.2 The IRA Drug Price Negotiation Program: Mechanics
The IRA authorizes HHS to negotiate prices for selected high-cost Part D and Part B drugs without generic or biosimilar competition. The first negotiated prices take effect in 2026, covering the 10 drugs selected in 2023. CMS selected Eliquis, Jardiance (empagliflozin), Xarelto, Januvia (sitagliptin), Farxiga (dapagliflozin), Entresto (sacubitril/valsartan), Enbrel (etanercept), Imbruvica (ibrutinib), Stelara (ustekinumab), and Fiasp/NovoLog (insulin aspart) for the first negotiation cycle.
The negotiation floor is set by statutory ‘maximum fair price’ (MFP) ceilings that depend on drug age relative to approval and the manufacturer’s average non-federal domestic market price. For small molecules approved more than 16 years before negotiation, the MFP ceiling is 40% of non-federal average manufacturer price. For biologics approved more than 16 years prior, it is 65% of NFAMP. The older the drug and the lower the biologic distinction, the deeper the potential discount.
CMS announced negotiated prices for the first 10 drugs in August 2024. The negotiated prices represented discounts of 38-79% below WAC, with Stelara (ustekinumab) achieving the deepest discount, consistent with its substantial biosimilar competition beginning in 2023. The CBO projected $237 billion in federal deficit reduction over 10 years from all IRA drug pricing provisions combined.
10.3 Inflation Rebate Mechanics
The IRA requires manufacturers to pay rebates to Medicare if they raise drug prices faster than CPI-U inflation. For brand drugs already subject to rebate pressure, this provision adds a second compliance constraint: annual price increases above CPI-U trigger additional Medicare rebate liability.
Historical brand drug pricing practice has involved annual WAC increases of 5-10%, well above CPI-U growth of 2-3%. The inflation rebate provision has begun to change this behavior. Multiple large manufacturers announced WAC increase caps for Medicare-relevant drugs in 2023 and 2024, some voluntarily holding increases below CPI-U to avoid inflation rebate liability.
Key Takeaways: Section 10
The IRA negotiation program covers a small number of drugs in its initial phases but targets the highest-spending Part D products, making it likely to generate materially larger cost savings than its narrow drug list suggests.
The inflation rebate provision alters annual pricing behavior across the full brand portfolio, not just negotiated drugs, because all Medicare-covered brand drugs face inflation rebate liability if increased above CPI-U.
Investment Strategy: Section 10
The 10 drugs selected for first-cycle IRA negotiation are held by J&J, AbbVie, BMS, Pfizer, Janssen/J&J, AstraZeneca, Boehringer Ingelheim, Merck, and Novo Nordisk. Analysts should model Part D revenue impact net of MFP discounts for each drug, bearing in mind that negotiated prices apply only to Medicare Part D beneficiaries, not commercial patients. The revenue dilution from negotiated MFP pricing depends on the drug’s Medicare Part D share of total US volume, which ranges from 30% to over 60% among the first 10 selected drugs.
11. The Inflation Reduction Act: Provision-by-Provision Analysis
11.1 Price Negotiation
Medicare drug price negotiation is the IRA’s most structurally significant provision. It breaks a 25-year prohibition on CMS price negotiation that was embedded in the Medicare Modernization Act of 2003 as a condition of Part D’s creation. For the pharma industry, it represents a fundamental shift in the pricing relationship between government and manufacturer for the highest-revenue, non-competitive Medicare drugs.
Drugs become eligible for negotiation after being on the market for nine years (small molecules) or 13 years (biologics) without a generic or biosimilar entering. The program scales: 10 drugs for 2026 prices, 15 for 2027, 15 for 2028, and 20 per year thereafter. Over a decade, several hundred drugs will cycle through negotiation, covering the majority of the high-spend Medicare portfolio.
Pharmaceutical companies challenged the program in federal court arguing it constitutes compelled speech and an unconstitutional taking. As of 2025, the courts have uniformly rejected these challenges, finding that manufacturers voluntarily participate in Medicare and can exit the program rather than accept negotiated prices, making the process voluntary commercial negotiation rather than a constitutional violation.
11.2 Out-of-Pocket Cap and Its Financial Architecture
The $2,000 Part D out-of-pocket cap beginning in 2025 eliminates catastrophic cost exposure for Medicare beneficiaries. The mechanism works through a redesigned benefit structure: the coverage gap phase is eliminated, and a new manufacturer discount obligation in the catastrophic phase replaces the prior coinsurance structure. Manufacturers whose drugs are used in the catastrophic phase must provide a 20% discount; Part D plans cover 60%; Medicare covers the remaining 20%.
This manufacturer discount obligation in the catastrophic phase is a new financial commitment that was not present in pre-IRA Part D. For drugs where Medicare beneficiaries are disproportionately represented in the high-cost, catastrophic-phase patient population, the 20% catastrophic discount represents a material change in net revenue per Medicare prescription.
11.3 Insulin Cost-Sharing Cap
Starting January 2023, Medicare Part D and Part B insulin cost-sharing was capped at $35 per insulin product per month. This provision directly addresses a well-documented affordability crisis: multiple academic and media investigations documented rationing of insulin by US diabetic patients, including deaths associated with insulin underuse due to cost. The three major insulin manufacturers (Eli Lilly, Novo Nordisk, Sanofi) announced voluntary commercial market insulin price reductions of 70-78% in 2023, preemptively addressing congressional pressure for broader cost caps.
Eli Lilly’s decision to cap its insulin prices at $35 per month commercially, implemented in March 2023, represented an acknowledgment that insulin pricing in the US had become politically untenable. The commercial price reductions, combined with Medicare caps, significantly reduced the insulin patient cost burden, though they also materially impacted insulin revenue for all three manufacturers.
Key Takeaways: Section 11
The IRA does not establish reference pricing, cost-effectiveness thresholds, or international price benchmarking. It is a targeted negotiation program focused on off-patent and mature brand drugs with no competition, not a broad price control system.
The manufacturer discount obligation in the Part D catastrophic phase is a new recurring financial commitment that did not exist before the IRA and will grow in value as more patients reach catastrophic coverage annually under the new benefit design.
Insulin price reductions by Lilly, Novo, and Sanofi demonstrate that manufacturer pricing behavior responds to political and legislative pressure even in the absence of a direct legal price mandate.
Investment Strategy: Section 11
The IRA’s long-term revenue impact on originator pharma depends heavily on pipeline composition. Companies whose pipeline is weighted toward short-exclusivity-window small molecules that will reach negotiation eligibility at 9 years post-approval face greater IRA exposure than companies whose pipeline consists primarily of recently approved biologics (13-year negotiation clock) or drugs with active biosimilar competition (which removes them from negotiation eligibility). Portfolio composition analysis by expected negotiation eligibility date should be a standard component of pharma equity research.
12. Future Projections: Cell and Gene Therapy, Biosimilar Interchangeability, and the Next Patent Cliff
12.1 Cell and Gene Therapy: The Pricing Frontier
The cell and gene therapy pipeline represents the highest-cost single-administration treatments in pharmaceutical history. Approved products as of 2024 include Zolgensma (onasemnogene abeparvovec, Novartis) at $2.1 million per treatment for spinal muscular atrophy, Hemgenix (etranacogene dezaparvovec, CSL Behring) at $3.5 million per treatment for hemophilia B, and Casgevy (exagamglogene autotemcel, Vertex/CRISPR Therapeutics) at $2.2 million per treatment for sickle cell disease and transfusion-dependent beta-thalassemia.
These single-administration therapies change the economics of drug spending in ways that aggregate annual spending statistics do not fully capture. A patient receiving a $3 million gene therapy generates $3 million in drug spending in a single year, but may require no further treatment for 10-20 years if the therapy is durable. The challenge for payers is that current insurance systems are designed around annual premium cycles, not multi-year durability-based value captures.
Outcomes-based contracts (OBCs) and installment payment arrangements are emerging as payer mechanisms for accommodating high single-dose costs. Several state Medicaid programs have entered OBCs with manufacturers including Novartis for Zolgensma, structuring payments as annual installments contingent on continued therapeutic durability. Commercial payers have been slower to adopt OBCs, partly due to actuarial complexity and partly due to member turnover risk, where the payer who bears the high initial cost loses the member (and thus the benefit of long-term therapeutic durability) when the member changes plans.
12.2 The 2025-2030 Biologic Patent Cliff
The period from 2025 to 2030 represents the most significant wave of biologic patent and exclusivity expirations in pharmaceutical history. Following Humira (adalimumab, $20+ billion peak global sales), which saw US biosimilar entry in January 2023, the following major biologics face substantive exclusivity pressure in the 2025-2030 window: Stelara (ustekinumab, J&J), Eylea (aflibercept, Regeneron), Dupixent (dupilumab, Sanofi/Regeneron, longer exclusivity runway), Tysabri (natalizumab, Biogen), Prolia/Xgeva (denosumab, Amgen), and Actemra (tocilizumab, Roche).
Total revenue at risk from biologic exclusivity expirations across the 2025-2030 window has been estimated at $200-$250 billion in cumulative global sales. US revenue at risk is proportionally the largest single national component, given US biologic pricing premiums of 2-4x vs. European reference markets.
Biosimilar manufacturers including Amgen Biosimilars, Samsung Bioepis, Formycon, Coherus, Organon, and others have filed 351(k) applications for these products. The rate of biosimilar interchangeability achievement and the commercial adoption trajectory will determine how much of this revenue at risk is captured by biosimilar entrants vs. retained by originator manufacturers through branded conversion strategies.
12.3 GLP-1 Agonists: The Next Spending Surge
The GLP-1 receptor agonist class, specifically semaglutide (Ozempic/Wegovy, Novo Nordisk) and tirzepatide (Mounjaro/Zepbound, Eli Lilly), is likely to become the largest single driver of US prescription drug spending growth through 2030. Ozempic at a WAC of approximately $900 per month and Wegovy at approximately $1,350 per month, with a US prescribing population that could reach 10-15 million patients by 2026-2027, generates annual US drug spending of $100-200 billion at full penetration.
Novo Nordisk’s semaglutide IP includes composition-of-matter patents running to 2032 and formulation/device patents extending further. Eli Lilly’s tirzepatide compound patents run through approximately 2036. Neither compound faces near-term generic entry. The primary competitive dynamic through the early 2030s is brand-versus-brand GLP-1 competition, not brand-versus-generic pressure.
Payer formulary management of GLP-1s is the central commercial battle. Prior authorization requirements, step therapy mandates requiring documented failure of lifestyle intervention, and quantity limits are the tools payers use to manage utilization. CMS excluded GLP-1s for obesity from Medicare Part D coverage in a statutory exclusion that the IRA did not address directly. Proposals to add obesity coverage to Medicare Part D are in legislative discussion, and if enacted, the GLP-1 spending impact on Medicare budgets would be substantial.
Key Takeaways: Section 12
Cell and gene therapy pricing, at $1-4 million per administration, requires outcomes-based contracting structures that current insurance economics are not architected to handle at scale. The financing architecture for durable gene therapies remains a largely unsolved policy and actuarial problem.
The 2025-2030 biologic patent cliff represents the largest single wave of high-revenue biologics entering biosimilar competition in pharmaceutical history. The commercial outcome of this cliff will depend on biosimilar interchangeability rates, formulary positioning, and manufacturer conversion strategies.
GLP-1 agonists at full commercial penetration may represent $100-200 billion in annual US drug spending, a category concentration that has no recent precedent in pharmaceutical market history.
Investment Strategy: Section 12
The GLP-1 market structure through 2030 favors Novo Nordisk and Eli Lilly given their compound patent protection, manufacturing scale, and regulatory filings. Investors should model both the upside from penetration growth and the payer pushback risk through formulary restriction and prior authorization. The key variable is the Medicare obesity coverage decision, which if passed would add 40-60 million potential Part D-eligible patients to the covered population for weight management indications and could shift peak GLP-1 Part D spending to $60-80 billion annually. That scenario has significant federal budget implications and would likely trigger additional price negotiation prioritization under the IRA program.
13. Investment Strategy Summary for Institutional Analysts
13.1 The Core Framework
US pharmaceutical investment analysis requires integrating four variables simultaneously: IP portfolio durability (not just patent expiry date), payer dynamics (formulary position, rebate obligation, biosimilar interchangeability exposure), IRA negotiation eligibility (timing and likely MFP discount magnitude), and pipeline composition (specialty vs. primary care, biologic vs. small molecule, orphan vs. broad-indication).
Companies with mature, patent-protected biologic portfolios face larger near-term IRA exposure but have more durable exclusivity windows through device and formulation IP. Companies with small molecule-heavy portfolios face earlier Paragraph IV challenge timelines but lower IRA exposure if their drugs face generic competition before reaching negotiation eligibility.
13.2 The Biosimilar Interchangeability Premium
Biosimilar manufacturers that achieve interchangeability designation for a high-revenue reference biologic should be valued with a market share capture assumption meaningfully above non-interchangeable biosimilar peers. The commercial evidence from insulin markets supports a 20-30 percentage point market share premium for interchangeable vs. non-interchangeable biosimilars at 24 months post-launch.
13.3 GLP-1 Medicare Coverage as a Binary Event
If Medicare Part D gains statutory authority to cover GLP-1 agonists for obesity, the revenue impact on Novo Nordisk and Eli Lilly would be substantial and rapid. It would also trigger IRA negotiation eligibility for semaglutide and tirzepatide within 9-13 years post-approval, creating a future negotiation cliff that analysts should model now, not at the time of legislative action.
13.4 The PBM Reform Scenario
If federal PBM reform mandates full rebate pass-through to plan sponsors and prohibits spread pricing in government programs, the financial structure of CVS Health, Cigna, and UnitedHealth Group’s pharmacy benefits segments will change materially. These companies have been building revenue streams outside PBM operations (retail pharmacy, health services, specialty pharmacy, infusion) partly as strategic diversification against this risk. Stress-testing PBM segment earnings against a pass-through mandate scenario is relevant to any long position in these three names.
Methodological Note on Data Sources
The expenditure data in this analysis draws on ASPE’s 2022 report on trends in prescription drug spending, JMCP research on specialty drug concentration in Medicare Part D, CMS drug spending dashboards, the USC Schaeffer Center’s research on pharmaceutical money flows, and JAMA Internal Medicine and JAMA Network Open research on R&D cost estimation. WAC-to-net gap estimates reflect USC Schaeffer and DrugChannels Institute analyses. IRA provision analysis reflects CBO scoring from 2022 and CMS implementation guidance through 2024. All data should be cross-referenced against primary sources for investment decisions.
This analysis is provided for informational purposes to pharmaceutical IP professionals, R&D leads, and institutional investors. It does not constitute investment advice. Drug spending data, patent status, and regulatory information change continuously and should be verified against current primary sources.


")


