The three largest pharmacy benefit managers, CVS Caremark, Express Scripts (now Evernorth, the health services subsidiary of Cigna), and OptumRx (owned by UnitedHealth Group), collectively process roughly 80% of all U.S. prescription drug claims. Each of those three companies also owns, or has a direct commercial relationship with, a major retail or mail-order pharmacy chain. CVS Caremark owns CVS Pharmacy. Evernorth operates Express Scripts mail-order and has deep integrations with Cigna-owned specialty pharmacies. OptumRx runs one of the country’s largest mail-order pharmacy operations and is embedded within the UnitedHealth enterprise alongside the insurer UnitedHealthcare.
That structural fact is the foundation of every economic problem this guide analyzes. Pharmacists are not caught in the crossfire of a price war between unrelated parties. They are caught in a system where the entities setting their reimbursement rates, auditing their dispensing records, managing their formulary access, and imposing retroactive fee clawbacks are, in many cases, the same corporate family that directly competes with them for prescription volume. For pharma and biotech teams managing market access, for institutional investors modeling pharmacy sector economics, and for IP professionals tracking how patent expiration patterns interact with reimbursement dynamics, understanding this system at a mechanistic level is not optional.
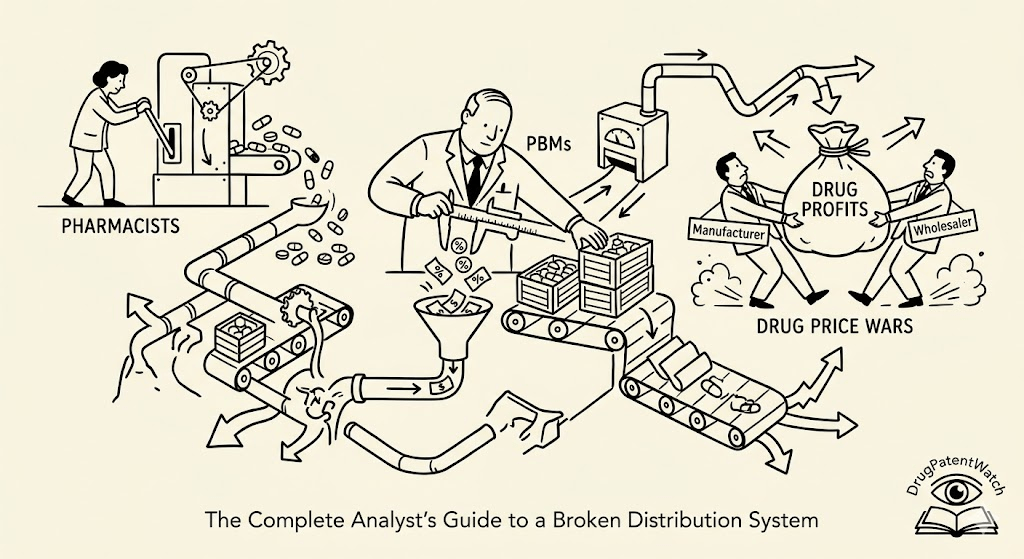
Part I: PBM Architecture – How the Intermediary Captured the System
The Original Function vs. the Current Reality
PBMs emerged in the 1960s and 1970s as claims-processing intermediaries, handling the administrative work of adjudicating prescription drug benefits on behalf of insurers and self-insured employers. The value proposition was simple: an employer group with 5,000 covered lives could not effectively negotiate drug prices with Merck or Pfizer. A PBM aggregating millions of covered lives across hundreds of employer groups could. The early model generated revenue from administrative fees paid by health plan sponsors, and the economic logic held.
The current model bears little resemblance to that original function. PBMs now generate revenue from at least five distinct streams: administrative fees from plan sponsors, manufacturer rebates negotiated in exchange for formulary placement, spread pricing on drug reimbursements, pharmacy network fees charged to dispensing pharmacies, and ancillary revenue from specialty pharmacy operations they own. Not all of these revenue streams are disclosed in detail to the plan sponsors who contract with PBMs, and several of them create direct financial conflicts between the PBM’s incentives and the interests of the plan or the patient.
Spread Pricing: The Core Mechanism of Extraction
Spread pricing is the practice by which a PBM charges a plan sponsor a higher amount per prescription than it reimburses the dispensing pharmacy, pocketing the difference. The plan sponsor pays, say, $12 for a generic metformin fill. The pharmacy receives $7. The PBM retains $5 as spread, with no disclosure to either party of the other’s price.
The Ohio Medicaid system produced one of the most thoroughly documented exposures of spread pricing in any government payer. A 2018 audit conducted by the State Auditor’s Office found that Ohio’s Medicaid managed care PBMs billed the state $223.7 million more than they paid pharmacies for the same drugs over a single fiscal year. The three PBMs operating in the Ohio Medicaid program at the time, OptumRx, CVS Caremark, and Centene’s pharmacy subsidiary Envolve, collectively generated that spread without any contractual obligation to disclose it to the state. Ohio subsequently banned spread pricing in its Medicaid program. Several other states followed, including Kentucky, which in 2020 passed legislation requiring PBMs to pass through 100% of manufacturer rebates and eliminating spread pricing for state Medicaid contracts.
The federal Medicaid spread pricing problem prompted Congressional scrutiny. The Centers for Medicare & Medicaid Services issued guidance in 2020 requiring states to collect and report spread pricing data from managed care organizations, and CMS’s 2023 proposed rule on Medicaid managed care would have added additional transparency requirements. But at the commercial insurance level, spread pricing remains largely legal, unregulated, and opaque in most states.
For pharma manufacturers tracking net price erosion, spread pricing has a secondary effect that is often overlooked. When a generic drug is subject to heavy spread pricing, the pharmacy’s realized margin on that product is often negative, since the PBM reimburses below acquisition cost and retains the spread. This accelerates independent pharmacy closures, reducing the dispensing infrastructure for the very generic drugs that manufacturers have invested in bringing to market. A market with fewer dispensing points has lower generic penetration rates at the point of LOE, which affects the realized market share ramp that generic manufacturers model in their ANDA filing investment cases.
The Rebate Architecture and Its Effect on Formulary Access
Manufacturer rebates paid to PBMs in exchange for formulary placement represent the single largest and most consequential financial flow in U.S. pharmaceutical distribution. The Congressional Budget Office estimated in 2021 that total gross-to-net discounts across Medicare Part D, Medicaid, and commercial markets exceeded $200 billion annually. The portion retained by PBMs rather than passed to plan sponsors varies by contract and is largely undisclosed.
The rebate system’s structural problem is that rebates are calculated as a percentage of list price. A drug with a $10,000 annual list price generates a larger absolute rebate than a $2,000 drug even if the $2,000 drug has equivalent or superior clinical value. This creates a formulary placement incentive that favors high-list-price drugs over lower-cost alternatives, which is precisely the opposite of what a transparent competitive market would produce.
Humira (adalimumab) at its peak U.S. list price of approximately $7,000 per monthly carton generated rebates estimated at 50-60% of list in some commercial contracts. At $21 billion in annual U.S. Humira sales, even a 40% rebate rate returns roughly $8 billion annually in gross rebates flowing through PBM contracts. Biosimilar adalimumab products, which launched in the U.S. starting January 2023, entered the market at list prices 5-85% below Humira’s list, depending on whether the biosimilar was priced on a ‘high-list/high-rebate’ or ‘low-list/low-rebate’ strategy. Several biosimilar manufacturers, including Sandoz, Organon, and Fresenius Kabi, chose to price their products at significant list price discounts. Others, including Amgen (Amjevita) and Pfizer (Abrilada), launched a second ‘high-list’ WAC alongside their low-list versions, specifically designed to compete in rebate-dependent formulary negotiations.
The result is a biosimilar market where a product’s formulary access does not depend primarily on its clinical profile or its actual net cost to the system. It depends on the rebate yield it generates for the PBM. Biosimilar manufacturers who priced for transparency and patient out-of-pocket reduction found themselves locked out of preferred formulary tiers occupied by either Humira or high-rebate biosimilars. This is a documented market access failure that the FTC has cited in its ongoing investigation into PBM practices.
IP Valuation Dimension: PBM Market Concentration and Its Effect on Branded Drug NPV
For pharma IP teams and investors, PBM market concentration has a direct effect on branded drug net price trajectories. When three entities control 80% of prescription volume, those three entities set effective net prices through rebate negotiations. The manufacturer’s nominal list price becomes an accounting artifact. The commercially relevant price is the post-rebate net price, which is set bilaterally through confidential negotiations.
The net price for a formulary-preferred brand drug under a well-negotiated PBM contract might be 30-50% of list price, depending on therapeutic area competition and payer mix. In GLP-1 receptor agonists, Novo Nordisk and Eli Lilly have faced competing formulary exclusion decisions, with some major PBMs excluding semaglutide (Ozempic, Wegovy) or tirzepatide (Mounjaro, Zepbound) entirely in favor of the competitor. A formulary exclusion by a single major PBM can reduce covered lives access by 15-25 million patients overnight, which translates directly into revenue impact that is often not captured by consensus models built on list price-based revenue projections.
Investment Strategy: When modeling net revenue for a branded pharmaceutical asset, do not use WAC as the base. Request payer mix data from the company’s investor relations, identify the formulary tier status across the three major PBMs, and model rebate rates by competitive intensity in the therapeutic class. A drug in a crowded formulary class with three or more preferred competitors will face rebate rates of 50-65%+ of WAC. A drug with an exclusive or semi-exclusive formulary position may retain 70-80% of WAC in net realized price. The difference between those scenarios is often the difference between a product that meets consensus expectations and one that misses by 20-30%.
Key Takeaways for Part I: PBMs have transformed from administrative processors into vertically integrated intermediaries that set effective net drug prices, determine formulary access, own competing dispensing channels, and generate revenue from opaque spread and rebate mechanisms. For pharma manufacturers, the PBM relationship is a market access relationship with direct revenue implications that are as consequential as the drug’s clinical profile. For investors, WAC-based revenue modeling systematically overestimates net revenue for drugs in competitive therapeutic classes.
Part II: DIR Fees – The Retroactive Tax on Pharmacy Economics
How DIR Fees Evolved from a Regulatory Concept to a Financial Weapon
Direct and Indirect Remuneration, or DIR, originated as an accounting concept within Medicare Part D. The Part D program requires CMS to conduct a retroactive reconciliation of drug costs after each plan year to account for all price concessions received by Part D sponsors and their downstream entities. The regulatory intent was to ensure that CMS’s federal reinsurance payments were calculated on a true net cost basis, accounting for all rebates, discounts, and other price reductions received from manufacturers.
PBMs recognized that the DIR reporting mechanism created an opportunity to impose retroactive fee arrangements on network pharmacies and report those fees as DIR, reducing the plan’s reported drug costs and, consequently, the plan’s reinsurance burden. This transformed a cost-accounting mechanism into a business practice: the PBM imposes performance-based fees on pharmacies that are calculated and collected months after the dispensing event, reports those fees as DIR, reduces reported plan costs, and in many cases retains the economic benefit of that reduction through risk-corridor arrangements or administrative fee structures.
Between 2010 and 2022, total DIR fees assessed against pharmacies in Medicare Part D grew from approximately $30 million to an estimated $12 billion annually, a roughly 400-fold increase over 12 years. The Medicare Payment Advisory Commission (MedPAC) flagged this growth in multiple annual reports to Congress as a major source of pricing distortion in the Part D system. CMS ultimately acted in 2022 with a rule change, effective January 1, 2024, requiring that pharmacy price concessions be reflected at the point of sale rather than through retroactive DIR. This change eliminated retroactive DIR fees for Medicare Part D transactions.
That rule change is consequential but does not address the commercial insurance market, where retroactive performance-based fees on pharmacies remain common and largely unregulated. Independent pharmacies contracting with commercial PBM networks continue to face retroactive fee structures that create the same financial uncertainty the Part D DIR rule was designed to eliminate.
The Performance Metric Problem: What Pharmacies Are Actually Being Judged On
DIR fees in Part D, and analogous performance fees in commercial contracts, are ostensibly justified by pharmacy performance on quality metrics. The metrics used include medication adherence rates for chronic disease medications (diabetes, hypertension, cholesterol), generic dispensing rates, medication therapy management completion rates, and patient satisfaction scores. In theory, paying pharmacies based on quality outcomes aligns financial incentives with patient health.
In practice, the metrics have three structural problems that make them poor tools for fair performance assessment. The first is attribution: a pharmacy cannot control whether a patient actually takes the medication it dispenses. A patient who fills their statin at a given pharmacy but then decides not to take it will generate an adherence miss attributed to that pharmacy, even if the pharmacy counseled the patient appropriately at the point of dispensing. The second is selection bias: pharmacies in lower-income or lower-health-literacy populations serve patient panels with systematically worse adherence rates, not because the pharmacy provides inferior care but because the patient population has more barriers to medication adherence. A rural independent pharmacy serving an elderly Medicaid-Medicare dual-eligible population will structurally underperform an urban chain pharmacy serving a commercially insured, higher-income patient panel on these metrics, regardless of the quality of care provided. The third is transparency: the formulas used to calculate DIR fees are proprietary and can change mid-contract year, meaning a pharmacy cannot effectively predict its DIR exposure or modify its behavior to improve its score because the scoring methodology is not disclosed.
The 2024 Part D DIR rule change addressed the retroactivity problem but not the metric design problem. Performance-based fees are now required to be reflected at the point of sale rather than retroactively, which provides cash flow certainty. But the underlying metrics and their application remain subject to PBM discretion.
Pharmacy Closure Economics: The DIR-Driven Attrition
The National Community Pharmacists Association tracked pharmacy closure data and estimated that approximately 6,000 independent pharmacies closed between 2017 and 2023, a period that coincides with the most aggressive growth in retroactive DIR fee assessment. The closure rate accelerated in rural areas, where independent pharmacies often operate as the sole dispensing point for a geographic community. The Health Resources and Services Administration designates many rural counties as Health Professional Shortage Areas, and pharmacy deserts, defined as areas where no pharmacy operates within 10 miles, have expanded substantially in rural America over the same period.
For pharma manufacturers, pharmacy closures have two direct commercial consequences. First, they reduce the dispensing infrastructure available to patients for their products, particularly for products targeted at older or rural patient populations who rely on local community pharmacies and lack the digital access that makes mail-order pharmacy convenient. Second, they shift dispensing volume toward vertically integrated PBM-owned pharmacies, which have commercial incentives to favor specific formulary positions and therapeutic substitutions that are set at the PBM corporate level, not at the point of patient care.
For biosimilar manufacturers specifically, the shift of dispensing volume toward mail-order pharmacies is particularly consequential. Mail-order pharmacies operate on central dispensing models where the therapeutic substitution decision is made at the formulary level, not the individual prescriber or pharmacist level. A biosimilar that achieves FDA interchangeability designation, which allows pharmacist-level substitution without prescriber authorization, gains a meaningful commercial advantage at retail pharmacies where pharmacists exercise dispensing discretion. At mail-order pharmacies, that interchangeability designation is less commercially relevant because the substitution decision is governed by the PBM’s formulary, not the pharmacist’s clinical judgment.
Investment Strategy: Companies with biosimilar products in development should assess whether their target patient population is predominantly served by retail or mail-order pharmacy channels. For biologics with high mail-order penetration, FDA interchangeability designation provides smaller commercial returns than commonly modeled, since the primary channel for volume capture is formulary placement, which is governed by rebate negotiations, not interchangeability status.
Key Takeaways for Part II: Retroactive DIR fees grew from a $30 million regulatory accounting mechanism to a $12 billion annual extraction from pharmacy economics over 12 years. CMS’s 2024 point-of-sale rule change eliminated retroactive DIR for Medicare Part D but left commercial market DIR analogs unaddressed. Pharmacy closures driven in part by DIR fee economics have reduced dispensing infrastructure in ways that affect commercial outcomes for manufacturers with rural or elderly patient populations and have shifted volume to vertically integrated mail-order channels where biosimilar interchangeability designations provide limited commercial benefit.
Part III: Vertical Integration – The Corporate Consolidation That Reshaped Access
The Architecture of the Three Major Vertically Integrated Entities
The CVS Health enterprise encompasses CVS Pharmacy (approximately 9,000 retail locations), CVS Caremark (PBM, processing roughly 2 billion claims annually), Aetna (health insurer, acquired in 2018 for $69 billion), CVS Specialty (specialty pharmacy), and MinuteClinic (primary care clinics embedded within retail locations). The total enterprise generated approximately $372 billion in revenue in 2024.
The Cigna/Evernorth enterprise encompasses Evernorth Health Services (the parent of Express Scripts PBM, specialty pharmacy, and behavioral health services), Cigna Healthcare (health insurance), Accredo (specialty pharmacy), and CuraScript (specialty pharmacy distributor). Cigna generated approximately $247 billion in revenue in 2024.
The UnitedHealth Group enterprise encompasses UnitedHealthcare (health insurance, the largest U.S. health insurer by enrollment), Optum (health services, including OptumRx PBM, Optum Pharmacy, and OptumHealth clinical services), and a network of physician groups and surgery centers that UnitedHealth has acquired through Optum. UnitedHealth generated approximately $400 billion in revenue in 2024. That figure makes UnitedHealth the largest company by revenue in the United States, ahead of Walmart and Amazon.
These three enterprises collectively control the insurance status, formulary access, reimbursement rates, dispensing channel preference, and pharmacy network participation terms for the majority of commercially insured and Medicare Advantage-covered lives in the United States. The competitive implications are not theoretical.
Self-Dealing Mechanisms: How the Integrated Model Steers Volume
Vertical integration creates a specific category of commercial behavior that regulators and plaintiffs’ attorneys call self-dealing: the preferential steering of patients, prescriptions, and dispensing volume toward affiliated entities at the expense of unaffiliated competitors, often without disclosure to the patient or the plan sponsor.
The mechanisms for volume steering include preferred cost-sharing differentials, where a plan charges lower copays for prescriptions filled at the vertically integrated company’s mail-order pharmacy than at an unaffiliated retail pharmacy. A patient on a Cigna health plan might pay a $10 copay for a 90-day supply of a maintenance medication filled through Express Scripts mail-order but a $25 copay for the same prescription filled at an independent local pharmacy. The plan’s explanation-of-benefits statement describes this as a ‘preferred network’ difference, which is technically accurate and legally permissible. The patient who is not sophisticated enough to understand that Express Scripts is owned by Cigna perceives it as an unbiased cost differential rather than an intracompany transfer designed to capture dispensing margin.
Specialty pharmacy steering is a more consequential and less visible mechanism. Specialty drugs, broadly defined as biologics, complex small molecules, or drugs requiring special handling, account for roughly 50% of drug spending despite representing only 2-3% of prescription volume. PBMs designate certain specialty drugs as ‘limited distribution’ or ‘exclusive specialty,’ meaning they can only be dispensed through a narrow network of pharmacies. When that network is exclusively or predominantly the PBM’s own affiliated specialty pharmacy, the designation effectively functions as a monopoly dispensing arrangement for that drug.
Accredo, Express Scripts’ specialty pharmacy arm, generated approximately $67 billion in specialty drug revenues in 2023. CVS Specialty generated similar volumes. For a specialty drug manufacturer like Alexion (now part of AstraZeneca), or Sarepta Therapeutics, or BioMarin Pharmaceutical, securing broad specialty pharmacy network access across all three vertically integrated entities is a market access negotiation as consequential as the formulary placement decision. Being limited to a single-entity specialty pharmacy network without adequate compensation for that exclusive arrangement is a material commercial disadvantage.
FTC Scrutiny of PBM Practices: The 2024 Interim Report and Its Implications
The Federal Trade Commission issued an interim staff report on PBM practices in July 2024, following a 2022 study order issued to the six largest PBMs. The report documented several practices the FTC characterized as potentially anticompetitive and harmful to patients and independent pharmacies. It found that vertically integrated PBMs steered prescriptions to affiliated pharmacies even when independent pharmacies could fill the prescription at lower cost, that PBMs used their market position to extract fees from independent pharmacies that were not imposed on affiliated pharmacies, and that the rebate system was designed to entrench high-list-price drugs on preferred formulary tiers in ways that raised costs for patients at the point of sale.
The FTC’s report did not contain enforcement actions, but it has informed ongoing Congressional activity. The Pharmacy Benefit Manager Reform Act, which passed the Senate Finance Committee in 2023, would require PBMs to adopt a pass-through pricing model for Medicare Part D (eliminating spread pricing) and would prohibit PBMs from receiving compensation that varies based on the list price of a drug. The legislation would also require that rebates be passed directly to the patient at the point of sale. As of early 2026, the legislation has not been enacted into law, but components of it have been incorporated into broader drug pricing bills under active negotiation.
For pharma manufacturers, the FTC investigation and potential PBM reform legislation create a scenario where the rebate-based formulary placement model, which has been the primary commercial negotiating tool for obtaining preferred formulary access for branded drugs, may be structurally altered. If rebates must be passed through to patients at the point of sale, the economic incentive for a PBM to grant preferred formulary status to a high-rebate drug is substantially reduced. This would shift formulary competition from rebate magnitude to net cost after rebate, which is a meaningfully different competitive dynamic favoring drugs with lower list prices and lower gross-to-net spread.
Investment Strategy: Monitor the legislative trajectory of PBM reform closely, and consider its implications for your market access model before pricing decisions are made for pipeline assets. A drug priced at $50,000 per year with a 40% rebate rate returns $30,000 net. A drug priced at $32,000 with no rebate returns the same net. In a rebate pass-through world, the lower-list drug has lower patient out-of-pocket costs, which improves adherence, reduces patient assistance program expenditure, and produces a better commercial profile. Pricing strategy for assets currently in Phase II or Phase III should be modeled against both the current formulary environment and a post-reform scenario.
Key Takeaways for Part III: The three vertically integrated PBM/insurer/pharmacy enterprises collectively define the commercial environment for virtually every drug dispensed in the U.S. Specialty pharmacy steering and preferred cost-sharing differentials are documented mechanisms for self-dealing that harm independent pharmacies and limit patient choice. The FTC’s 2024 interim report has elevated regulatory risk for current PBM practices, and potential legislative reform to rebate pass-through models would structurally alter the formulary access negotiation environment that pharma companies have operated within for two decades.
Part IV: Drug Patents, LOE Events, and Pharmacy Economics
How Patent Expiration Timing Moves Through the Pharmacy Distribution System
Patent expirations do not affect pharmacies in a uniform or gradual way. They generate discrete, often abrupt commercial events that pharmacy operators must anticipate to avoid margin destruction. When a high-volume branded drug loses exclusivity and multi-source generic entry occurs, the following sequence plays out at the pharmacy level within 90-180 days: brand WAC drops modestly as the manufacturer attempts to retain residual branded volume; PBMs shift the brand to a non-preferred or non-covered formulary tier; multiple generic manufacturers enter simultaneously; AWP-based generic reimbursements from PBMs compress rapidly as the number of generic suppliers increases and PBMs ratchet down their maximum allowable cost (MAC) pricing; and the pharmacy’s acquisition cost for the generic converges with or exceeds MAC reimbursement as suppliers compete on volume rather than price.
That last point deserves emphasis. MAC pricing, the ceiling reimbursement rate set by PBMs for generic drugs, is updated on a schedule that is proprietary to each PBM. When the MAC price is reduced faster than the pharmacy’s acquisition cost from wholesalers, the pharmacy dispenses the drug at a loss. This is not an edge case. The National Community Pharmacists Association’s 2023 Digest survey found that independent pharmacies reported dispensing at or below cost for an average of 27% of generic prescriptions. For pharmacies with high Medicaid managed care exposure, which pay MAC rates that are often the lowest in any payer category, that percentage is substantially higher.
The Orange Book as a Business Intelligence Tool for Pharmacies
The FDA’s Orange Book, formally titled Approved Drug Products with Therapeutic Equivalence Evaluations, lists every drug approved under an NDA or ANDA, including the patents associated with each approved product and their expiration dates. For retail pharmacy operators, the Orange Book is an inventory planning tool: it tells you when a generic is likely to become available for a high-cost brand drug in your dispensing mix. For manufacturers and investors, it is the primary public data source for constructing LOE calendars.
The Orange Book has structural limitations as a forecasting tool. It lists only patents that the NDA holder has voluntarily listed, which is a requirement for drugs subject to Hatch-Waxman. Some patent holders list additional patents of questionable relevance to deter generic challenges. Others fail to list relevant patents or list them with coding errors that create litigation risk. The presence of a patent in the Orange Book does not mean it will survive a Paragraph IV challenge; between 75-80% of Paragraph IV challenges that reach trial result in a finding of invalidity or non-infringement, according to data from the Generic Pharmaceutical Association and academic analyses of Hatch-Waxman litigation outcomes.
Platforms like DrugPatentWatch add interpretive value to the raw Orange Book data by tracking Paragraph IV certification filings, ANDA approval status, litigation outcomes, and first-filer exclusivity eligibility. The commercial consequence of a Paragraph IV filing is that the first ANDA filer to challenge a listed patent and prevail, or settle favorably, is entitled to 180 days of generic marketing exclusivity during which no other ANDA filer can receive final FDA approval. That 180-day window is the primary financial incentive driving the generic challenge business model, and tracking which filers have filed, what patents they have challenged, and what the litigation status is provides a forward-looking LOE timeline that is materially more accurate than using nominal patent expiration dates from the Orange Book alone.
The Inflation Reduction Act’s Drug Pricing Provisions: A Structural Shift in the LOE Environment
The Inflation Reduction Act of 2022 introduced Medicare drug price negotiation authority for the first time in the program’s history. CMS negotiated the first cohort of 10 drugs, with negotiated prices effective January 1, 2026. The initial list included Eliquis (apixaban), Jardiance (empagliflozin), Xarelto (rivaroxaban), Januvia (sitagliptin), Farxiga (dapagliflozin), Entresto (sacubitril/valsartan), Enbrel (etanercept), Imbruvica (ibrutinib), Stelara (ustekinumab), and Fiasp/NovoLog (insulin aspart). The negotiated prices represent reductions of 38-79% from the drugs’ Medicare Part D negotiated net prices.
The IRA’s price negotiation mechanism has direct implications for pharmacy economics in Medicare Part D. When the negotiated price for Eliquis drops substantially, the Medicare Part D reimbursement to the dispensing pharmacy changes. Pharmacies that have built margin models around dispensing high-cost branded drugs to Medicare patients will need to recalibrate those models as negotiated prices are implemented. The IRA also requires that negotiated prices be offered at the point of sale in Part D plans, eliminating the copay inflation that results from calculating cost-sharing on high list prices rather than net prices.
The interaction between IRA-negotiated prices and the patent cliff is consequential for drugs on the initial negotiation list. Stelara (ustekinumab) already faced biosimilar entry in 2023, with multiple biosimilars approved including Hadlima (Samsung Bioepis), Wezlana (Amgen), Pyzchiva (Sandoz), and others. The negotiated price for Stelara in Medicare Part D is, in the post-biosimilar-entry environment, largely academic: biosimilar competition has already compressed net prices to the point where the negotiated price may not represent the lowest available cost. But for drugs like Eliquis, where biosimilar entry is anticipated around 2026-2028 depending on Paragraph IV litigation outcomes, the negotiated price creates a pricing ceiling that will affect the commercial environment for biosimilar apixaban manufacturers who are making ANDA filing investment decisions now.
The Biosimilar Interchangeability Designation: Market Access Reality vs. Commercial Expectation
FDA interchangeability designation for a biosimilar allows pharmacists to substitute the biosimilar for the reference biologic at the point of dispensing without a prescriber’s authorization, provided the state pharmacy practice law permits it. The designation requires that the manufacturer complete additional switching studies demonstrating that alternating between the reference product and the biosimilar does not produce a different clinical result than using either product alone. The first interchangeable biosimilar for a given reference product receives one year of interchangeability exclusivity against subsequent interchangeable biosimilar designations.
Cyltezo (adalimumab-adbm, Boehringer Ingelheim) received the first interchangeable biosimilar designation for Humira in October 2021, before the U.S. biosimilar adalimumab market opened in January 2023. Semglee (insulin glargine-yfgn, Mylan/Viatris/Biocon) received interchangeable designation in July 2021, making it the first interchangeable biosimilar for any biologic in the U.S. market.
The commercial reality of interchangeability designation has been more modest than anticipated. Retail pharmacy substitution requires, in most states, that the dispensing pharmacist notify the prescriber and the patient. The notification requirement, combined with patient and prescriber familiarity with the reference biologic, has kept substitution rates at retail below the generic substitution rates that occur almost automatically for small-molecule drugs. At retail chains, biosimilar substitution rates have varied from near zero to mid-single digits for most interchangeable products, with the exception of insulin analogs where historical state laws mandating prescription-level tracking have also been revised.
The practical lesson for manufacturers is that FDA interchangeability designation is a necessary but not sufficient condition for commercial success. The designation matters most at the retail pharmacy level with engaged pharmacists who have both the clinical confidence and the financial incentive to substitute. The financial incentive is the missing piece. Preferred generic substitution programs, which pay pharmacists an incremental dispensing fee for substituting to a preferred generic, have been used successfully in commercial pharmacy networks for small molecules. Analogous models for biosimilar substitution, where the PBM creates a financial incentive for retail pharmacists to substitute to an interchangeable biosimilar, have been slow to emerge because PBMs with affiliated specialty pharmacies prefer to manage biologic volume through their own dispensing channels rather than through retail substitution.
Key Takeaways for Part IV: Patent expiration timing is a deterministic LOE trigger for pharmacies, but the commercial consequences play out through MAC pricing mechanics, PBM formulary decisions, and biosimilar market access dynamics that are not captured by nominal expiration dates alone. IRA negotiated prices create a pricing ceiling in Medicare Part D that will interact with biosimilar entry for drugs on the negotiation list. FDA interchangeability designation provides commercial benefit primarily through retail pharmacy substitution, which is currently limited by notification requirements, pharmacist incentive structure, and the preference of vertically integrated PBMs to route biologic volume through affiliated specialty pharmacy channels.
Part V: Drug Shortages, Audit Exposure, and the Operational Squeeze
The Drug Shortage Crisis: Supply Chain Failures With Commercial and IP Consequences
The FDA’s drug shortage database listed over 250 active drug shortages as of early 2026, a number that has been persistently elevated since the COVID-19 pandemic exposed the structural fragility of the U.S. pharmaceutical supply chain. Sterile injectable generics, including widely used oncology chemotherapy agents, anesthetics, and antibiotics, account for a disproportionate share of shortage events. The core supply chain problem is geographic and economic concentration: the majority of active pharmaceutical ingredient (API) manufacturing for generic sterile injectables is concentrated in a small number of manufacturing sites in India and China, and the economics of generic drug pricing have compressed margins to the point where manufacturers cannot generate sufficient return to invest in redundant manufacturing capacity.
The carboplatin and cisplatin shortage of 2023 is the clearest recent example of how drug shortage dynamics translate into patient care disruptions with real clinical consequences. Both drugs are generic oncology agents used in the treatment of lung cancer, ovarian cancer, testicular cancer, and other solid tumors. Their API is manufactured almost entirely in India. A quality compliance failure at a major API supplier combined with surging demand from a backlog of patients delayed by COVID-19 created a shortage that lasted more than six months and required oncologists to ration chemotherapy, delay treatment initiation, or substitute less effective regimens.
For branded drug manufacturers, drug shortages among generic competitors are a double-edged commercial event. A shortage of a generic competitor to an off-patent product can temporarily restore volume to the branded product that would otherwise have migrated to generic equivalents. But shortages can also create formulary disruption that breaks patient-prescriber-pharmacy relationships in ways that are difficult to rebuild.
The PBM Audit Machine: Clawback Risk as a Systemic Tax
PBM audit activity has intensified substantially over the past decade, driven by the growth of PBM revenue from audit-based clawbacks and the standardization of desk audit processes that can be executed at scale with limited human review. The audit process begins with a data comparison: the PBM’s claims data for a dispensing pharmacy is compared to the pharmacy’s dispensing records, prescription records, and patient data. Discrepancies between the PBM’s records and the pharmacy’s records, even if caused by transcription errors or data formatting differences rather than billing fraud, generate audit findings that the PBM converts into clawback demands.
The economic scale of PBM audit clawbacks has not been comprehensively measured, since PBMs do not disclose aggregate audit recovery figures. Independent pharmacy trade associations have estimated that mid-size independent pharmacies face annual audit demands ranging from $15,000 to more than $100,000. For pharmacies dispensing high volumes of specialty drugs or controlled substances, the exposure is substantially higher.
Pharmacies have limited recourse against audit findings. PBM contracts typically require disputes to be resolved through the PBM’s internal appeals process, with arbitration as the final remedy. The arbitration requirement prevents pharmacies from pursuing class-action litigation or obtaining injunctive relief in court. Several state legislatures have passed laws establishing minimum due process rights for pharmacies in PBM audits, including requiring advance notice of audits, limiting the look-back period for retroactive claims, and prohibiting clawbacks for minor clerical errors that do not affect the clinical accuracy of the dispensing record. But federal preemption under ERISA applies to PBM contracts for self-funded employer plans, limiting the states’ ability to impose requirements on PBMs in that substantial portion of the commercial market.
Pharmacist Clinical Scope Expansion vs. Compensation Stagnation
The scope of practice for U.S. pharmacists has expanded substantially over the past 15 years. Pharmacists in most states are authorized to administer vaccines, including routine adult immunizations and COVID-19 vaccines. Pharmacists in a growing number of states can prescribe naloxone, hormonal contraceptives, and certain over-the-counter medications under collaborative practice agreements or direct prescriptive authority. The PREP Act declaration during the COVID-19 public health emergency authorized pharmacists to order and administer COVID-19 tests and treatments. Several states have authorized pharmacists to test and treat for specific conditions including flu, COVID-19, and strep throat under standing order protocols.
These expanded clinical roles generate patient-level value that is measurable in outcomes data: pharmacist-administered vaccination programs have contributed to materially higher adult flu and COVID vaccination rates. Medication therapy management services delivered by pharmacists in chronic disease populations have been associated with improved adherence, reduced hospitalizations, and lower total cost of care. The published evidence base for pharmacist-delivered clinical services is well-established.
The reimbursement model has not followed the evidence. Pharmacists are still compensated primarily through dispensing fees, which have been flat or declining in real terms for a decade. The professional dispensing fee on a generic prescription from most PBMs ranges from $0.00 to $3.00, which must cover the pharmacist’s clinical time, overhead, and administrative burden associated with that transaction. Medicare Part B reimburses pharmacist-provided medication therapy management at rates that do not reflect the time required for a comprehensive medication review. Pharmacy Quality Alliance metrics used in DIR fee calculations partially compensate pharmacies for outcomes performance, but the payment for outcomes is more than offset by the DIR fees assessed for metrics that fall below threshold.
The economic consequence is a professional workforce that has had its scope of practice expanded by regulators who have not provided the financial mechanisms to compensate for that expansion. Independent pharmacy operators face a business model where the clinical services they provide generate no direct reimbursement, the dispensing services they provide are reimbursed below cost on a significant portion of their volume, and the administrative burden of PBM compliance, audit response, and DIR fee tracking consumes professional time that would otherwise be used for patient care.
Key Takeaways for Part V: Drug shortages are a persistent operational challenge with supply chain root causes that will not be resolved without either regulatory intervention in ANDA pricing economics or significant public investment in domestic API and sterile injectable manufacturing capacity. PBM audit practices create a systemic financial risk that falls disproportionately on independent pharmacies with limited legal recourse. The pharmacist clinical scope expansion has created a workforce with significantly expanded responsibilities that is not compensated for those responsibilities under current reimbursement structures.
Part VI: Pharmacy Sector Restructuring – What Comes Next
The Independent Pharmacy Survival Model in a Consolidated Market
Independent pharmacies that have survived the DIR fee era and the spread pricing environment have generally done so through one of four strategies. The first is concentration in high-margin dispensing niches: specialty pharmacy, compounding, long-term care pharmacy, or HIV/hepatitis C specialty pharmacy, where the dispensing margin is sufficient to sustain the business even in an adverse PBM reimbursement environment for retail generics. The second is geographic insulation, operating in markets where the nearest chain pharmacy or mail-order alternative is sufficiently distant that patients remain on the local dispensing relationship by default. The third is joining a purchasing cooperative or pharmacy services administrative organization (PSAO), which aggregates multiple independent pharmacies to negotiate PBM contracts, obtain group purchasing discounts, and share administrative infrastructure. The National Pharmacy Services Group, Cardinal Health’s EzDispense, and AmerisourceBergen’s Good Neighbor Pharmacy are major PSAO networks. The fourth is clinical service diversification, building a revenue base from disease state management programs, point-of-care testing, and immunization services that generates income outside the PBM reimbursement framework.
None of these strategies is sufficient for all independent pharmacies, and none addresses the structural problem that the entities setting reimbursement rates own competing dispensing operations.
The Mark Cuban/Cost Plus Drug Model and Its Structural Challenge to PBM Pricing
Mark Cuban’s Cost Plus Drugs (officially the Mark Cuban Cost Plus Drug Company), launched commercially in January 2022, has pursued a direct-to-consumer generic drug pricing model that bypasses PBM formulary management entirely. The model prices generic drugs at the manufacturer’s cost plus a 15% markup plus a $3 pharmacy dispensing fee plus a $5 shipping fee, with full price disclosure to the consumer. By August 2024, Cost Plus Drugs had listed over 1,000 generic drugs and had reportedly served over 1 million customers.
Cost Plus Drugs cannot function as a general pharmacy replacement because it does not participate in insurance networks, does not dispense specialty or branded drugs, and does not operate retail locations. But it has demonstrated that the generic drug acquisition cost at manufacturer level is a small fraction of what PBMs charge health plans and consumers under current formulary arrangements. When Cost Plus Drugs lists metformin at $0.02 per pill and a commercially insured patient’s PBM-negotiated copay for the same drug is $10 or $15, the price transparency generated by that comparison creates political and regulatory pressure on PBM practices that would not otherwise exist.
For generic manufacturers, the Cost Plus Drugs model creates both opportunity and pricing pressure. It creates a direct distribution channel that bypasses PBM margin extraction, which is commercially attractive for manufacturers with sufficient volume to support direct-to-patient sales. It creates pricing transparency that compresses the public perception of acceptable generic drug margins, which is commercially challenging for manufacturers who have historically relied on opaque WAC-based pricing to maintain margin.
Telehealth-Integrated Pharmacy Models and the Disintermediation of Traditional PBMs
The 2020-2023 COVID-era telehealth expansion created a direct-to-consumer prescribing and dispensing model that has achieved meaningful scale in several high-volume chronic disease and lifestyle categories. Hims & Hers Health, Ro (Roman Health), Nuo Therapeutics, and similar companies combine telehealth prescribing with pharmacy dispensing through either owned pharmacies or closely affiliated 503A compounding pharmacies. The model generates revenue from patient subscription fees rather than from insurance reimbursement, which removes the PBM intermediary from the revenue equation.
The GLP-1 receptor agonist category became the highest-profile case study in this model during 2023-2025. Semaglutide and tirzepatide, the active ingredients in Novo Nordisk’s Ozempic/Wegovy and Eli Lilly’s Mounjaro/Zepbound respectively, were listed by FDA as being in drug shortage. Under FDA’s shortage policy and 503A compounding regulations, compounding pharmacies are permitted to compound versions of drugs listed in shortage for individual patient prescriptions. Hims & Hers and Ro began prescribing compounded semaglutide and tirzepatide through their telehealth platforms, at prices ranging from $200-400 per month compared to the branded products’ $900-1,400 monthly list prices.
Novo Nordisk and Eli Lilly challenged the legality of this practice, arguing that the shortage designation did not apply to their products (which were in shortage for some presentations but not others), that compounded semaglutide used different salt forms than the branded products, and that the compounding practices violated FDCA restrictions on copying commercially available drugs. The FDA’s Outsourcing Facility regulations add complexity, since 503B outsourcing facilities have different compounding permissions than 503A pharmacies. The legal and regulatory battle over compounded GLP-1 products is ongoing as of early 2026 and has direct IP implications for Novo Nordisk and Eli Lilly’s ability to protect their commercial positions for their highest-revenue products.
Investment Strategy: The compounded GLP-1 market, at its peak, represented a meaningful erosion of potential branded semaglutide and tirzepatide volume. For investors modeling Novo Nordisk and Eli Lilly revenue trajectories, the resolution of the compounding dispute is a material event. FDA’s decision to remove semaglutide from the shortage list, announced in February 2025, requires 503A and 503B compounders to cease compounding semaglutide unless they can demonstrate a documented patient-specific clinical need. Track FDA shortage list updates and 503B facility compliance actions as leading indicators of volume recovery for Wegovy and Ozempic.
Key Takeaways for Part VI: Independent pharmacy survival in a consolidated PBM market requires niche concentration, geographic insulation, cooperative purchasing, or clinical service diversification, and ideally some combination of all four. The Cost Plus Drugs model has created price transparency that generates political pressure on PBM practices without displacing the PBM’s core insurance adjudication function. Telehealth-integrated pharmacy models have demonstrated that the PBM intermediary is displaceable in cash-pay markets, and the GLP-1 compounding dispute has shown that this disintermediation can reach even the highest-revenue branded products when supply constraints create regulatory openings.
Part VII: Legislative and Regulatory Reform Trajectory
Federal Legislative Activity: The PBM Reform Pipeline
Congressional attention to PBM practices has intensified substantially since 2021, driven by constituent pressure on drug prices, state-level reform activity, and the FTC’s expanded investigative focus. The legislative proposals under active consideration include several elements that would structurally alter how PBMs operate.
The Pharmacy Benefit Manager Transparency Act, passed by the Senate Commerce Committee in 2022, would require PBMs to report to CMS data on rebates received from manufacturers, spread pricing retained, and fees charged to pharmacies. The Drug Price Transparency in Medicaid Act would extend spread pricing prohibitions to all Medicaid managed care PBM contracts nationally, building on the state-level reforms in Ohio and Kentucky. The Pharmacy DIR Reform to Reduce Retroactive Fees Act, which informed the CMS rulemaking that took effect in January 2024, has been succeeded by proposals to extend point-of-sale price concession requirements to commercial insurance markets.
The most consequential proposed reform is the rebate pass-through requirement: a mandate that all manufacturer rebates be passed through to patients as copay reductions at the point of sale rather than being retained by the PBM or returned to the plan sponsor for other purposes. This reform would eliminate the core economic incentive that drives high-list-price formulary favoritism. If enacted in commercial markets as well as Medicare, it would force a restructuring of brand drug pricing strategy, manufacturer-PBM negotiation dynamics, and the formulary access model that has governed the commercial biopharmaceutical market for 30 years.
State-Level Reform Activity: The Testing Ground for Federal Policy
States have been the primary laboratory for PBM reform, and their actions provide the clearest preview of what federal reform may eventually require. As of 2025, 48 states had enacted at least one PBM-related law, addressing some combination of spread pricing, DIR fee practices, pharmacy audit procedures, pharmacist gag clauses, or formulary transparency. The most comprehensive state PBM reform packages include Ohio (spread pricing ban for Medicaid, audit due process requirements), Arkansas (PBM licensure requirements with annual reporting), and West Virginia (Medicaid managed care PBM in-house program operated directly by the state rather than through contracted PBMs).
Federal preemption under ERISA limits the applicability of state laws to self-funded employer plans, which account for roughly 60% of commercially insured lives. State reforms primarily affect fully-insured commercial plans and state Medicaid programs. Until federal legislation addresses ERISA-governed plans, state reforms will have incomplete reach in the commercial market.
The IRA’s Long-Term Effect on Market Structure
The Inflation Reduction Act’s price negotiation mechanism, if it survives constitutional challenges (several pharmaceutical manufacturer lawsuits challenging the negotiation process were pending or decided at the district level as of early 2026), will expand to 15 drugs for 2027 and eventually to an unlimited number of drugs selected annually. The selection criteria favor small-molecule drugs that have been on the market for 9 or more years or biologics that have been on the market for 13 or more years without generic or biosimilar competition.
The IRA’s price negotiation mechanism creates a ceiling price in Medicare Part D. For drugs selected for negotiation, the negotiated price replaces market-based price negotiation for Medicare volume, which represents roughly 30% of U.S. branded drug revenues for the affected products. The negotiated price must be offered to all Part D plans; it is not proprietary to a single insurer or PBM. This eliminates the competitive formulary placement dynamic for Medicare volume on negotiated drugs: a PBM cannot offer differentiated formulary placement in Medicare Part D in exchange for a better rebate, because the negotiated price is fixed and uniform.
For manufacturers of drugs that have or expect to receive IRA price negotiation, the strategy implications are significant. Manufacturers have incentives to accelerate LOE events to avoid selection, since generic or biosimilar entry removes the drug from eligibility. Manufacturers also have incentives to invest in new formulations, delivery systems, or combination products that create new regulatory exclusivities and extend the commercial window before negotiation eligibility. These incentives directly reshape the lifecycle management and patent strategy decisions that IP teams must make for late-stage commercial assets.
Key Takeaways for Part VII: Federal PBM reform is advancing through multiple legislative vehicles but faces significant lobbying opposition and ERISA preemption constraints on state-level reforms. The IRA’s drug price negotiation mechanism has already taken effect for 10 drugs and is expanding, creating a government price ceiling for Medicare volume that eliminates rebate-based formulary competition for negotiated drugs. Manufacturers with assets near IRA negotiation eligibility thresholds face lifecycle management decisions that are directly driven by the desire to avoid negotiation selection.
Conclusion: The Distribution System Has a Structural Misalignment Problem
The pharmacist’s economic position is a symptom of a distribution system whose financial architecture has inverted the relationship between clinical value and commercial reward. PBMs receive more revenue when list prices are higher. Formulary access is granted to high-rebate drugs regardless of therapeutic merit. Retroactive fees are imposed on dispensing pharmacies without transparent formulas or proportionate due process. Vertically integrated enterprises steer patient volume toward their own dispensing operations without disclosing the conflict. And none of this is secret. It is documented in FTC reports, state audit findings, Congressional testimony, and academic health economics literature.
For pharma manufacturers, the consequences are concrete. Net price trajectories for branded drugs are determined by PBM negotiations, not by clinical value or list price. Biosimilar market access is constrained by specialty pharmacy steering that is not responsive to FDA interchangeability designations. Formulary decisions made by three entities that collectively control 80% of commercial prescription volume require manufacturers to build commercial models that treat PBM negotiation as a primary market access function.
For institutional investors, the transparency of the problem and the trajectory of reform create a scenario where the current PBM business model carries regulatory and legislative risk that is not fully priced into valuations. UnitedHealth Group, CVS Health, and Cigna each carry significant portions of their enterprise value in PBM and specialty pharmacy operations that could be restructured by pass-through rebate requirements or forced structural separation.
For pharmacists and pharmacy operators, the path forward runs through legislative reform, clinical scope monetization, and niche differentiation. It does not run through competing on dispensing margin with entities that set their own reimbursement rates.
Key Takeaways: Full-Article Summary
Spread pricing in Medicaid generated $223.7 million in single-year PBM extraction in Ohio alone, documented by a state audit, and remains legal and unregulated in commercial markets in most states. Retroactive DIR fees in Medicare Part D grew from $30 million to $12 billion annually between 2010 and 2022 before CMS’s 2024 point-of-sale rule change. The three vertically integrated PBM/insurer/pharmacy enterprises collectively define formulary access, reimbursement rates, and dispensing channel preference for 80% of U.S. prescription volume, and each owns a competing dispensing operation. FDA biosimilar interchangeability designation provides limited commercial benefit at the retail level due to notification requirements and the preference of vertically integrated PBMs to route biologic volume through affiliated specialty pharmacy channels. The IRA’s drug price negotiation mechanism is expanding and creates a uniform government price ceiling for Medicare volume that eliminates rebate-based formulary competition on negotiated drugs. GLP-1 compounding by telehealth-integrated pharmacy models demonstrated that even blockbuster branded drugs are commercially vulnerable when supply shortages create regulatory openings for lower-cost alternatives. Legislative PBM reform is advancing on multiple fronts but faces ERISA preemption constraints that limit state reforms to approximately 40% of the commercial market.
Disclosure: This analysis is based on publicly available regulatory, legislative, litigation, and commercial data. It does not constitute legal advice or investment advice. Specific legal and investment questions should be directed to qualified counsel and licensed financial advisors in the relevant jurisdiction.


")


