The launch price of a new medicine is the most durable, highest-stakes financial decision a pharmaceutical company makes. It is not a marketing exercise. It is the output of a multi-decade strategic process that begins in the discovery lab, runs through the patent office, survives the HTA review committee, and ends at a PBM negotiating table where the other side controls 80% of U.S. prescription claims. Get it wrong, and no amount of clinical brilliance recovers the loss.
This guide is written for the professionals who already know the basics: pharma and biotech IP teams, portfolio managers, R&D leads, BD and M&A counsel, and institutional investors who bet real capital on these decisions. It deconstructs the full pricing architecture, from the mechanics of patent protection and regulatory exclusivity stacking, to the gross-to-net bubble, IRA’s small molecule penalty, HTA methodology divergences between NICE and IQWiG, and the new political negotiation model exposed by the 2025 GLP-1 deals. Case studies on Aduhelm, Humira’s biosimilar war, Zolgensma, and Lyfgenia show how these dynamics play out in practice.
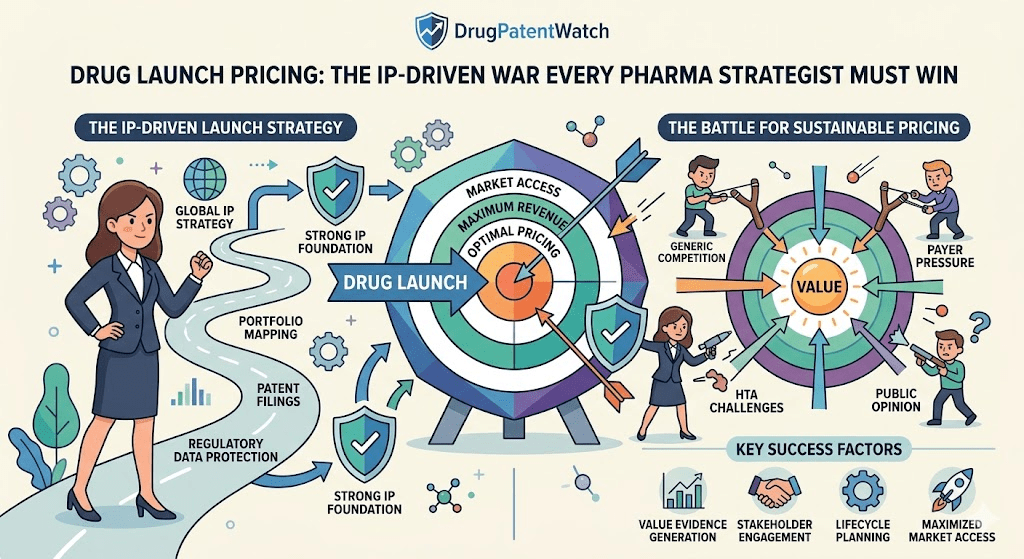
The central argument: the patent is not a switch. It is a data asset. And the quality, type, and remaining duration of that data asset is the primary variable in every serious pricing model.
The Bizarre Economics of Pharma: Why Normal Market Logic Fails Here
The R&D Cost Argument: What It Actually Does and Does Not Justify
The pharmaceutical industry’s public justification for high launch prices is the cost and risk of drug development. The numbers are real. Screening begins with 5,000 to 10,000 compounds. Clinical development spans three phases over 10 to 15 years. Ninety percent of clinical-stage programs fail, and only 12% of drugs entering Phase I ultimately receive FDA approval. Once you capitalize the cost of all the failures that precede each approval, the estimated cost of a single new drug reaches $879 million on the low end, $2.8 billion on the consensus estimate, and as high as $4.5 billion in some models.
What this argument does not do is set any specific drug’s price. No pricing committee at any company opens a meeting by calculating sunk R&D costs and adding a target margin. The R&D imperative is a political and regulatory narrative, an argument to policymakers about why the patent-granted monopoly system should exist and how long it should last. It is an argument about policy, not price.
The empirical record confirms this. A 2020 study published in JAMA found no association between estimated R&D investment and treatment costs, either at list price at launch or net price one year later. Researchers at UC San Diego reached the same conclusion independently. The data point critics use most forcefully: a BMJ analysis covering 1999 to 2018 found that the 15 largest biopharmaceutical companies spent $2.2 trillion on selling, general, and administrative activities (which includes marketing) against $1.4 trillion on R&D over that period. A follow-on analysis of the same cohort from 2009 to 2018 found shareholder payouts (dividends and buybacks) consumed 29% of global revenue while R&D consumed 17%.
For pricing and IP professionals, the right posture toward this data is nuance, not defensiveness. The R&D cost is a sunk cost. It is an input to the policy argument, not the pricing equation. The actual price is set by what a payer can be convinced to pay, which is a function of clinical value, competitive landscape, and the scope of the monopoly the patent system affords.
Inelastic Demand and the Third-Party Payer Distortion
Two structural market features make pharmaceutical pricing unlike any other industry.
Demand for essential medicines is profoundly inelastic. A patient with metastatic non-small cell lung cancer, relapsing-remitting multiple sclerosis, or spinal muscular atrophy does not shop around. There is no “cheaper alternative” consideration that governs the purchase decision. For life-altering or life-saving therapies, price sensitivity is functionally near zero.
The third-party payer system amplifies this. In the vast majority of pharmaceutical transactions, the patient who consumes the drug does not pay the bill. A private insurer, a Pharmacy Benefit Manager, Medicare, or Medicaid absorbs the cost. This severs the normal price-sensitivity feedback loop. The patient has limited incentive to demand a lower-cost alternative. The prescribing physician often has no visibility into cost. The actual payer, the PBM or insurer, is a commercially sophisticated intermediary with its own set of perverse incentives, which we address in full below.
The combined result is a market where price is determined by what the payer can be convinced to bear, and what convinces a payer to bear a high price is, at its foundation, a government-granted monopoly secured through the patent system.
Key Takeaways
The R&D cost argument justifies the patent system as policy. It does not set any individual drug’s price.
Profoundly inelastic demand and the third-party payer structure create a market where price discovery operates through IP-protected monopoly, not competition.
Sunk R&D cost is irrelevant to the pricing equation. Clinical value, competitive landscape, and patent-protected duration are the actual inputs.
The Patent Is the Price: How IP Portfolio Data Anchors Launch Strategy
Loss of Exclusivity as the Financial Model’s Core Variable
The Loss of Exclusivity (LOE) date, the date when key patents expire and generic or biosimilar competitors can enter, is the single most important variable in any pharmaceutical revenue model. Every pricing strategy is, at its core, a calculation designed to maximize revenue before this date arrives.
The data on post-LOE dynamics is unambiguous. Drug prices fall 30% to 80% after patent expiry, depending on the country and product. One longitudinal study tracking drugs across their lifecycle found a median price decrease of 41% within four years of patent expiration. The innovator brand faces rapid market share erosion as multiple generic entrants compete the price down. In the United States, a branded drug can lose 80% to 90% of its prescription volume within 12 months of generic entry.
This is why the LOE date anchors the launch price. A drug with 15 years of protected exclusivity is a categorically different commercial asset than a drug with five years. The difference in pricing power between these two assets is not incremental; it is structural. A shorter exclusivity runway compresses the window for premium pricing and reduces the present value of every future cash flow in the model. An investor who models a drug’s revenue without first establishing the real, risk-adjusted LOE date is working with a broken model.
Composition of Matter vs. the Patent Thicket: Measuring Pricing Confidence
Not all patent protection generates the same pricing confidence, and the gap between strong and weak protection is enormous.
A composition of matter (CoM) patent covers the active pharmaceutical ingredient itself, the core molecule. This is the gold standard. It provides the widest, most defensible legal moat. When a company holds a valid CoM patent on a first-in-class molecule, it can price with full confidence that no competitor can sell the same drug until that patent expires. The CoM patent is the foundation of every premium, value-based pricing strategy.
A patent thicket is a fundamentally different instrument. It is a dense web of secondary patents filed after the core CoM patent, covering formulations, methods of use, delivery devices, and manufacturing processes. No single patent in a thicket is as strong as a CoM patent, but the aggregate aim is to delay generic entry beyond the CoM expiration. AbbVie’s Humira is the canonical example: the core biologics CoM patent expired years before biosimilar entry, but AbbVie’s portfolio of over 100 secondary patents delayed U.S. biosimilar competition until 2023, nearly two decades after the drug’s original launch.
For a pricing team, the distinction matters in a specific way. A drug protected by a strong CoM moat can support a patient, value-anchored premium price with a long strategic runway. A drug protected primarily by a thicket is in a different risk environment. Secondary patents attract more Paragraph IV challenges. They are more likely to be invalidated in litigation. The pricing model for a thicket-protected drug must incorporate a materially higher probability of premature generic entry, which either justifies a higher initial price to capture value faster, a more aggressive managed care contracting strategy, or both.
The Two-Clock System: Patent vs. Regulatory Exclusivity
This is one of the most operationally critical distinctions in pharmaceutical strategy, and it is consistently misunderstood outside legal and regulatory affairs teams.
A drug’s market monopoly is protected by two independent clocks that run simultaneously. The patent clock is administered by the USPTO and protects the invention, typically for 20 years from the filing date. The regulatory exclusivity clock is administered by the FDA and runs from the date of approval. It prohibits the FDA from accepting or approving a generic or biosimilar application that relies on the innovator’s clinical trial data for a defined period, completely independent of patent status.
The FDA exclusivity categories that pricing and BD teams must track:
New Chemical Entity (NCE) exclusivity runs 5 years from approval for a novel small molecule. Orphan Drug Exclusivity (ODE) runs 7 years for a drug treating a disease affecting fewer than 200,000 U.S. patients. A drug can stack these if it qualifies. A new clinical investigation exclusivity of 3 years applies when an approved drug receives a new indication or formulation requiring new clinical trials. Pediatric exclusivity is a 6-month extension added to any existing patent or exclusivity period as a reward for conducting FDA-requested pediatric studies. That 6-month addition sounds minor; on a blockbuster generating $5 billion annually, it represents roughly $2.5 billion in protected revenue.
The operative principle: your real exclusivity ends on whichever date comes last, the patent expiration or the regulatory exclusivity expiration. A drug whose CoM patent expires 8 years post-launch but holds 7-year Orphan Drug Exclusivity is protected until year 7 by the ODE, then by the patent from year 7 to year 8. Conversely, a drug whose NCE exclusivity runs 5 years but whose CoM patent runs 12 years is protected by the patent well beyond the exclusivity window. The revenue model must map both timelines.
IP Valuation as a Core Commercial Asset: Paragraph IV Intelligence
Competitive intelligence platforms that translate patent data into commercial intelligence are not optional tools for a pricing team; they are the analytical infrastructure the function runs on.
The specific data points these platforms surface:
Verified patent expiry dates that account for Patent Term Adjustments (PTA) from the USPTO, which extend patent life to compensate for delays in prosecution, and Patent Term Extensions (PTE) under Hatch-Waxman, which can add up to 5 years to compensate for regulatory review time. A patent expiry date that does not account for PTA and PTE is wrong.
Regulatory exclusivity timelines mapped against patent timelines, so the team can identify the true final expiry and model both clocks correctly.
Paragraph IV (PIV) challenge tracking. A Paragraph IV filing is the statutory mechanism by which a generic manufacturer certifies that the innovator’s listed patent(s) are either invalid or not infringed by the generic product. A PIV filing is a material commercial event. It is the generic’s declaration that they believe they can enter the market before your stated LOE date. The litigation that follows a PIV can take 30 months or longer under the Hatch-Waxman automatic stay, but settlement agreements, when they occur, often define a negotiated market entry date that arrives years before the patent expires. Tracking active PIV litigation and settlement activity is the only way to model whether your patent cliff will arrive on schedule or ahead of it.
Authorized generic and first-filer intelligence. The 180-day exclusivity period granted to the first successful PIV filer creates significant competitive dynamics. Understanding who the likely first generic entrant is, and whether the innovator plans to launch an authorized generic to compete against them, is a material input to the post-LOE revenue model.
Key Takeaways
The LOE date, not the launch date, anchors every pricing decision. A drug with 15 years of exclusivity and a drug with 5 years of exclusivity are different assets at different price points.
CoM patents support confident, premium pricing. Thicket-only protection increases the risk of early generic entry and requires a more aggressive price capture strategy.
Two independent clocks, USPTO patent and FDA regulatory exclusivity, define the true monopoly window. The revenue model maps both.
A PIV challenge is a material event. It signals that the patent cliff may arrive years earlier than the LOE date suggests.
Investment Strategy for Analysts
The first screen in any pharma equity or credit model is the LOE calendar. Pull the drug’s full patent portfolio and regulatory exclusivity stack from a patent intelligence database. Identify all active PIV challenges and their current litigation status. If a settlement exists, find the negotiated entry date and use that as the revised cliff date. Adjust your revenue forecasts down for any years that will be lost to early generic entry. Apply a higher discount rate to cash flows protected only by secondary, thicket-style patents, reflecting the elevated risk of successful challenge. A company whose near-term revenue is heavily concentrated in drugs with active, undisclosed PIV litigation is a materially riskier investment than its headline LOE calendar suggests.
Pricing Model Architecture: Value-Based, Competitor-Referenced, and the Clinical Design Trap
Value-Based Pricing: The Only Framework That Justifies a Premium
Value-Based Pricing (VBP) is the dominant framework for innovative, first-in-class medicines. Its mechanic is direct: the price is set based on the value the drug delivers to patients, payers, and the healthcare system, not on manufacturing cost or R&D expenditure.
Value in this framework is quantified across several dimensions. Superior clinical efficacy (longer survival, higher response rate, durable remission), improved tolerability (fewer hospitalizations, lower discontinuation rates), quality-of-life improvements, and system-level cost offsets (reduced emergency department utilization, avoided surgeries, shorter hospital stays) all contribute. A drug that extends median overall survival by six months in a metastatic cancer indication where no other drug has done so has a definable value. A drug that prevents hospitalizations in a heart failure population has a definable value. VBP attempts to price the drug at or below that value.
The strategic use case for VBP is narrow but decisive: it is the only model that justifies a premium price for a genuinely innovative drug. It requires the manufacturer to generate evidence of clinical superiority or meaningful differentiation before the pricing conversation begins.
Competitor-Based Pricing and the First-in-Class vs. Me-Too Split
When a drug is not the first in its class, the pricing framework shifts. Competitor-based pricing benchmarks the new drug against existing therapies and sets the price based on relative clinical performance.
A drug with demonstrated clinical superiority over the current standard of care earns a premium: it prices above the competitor it beats. A drug that shows equivalent efficacy and safety earns parity pricing. A drug entering a crowded class without a clear differentiator prices at a discount to gain formulary access and steal volume. These are not arbitrary commercial choices; they follow directly from the clinical evidence package.
The critical variable is not which model you choose. It is which model your clinical data forces you into.
The Clinical Data Trap: How Trial Design Locks In Your Price
This is the most underappreciated cross-functional concept in pharmaceutical pricing. The single most important pricing decision a company makes is often not made by the pricing team. It is made by the R&D team when they write the Phase III protocol.
A superiority trial is designed to prove that the new drug is statistically better than the current standard of care on a clinically relevant endpoint (overall survival, progression-free survival, complete remission rate). These trials are expensive, take longer to enroll, and carry a real risk of failure. When they succeed, they produce the golden ticket: hard evidence that justifies a premium, value-based price. The pricing team now has a scientifically defensible argument to take to every payer, HTA body, and P&T committee: this drug is clinically better.
A non-inferiority trial is designed only to prove that the new drug is no worse than the current standard. These trials are cheaper, enroll faster, and have higher success probabilities. They are pragmatic choices for programs with genuine clinical reasons to prefer the new molecule (a better side-effect profile, a more convenient dosing schedule, a mechanism that avoids a specific safety concern) even without superiority on the primary endpoint.
The trap: the moment the R&D team commits to a non-inferiority design, they have preemptively forfeited the ability to claim a premium price. No payer, when reviewing a non-inferiority dossier, will agree to pay more for a drug that the sponsor chose not to prove is better. The VBP argument collapses. The pricing team is locked into parity or discount pricing in a competitor-based framework. That trial design decision, made three to five years before launch, carries a multi-billion dollar commercial consequence that cannot be unwound.
R&D and commercial teams must align on this before Phase III design is finalized. The question is not “what trial can we run?” It is “what evidence does our pricing strategy require, and can we generate it?”
Outcomes-Based Agreements: The Gene Therapy Frontier
For ultra-high-cost, potentially curative therapies, neither VBP nor competitor-based pricing is workable as a stand-alone model. The “sticker shock” of a $2 million or $3 million one-time price is less an economic problem than an actuarial one: payers cannot budget for a catastrophic per-patient event that may not deliver the promised curative value.
Outcomes-Based Agreements (OBAs), also called pay-for-performance contracts, address this by distributing the financial risk between manufacturer and payer over a defined outcome measurement period. The full mechanism, and its application to Zolgensma and Lyfgenia, is detailed in the case studies below.
Key Takeaways
VBP is the only framework that supports a premium price. It requires clinical superiority data, not clinical equivalence.
A non-inferiority trial design forecloses VBP. This is an R&D decision with a commercial consequence that must be made cross-functionally.
Competitor-based pricing is determined by data, not strategy. You price at premium, parity, or discount based on what the clinical package proves.
OBAs are the access mechanism for cell and gene therapies. Manufacturers who cannot accept outcome-linked rebates will face formulary exclusion.
The Value Gauntlet: ICER, NICE, IQWiG, and the HTA Methodology Divide
The QALY and the ICER: Speaking the HTA Language
Health Technology Assessment bodies are the gatekeepers for public reimbursement in most major markets. A negative HTA recommendation is not merely a pricing problem; it is a market access denial. Understanding how these bodies measure value is the prerequisite for designing evidence that survives their review.
Most HTA bodies outside Germany use the Quality-Adjusted Life Year (QALY) as their primary benefit metric. One QALY equals one year of life in perfect health. A drug that extends life by one year at 80% quality of life generates 0.8 QALYs. The QALY collapses both survival and quality-of-life data into a single number, enabling economic comparison across disease areas.
The Incremental Cost-Effectiveness Ratio (ICER) is the calculation that HTA bodies use to determine value. The formula: the difference in cost between the new drug and the comparator, divided by the difference in QALYs between the new drug and the comparator. The result is a “cost per QALY gained” figure that HTA bodies compare against a country-specific willingness-to-pay (WTP) threshold.
In the United Kingdom, NICE uses a threshold of roughly £20,000 to £30,000 per QALY, with a higher “end of life” threshold of up to £50,000 for drugs treating conditions with short life expectancy. In the United States, the Institute for Clinical and Economic Review (ICER) applies a range of $50,000 to $200,000 per QALY in its analyses, with the lower end more commonly cited in practice. A drug whose ICER clears the threshold is recommended for reimbursement. A drug above the threshold faces either pricing negotiation pressure or outright rejection.
NICE vs. IQWiG: The Methodology Divide That Requires Two Separate Dossiers
The most consequential HTA divergence for global launch strategy is the difference between the UK’s NICE and Germany’s IQWiG/G-BA system.
NICE runs an economic evaluation. Its core question is: is this drug cost-effective relative to the current standard of care? The answer requires a robust health-economic model demonstrating the drug’s ICER falls below the WTP threshold. Clinical data is the input to the economic model; the economic model is what gets reviewed.
IQWiG, and the G-BA (Federal Joint Committee) that governs German market access, explicitly rejects cost-per-QALY analysis. German law does not permit the QALY to be used as a decision criterion. The IQWiG Early Benefit Assessment (EBA) is a clinical evaluation, full stop. The G-BA’s sole question: does this new drug provide an added clinical benefit over the current established standard of care? Benefit must be demonstrated on patient-relevant endpoints: mortality, morbidity, or health-related quality of life. Economic evaluation plays no formal role in the EBA.
The G-BA categorizes the level of added benefit across six categories: major, considerable, minor, non-quantifiable, no proof, and no added benefit. The category assigned becomes the primary determinant of the subsequent price negotiation between the manufacturer and the statutory health insurance association (GKV-Spitzenverband). A finding of major or considerable added benefit gives the manufacturer significant pricing latitude. A finding of no added benefit means the drug is reimbursed at the cost of the cheapest comparator therapy, effectively at a generic price level, regardless of the drug’s list price.
The strategic implication: a company planning a simultaneous UK and Germany launch needs two evidence packages designed for two fundamentally different review criteria. Designing an HTA submission for NICE will not work for IQWiG, and vice versa.
ICER as the U.S. ‘Shadow HTA’
The United States has no formal government HTA with price-setting authority over the entire private market. Into this gap, ICER has established itself as the de facto shadow HTA. ICER is an independent, non-profit organization that produces publicly available value assessments of new, high-cost drugs using a QALY-based methodology with value-based price benchmarks anchored to WTP thresholds between $50,000 and $200,000 per QALY.
ICER has no legal authority. What it has is credibility with payers. PBMs and commercial insurers use ICER reports as third-party ammunition in formulary and rebate negotiations. A manufacturer launching an expensive drug with weak clinical evidence will face an ICER report that calculates a value-based price far below the launch price, and that report will be in the hands of every major PBM’s medical director within weeks of publication. The Aduhelm case study below illustrates what happens next.
ICER (United States)
NICE (United Kingdom)
IQWiG / G-BA (Germany)
Role
Independent watchdog; no legal authority but high payer influence
Government-affiliated; recommendations binding in England and Wales
IQWiG conducts EBA; G-BA decision binding for price negotiation
Methodology
Economic (cost-effectiveness)
Economic (cost-effectiveness)
Clinical (comparative added benefit)
QALY used?
Yes
Yes
No; explicitly rejected
Threshold
$50,000 to $200,000/QALY
~£20,000 to £30,000/QALY (higher for end-of-life)
None; benefit level determines negotiating position
Price impact
Informs PBM rebate negotiations
Sets bar; high ICER forces confidential discount to access
‘No added benefit’ = reimbursed at comparator generic price
Key Takeaways
The QALY and ICER formula are the operative language for NICE and ICER assessments. Clinical data is the input; the economic model is what gets reviewed.
IQWiG rejects QALY entirely. The EBA is a clinical review of added benefit over the current standard of care. A finding of ‘no added benefit’ effectively sets price at the generic level.
A global launch team needs two evidence dossiers: an economic dossier for NICE, a clinical superiority dossier for IQWiG.
ICER is not a regulator, but its reports are PBM weapons. A negative ICER report triggers formulary restrictions and rebate demands.
The Payer Wall: PBMs, the Gross-to-Net Bubble, and the Patient Cost Paradox
PBM Market Structure and the Formulary Weapon
Pharmacy Benefit Managers are the most powerful intermediaries in the U.S. drug distribution system, and the most consequential variable in any domestic pricing strategy. Three PBMs, CVS Caremark, Cigna’s Express Scripts, and UnitedHealth’s OptumRx, control approximately 80% of all U.S. prescription drug claims. This concentration gives them non-negotiable leverage over manufacturers.
PBMs create formularies, the lists that determine which drugs are covered at which tier. Tier placement drives patient utilization. A drug on Tier 1 (preferred) with a $10 copay gets prescribed. A drug on Tier 3 (non-preferred) with a $75 copay gets substituted. Formulary exclusion, removal from the covered drug list entirely, means the drug is functionally inaccessible to patients on that plan. The formulary is the PBM’s primary weapon, and they use it to extract rebates.
Rebates are confidential, per-unit payments that manufacturers pay to PBMs in exchange for preferred formulary placement. The rebate negotiation is the commercial equivalent of an HTA review: the manufacturer presents clinical and economic evidence to justify why their drug should occupy a preferred tier, and the PBM extracts a financial concession in return.
The Gross-to-Net Bubble: $334 Billion and Growing
The gap between a drug’s publicly announced list price (the Wholesale Acquisition Cost, or WAC) and the actual net revenue the manufacturer retains after rebates, discounts, and fees is the gross-to-net bubble. In 2023, this bubble reached a record $334 billion. More than half of that total went to rebates and fees paid to PBMs.
For branded drugs in high-competition classes, the difference between list and net is enormous. In the insulin market, list prices increased over 300% across multiple years while net prices barely moved, with the entire nominal price increase captured by PBMs and insurers through larger rebates. A manufacturer looking at its insulin list price and thinking it represents revenue is misreading the P&L.
The Perverse Incentive: Why PBMs Prefer High List Prices
The mechanism is counterintuitive but mathematically precise. PBM rebates are almost always calculated as a percentage of the list price. A high list price generates a larger absolute rebate, which the PBM uses in two ways: it passes a portion back to the insurer client as proof of its negotiating value, and it retains a portion as administrative fee or spread pricing revenue.
The result: a drug that launches with a simple, transparent $300 net price and zero rebate is commercially disadvantaged relative to a drug that launches at $1,000 list price with a 70% rebate structure. Both drugs produce $300 in net manufacturer revenue. The $300 drug offers the PBM nothing. The $1,000 drug gives the PBM $700 to work with. PBMs will systematically favor the high-list/high-rebate drug on their formularies, regardless of the clinical equivalence between the two products.
This is the mechanism that inflates U.S. list prices across the entire branded market. It is not greed operating in isolation; it is a rational commercial response to a structurally perverse incentive. Manufacturers who do not play the rebate game lose formulary access.
Who Pays: The Patient Cost Paradox
Patient cost-sharing, whether through deductibles or coinsurance, is almost always calculated on the list price, not the net price. A patient on a 20% coinsurance plan pays 20% of the WAC, not 20% of the post-rebate net price the insurer paid.
The implication: in the high-list/high-rebate example above, the patient pays $200 (20% of $1,000 WAC) while the insurer’s actual net cost for the drug is $300 less the patient’s $200 contribution, or $100. The insurer captured the $700 rebate and collected $200 from the patient in coinsurance, effectively making a profit on the drug. The patient on the ostensibly “expensive” $1,000 drug pays $200 out of pocket; the patient on the simpler $300 drug pays $60. The patient is financially harmed by the system that is nominally protecting them.
This dynamic has driven legislative and regulatory attention. The IRA’s Inflation Reduction Act provisions on out-of-pocket caps for Medicare Part D ($2,000 annual cap effective 2025) and the shift of manufacturer rebates in Medicare toward point-of-sale discounts for patients are direct responses to this patient cost paradox.
Key Takeaways
Three PBMs control 80% of U.S. prescription claims. Formulary placement is the commercial outcome. Rebates buy that placement.
The gross-to-net bubble reached $334 billion in 2023. For many drugs, the WAC is an opening bid, not a price.
PBMs structurally prefer high-list/high-rebate drugs. A transparent low net price is a commercial disadvantage under current market structure.
Patient coinsurance is calculated on list price, not net price. The bubble’s financial harm falls disproportionately on patients.
Investment Strategy for Analysts
For portfolio companies with heavy U.S. branded drug exposure, the gross-to-net ratio is a critical financial health metric. A manufacturer reporting robust WAC growth while net price growth lags is giving back value to the PBM channel. For drugs in competitive classes with multiple branded alternatives (e.g., PCSK9 inhibitors, GLP-1s, IL-17/23 inhibitors), the rebate rate required for formulary access is typically highest and the gross-to-net spread is widest. Model net price, not list price. Gross-to-net expansion is margin destruction.
The Global Chessboard: International Reference Pricing and Launch Sequencing
How IRP Works and Why It Creates Price Contagion
International Reference Pricing (IRP), also called External Reference Pricing (ERP), is a price control mechanism used by the majority of EU member states, as well as Japan, Canada, and Australia. A government sets its own drug price by referencing the prices charged in a defined basket of other countries, typically at the average or lowest price within the basket.
The commercial risk this creates is price contagion: a low price granted in any one reference country propagates to all other countries whose baskets include it. A manufacturer who launches first in Portugal at a low price to capture a smaller but accessible market can inadvertently anchor prices downward across two dozen other markets that reference Portugal. Each subsequent reference country then becomes a new anchor for the next tier of countries in their baskets.
The scale of potential value destruction is significant. A drug that could command $80,000 per year in Germany, the EU’s largest market, may be anchored to a $20,000 price if a low-price launch in a peripheral market has already propagated into Germany’s reference basket.
Strategic Launch Sequencing as the Only Rational Response
The logical counter to IRP-driven price contagion is strategic launch sequencing: launching first in markets that either do not participate in reference pricing or that other countries reference upward.
The standard sequencing logic for global launches:
Launch first in the United States. The U.S. has no national reference pricing mechanism and no government-imposed price controls in the commercial market. U.S. prices are the highest in the world and serve as a positive anchor that other countries cannot access in their reference baskets (most IRP systems explicitly exclude U.S. prices from their reference baskets).
Launch second in Germany. Germany’s pricing system, as described above, does not use IRP in its initial benefit assessment phase. The GKV price negotiation is based on the level of added benefit, not on what other countries pay. Germany is the EU’s largest market and a critical commercial prize; its price, once set, becomes a reference for many other European markets.
Launch later, sometimes significantly later, in smaller markets with low WTP thresholds that sit in the reference baskets of high-value markets. A company may deliberately delay launch in Greece, Portugal, or Poland by years if early pricing in those markets would contaminate German, French, or Italian prices.
The ethical tension this creates is real and acute. IRP, a tool designed to make drugs more affordable by leveraging collective negotiating power, creates a rational business incentive to deny or delay access to innovative medicines in lower-income markets. The patients most dependent on broad market access are systematically deprioritized in the launch sequence. This is the unintended consequence that IRP’s architects did not adequately model.
Key Takeaways
IRP is used by the majority of EU countries plus Japan, Canada, and Australia. A low price in any reference country propagates through the basket.
Price contagion is the primary global pricing risk. One early low-price launch can permanently suppress prices across dozens of markets.
The rational commercial response is launch sequencing: U.S. and Germany first, peripheral low-WTP markets last or delayed.
IRP’s unintended consequence is deliberate access delay in lower-income markets, exactly the opposite of its policy intent.
The New Earthquake: How the IRA Rewrote the Small Molecule Business Model
The Mechanism: Medicare’s First Real Price-Setting Power
The Inflation Reduction Act of 2022 gave the U.S. government authority it had been explicitly prohibited from exercising since Medicare Part D launched in 2006: the ability to set prices for drugs covered under Medicare. The Drug Price Negotiation Program targets “qualifying single source drugs,” brand-name medicines with no generic or biosimilar competition that rank among Medicare’s highest total expenditure products.
The first 10 Part D drugs selected in 2023 include Eliquis (Bristol-Myers Squibb/Pfizer), Jardiance (Boehringer Ingelheim/Eli Lilly), Xarelto (Johnson & Johnson), Januvia (Merck), Farxiga (AstraZeneca), Entresto (Novartis), Enbrel (Amgen), Imbruvica (AbbVie/Johnson & Johnson), and Stelara (Johnson & Johnson). Their new Maximum Fair Prices (MFPs) take effect January 1, 2026, with reported price reductions estimated between 25% and 65% from current net prices.
The “negotiation” is not bilateral negotiation in the commercial sense. The government sets a ceiling. Manufacturers who refuse to accept the MFP and do not withdraw their drug from Medicare face excise taxes starting at 65% of gross sales, escalating to 95% of gross sales if the standoff continues. No manufacturer can absorb a 95% excise tax. Acceptance of the government’s price is the commercial outcome.
The Small Molecule Penalty: A 9-Year vs. 13-Year Clock
The most consequential provision in the IRA for pharmaceutical R&D investment is not the negotiation itself. It is the asymmetric “safe harbor” the law created between small molecules and biologics.
Small molecule drugs (pills, tablets, conventional oral dosage forms) become eligible for IRA price negotiation 7 years after FDA approval, with the negotiated price taking effect 9 years post-approval. Biologics (large molecule injectables and infusions) become eligible 11 years after approval, with the negotiated price taking effect 13 years post-approval.
The 4-year difference is commercially devastating for small molecules, because the 9-to-13-year post-approval window is a drug’s peak revenue period. The drug has completed its ramp-up. Managed care access is established. Prescriber habits are embedded. Pre-LOE erosion has not yet begun. This is the period of maximum cash flow.
IQVIA analysis quantifies the damage: for a typical first-in-class small molecule, the 9-to-13-year period represents approximately 38% to 40% of total lifetime net sales. The IRA has effectively removed 38% to 40% of the expected return on investment from every small molecule drug currently in development.
The Chilling Effect: R&D Investment Is Already Shifting
The investment consequence was immediate and measurable. A longitudinal study published in 2024 analyzed post-IRA enrollment in post-approval oncology clinical trials, the trials that generate new indications and expand revenue in the peak window. For small molecule oncology drugs, monthly post-approval trial enrollment dropped 43.6% to 45.3% after the IRA’s passage. For biologics, the comparable reduction was 8.4%, a non-statistically significant change.
R&D capital is moving. Biologics, with their 13-year safe harbor, now carry a structurally better return profile than small molecules on a risk-adjusted basis, independent of any scientific consideration. An R&D executive or portfolio committee now has a fiduciary argument to deprioritize a promising first-in-class pill in favor of a large-molecule alternative that clears the IRA clock by four additional years. A law designed to reduce drug costs has created a non-scientific incentive that penalizes the most common and patient-friendly form of medicine.
The policy implication is significant. Small molecules are cheaper to manufacture, easier to administer orally, and represent the foundation of global access in lower- and middle-income markets where biologic cold chains are not feasible. Systematically deprioritizing small molecule investment to avoid the IRA’s 9-year clock damages both innovation economics and global health equity.
Key Takeaways
The IRA’s first 10 negotiated drugs take effect January 1, 2026, with estimated price cuts of 25% to 65%.
Small molecules face price negotiation 9 years post-approval; biologics face it at 13 years. The 4-year gap covers a drug’s peak revenue window.
IQVIA estimates the 9-to-13-year period represents 38% to 40% of first-in-class small molecule lifetime sales. The IRA has vaporized that expected return.
Post-IRA post-approval clinical trial enrollment for small molecules dropped 43% to 45%. R&D investment is already migrating toward biologics.
Investment Strategy for Analysts
The IRA’s 9-year clock is now a mandatory input in any small molecule DCF model. For drugs approved after 2022, project IRA-level pricing beginning in year 9. Apply the government’s historical MFP discount (25% to 65% of net price) to Medicare revenue from that year forward. For drugs with heavy Medicare exposure (e.g., cardiovascular, diabetes, CKD), this is a material revenue haircut. Adjust your rNPV accordingly. Biologics with equivalent clinical profiles now carry superior financial projections on this variable alone. This is a legitimate basis for relative valuation differences between pipeline assets.
Case Studies: Aduhelm, Humira, GLP-1s, and the $3M Gene Therapy Model
Aduhelm (Biogen): What Happens When You Skip the Value Gauntlet
Biogen launched aducanumab (Aduhelm) in June 2021 at an annual list price of $56,000 for Alzheimer’s disease. The commercial rationale was the enormous unmet need in a disease affecting 6 million Americans and the FDA’s Accelerated Approval, which was granted over the near-unanimous objection of the agency’s own scientific advisory committee. The FDA approved based on a surrogate endpoint, reduction in amyloid-beta plaque burden, rather than demonstrated clinical benefit.
The clinical data was the problem. Two Phase III trials produced conflicting results: EMERGE showed a statistically significant slowing of clinical decline in the high-dose arm; ENGAGE failed. Biogen withdrew an earlier interim analysis that had initially suggested futility for both trials. The clinical community’s skepticism was deep and vocal.
ICER published its assessment rapidly. After reviewing the conflicting trial data and the absence of demonstrated clinical benefit on patient-relevant endpoints, ICER calculated a value-based price range of $3,000 to $8,400 per year. Not $56,000. Between $3,000 and $8,400.
Medicare responded to the clinical controversy and the ICER analysis with a Coverage with Evidence Development (CED) policy, restricting Aduhelm coverage to patients enrolled in randomized controlled trials. This was functionally a coverage denial for the commercial market. Biogen cut the price to $28,200. The drug’s commercial trajectory never recovered. Biogen ultimately discontinued Aduhelm’s development.
The lesson is unambiguous: FDA approval is a necessary condition for launch, not a sufficient condition for market access. In an era where ICER reports reach PBM medical directors within weeks, a drug whose clinical evidence does not support its launch price will face formulary rejection before the commercial ramp begins.
Humira’s Biosimilar War: Thicket Tactics and PBM Vertical Integration
Humira (adalimumab, AbbVie) is the best-selling drug in pharmaceutical history, with peak annual revenues above $20 billion. AbbVie’s IP strategy extended exclusivity in the U.S. more than two decades beyond the drug’s initial launch in 2002 through a portfolio of over 100 secondary patents covering formulations, concentrations, and methods of use. The original CoM biological patent expired years before biosimilar competition arrived.
AbbVie reached patent litigation settlements with biosimilar developers (including AbbVie settlement agreements with Boehringer Ingelheim, Coherus, and others) that granted negotiated U.S. entry dates in 2023. When that dam broke, the market structure that emerged illustrated both the post-LOE competitive dynamics and the PBM power play.
Biosimilar entrants adopted two distinct pricing strategies. Yusimry (Coherus) launched at an 85% discount to Humira’s WAC. Hadlima (Organon/Samsung Bioepis) launched with a high list price designed to generate rebates. The formulary outcomes were revealing: CVS Caremark gave preferred status to Cordavis Hyrimoz, a biosimilar it sources from Sandoz under a private-label arrangement. Cigna’s Express Scripts favored biosimilars marketed by its subsidiary, Quallent Pharmaceuticals. Both major PBMs chose the product that maximized their own economics, which in both cases was the product they owned or controlled.
AbbVie itself retained significant formulary access through its own rebate negotiations, and its net price erosion in the first 12 months of biosimilar competition was less severe than many analysts projected. But the structural shift was real: PBMs are no longer just intermediaries. They are vertically integrated market participants who can manufacture, brand, and preferentially distribute competing products while simultaneously controlling the formulary that determines which products reach patients.
For any brand manufacturer watching its LOE approach, the Humira case is the current benchmark. The PBM channel will not protect your brand out of loyalty; it will choose the product that maximizes PBM economics.
GLP-1s: The 2025 Political Negotiation Model That Bypassed PBMs
Semaglutide (Ozempic/Wegovy, Novo Nordisk) and tirzepatide (Mounjaro/Zepbound, Eli Lilly) launched with list prices in the range of $1,000 to $1,350 per month. Their commercial trajectory generated the most politically visible drug pricing controversy in a decade. The international price disparity was stark and repeatedly cited: Wegovy cost approximately $88 per month in Denmark against over $1,200 in the United States for the same product from the same company.
President Trump’s fixation on this disparity produced a novel outcome in November 2025: the administration negotiated directly with Novo Nordisk and Eli Lilly, bypassing the PBM system entirely, to deliver Medicare coverage for the obesity indication and a price of $245 per month for Medicare beneficiaries. Uninsured patients gained access through TrumpRx.gov at approximately $350 per month, trending toward the $245 target.
The manufacturers accepted the price cut in exchange for what they had sought for years: Medicare coverage of the obesity indication. An estimated 7 million Medicare-eligible adults with obesity had been excluded from GLP-1 coverage under existing policy. The trade was price for volume, at a scale that makes the aggregate revenue math potentially favorable despite the per-unit cut.
The commercial model this establishes is new: for high-volume, politically exposed blockbuster drugs with large Medicare populations, direct government negotiation is now a demonstrated pathway. The PBM intermediary was cut out. The price was set through political negotiation rather than formulary management. Manufacturers who operate in this price/volume zone must now model political negotiation as a genuine pricing scenario, not a theoretical risk.
Zolgensma and Lyfgenia: The Outcomes-Based Agreement as the Only Viable Access Model
Novartis launched onasemnogene abeparvovec (Zolgensma) for spinal muscular atrophy (SMA) in 2019 at $2.125 million, making it the most expensive drug in history at the time. Bluebird bio launched betibeglogene spartacus (Lyfgenia) for sickle cell disease (SCD) in 2023 at $3.1 million, displacing Novartis from the top position.
Both drugs present the same actuarial challenge for payers. The one-time cost is catastrophic on a per-patient basis. Medicaid covers approximately 50% of all SCD patients, and Medicaid programs operate with annual budget constraints that make a $3.1 million single-patient event financially impossible to absorb at scale without structural payment reform.
Bluebird addressed this directly by designing Outcomes-Based Agreements before the commercial launch. Under the Lyfgenia OBA structure, payers agreed to pay the $3.1 million price subject to a performance period of three years. The primary endpoint is hospitalization for vaso-occlusive events (VOE), the primary clinical manifestation of SCD. If a patient receiving Lyfgenia is subsequently hospitalized for VOE within the three-year window, it signals the therapy has not delivered its curative promise. Bluebird’s contractual obligation under the OBA is to pay a significant rebate back to the payer for each qualifying hospitalization event.
The practical implementation is non-trivial. Outcomes-based contracting requires robust data infrastructure: patient registries, claims data linkage, outcome adjudication processes, and contractual frameworks that survive insurer changes and patient mobility. The federal government’s Cell and Gene Therapy Access Model (CGTAM), a Center for Medicare & Medicaid Innovation (CMMI) initiative, is developing a standardized multi-payer OBA framework for exactly this purpose, targeting state Medicaid programs that lack the administrative capacity to negotiate bespoke OBAs independently.
Zolgensma’s commercial access was supported by a similar logic, with Novartis offering an installment payment option that spreads the $2.125 million cost over five annual payments, conditional on the drug maintaining its clinical effect. If the patient loses therapeutic benefit, Novartis stops collecting remaining installments.
The general principle that both cases confirm: for therapies priced above $1 million, manufacturers who are not willing to absorb outcome-linked financial risk will not achieve broad formulary access. The payer community has collectively decided that catastrophic one-time costs require shared risk, and any manufacturer who launches a gene therapy without an OBA framework pre-built is launching into formulary exclusion.
Key Takeaways
Aduhelm: FDA approval without clinical superiority evidence produces an ICER takedown and payer rejection. The value gauntlet comes after regulatory approval, not before.
Humira: The PBM channel is now a competitive threat. PBMs are building vertical integration to capture the post-LOE biosimilar market themselves. Thicket strategies buy time; they do not prevent the cliff.
GLP-1s: High-volume, politically exposed blockbusters now face direct government negotiation as a pricing scenario. Price-for-volume is the emerging deal structure.
Gene therapies: OBAs are the access mechanism, not an optional add-on. Outcome-linked rebates tied to patient-relevant clinical endpoints are the price of formulary inclusion.
The Strategic Data Playbook: Actionable Guidance by Stakeholder
R&D and Clinical Teams: Price Starts in the Discovery Lab
The commercial team cannot sell clinical evidence that the R&D team did not generate. Pricing strategy starts at discovery.
Patent landscape analysis before committing to a target identifies true white space versus crowded “me-too” territory. A drug entering a class with five marketed agents and a dozen in Phase III is not a VBP candidate regardless of how well the trial is designed; the competitive reference frame will set the price.
The IRA clock is now a core scientific variable in program selection. A promising small molecule and a comparable biologic approach to the same target carry different expected return profiles under post-IRA economics. The 4-year difference in the negotiation safe harbor is a financial variable that belongs in the program selection scorecard alongside probability of technical success.
Trial design commits the program to a pricing strategy years before launch. A non-inferiority design is a binding commercial decision as much as a scientific one. Quantify the revenue consequence of the pricing strategy that each trial design enables, and make the design choice with full visibility into that consequence.
Business Development and M&A: IP Due Diligence as Revenue De-Risking
In pharmaceutical M&A, the patent portfolio is not collateral. It is the asset. The revenue stream being acquired is the patent-protected monopoly. IP due diligence is the process of determining whether that monopoly is real, durable, and unencumbered.
The formal IP due diligence process for a pharma acquisition covers:
Freedom-to-Operate (FTO) analysis. Does the target drug infringe on a third party’s broader patent? A patent grants the right to exclude others; it does not grant the right to practice the invention if a broader patent blocks it. An FTO problem discovered post-close is a catastrophic commercial and legal liability.
Chain of title. Does the company actually own the patents it claims to own? Clean transfer from the university or research institution where the drug was discovered, with properly executed assignments from all inventors, is a legal prerequisite for patent validity. Broken chain of title renders the patent unenforceable.
Claim quality. Were the patent office’s initial broad claims rejected during prosecution, forcing the inventors to narrow them? Narrow claims are easier for competitors to design around. Prosecution history is public and must be reviewed.
Maintenance fee payment history. Patents lapse if maintenance fees are not paid on schedule. A lapsed patent is unrecoverable. This is a basic but critical check.
Active litigation and PIV status. What challenges are already in flight? Are there pending IPR (Inter Partes Review) petitions at the USPTO that could invalidate the patents administratively, outside of district court litigation?
IP Law Firms and Legal Counsel: Building the Revenue-Protecting Fortress
IP counsel’s role has expanded from patent prosecution and litigation to proactive commercial strategy. The best-positioned IP firms operate as integrated members of the commercial team, not as a downstream service provider who files what they are told to file.
Proactive LOE strategy begins years before the cliff. The defensive patent thicket, formulation patents, method-of-use patents for new indications, and device patents for new delivery systems, must be built while the CoM patent is still producing cash flow. AbbVie did not build Humira’s thicket reactively; it was a deliberate, multi-year offensive filing campaign that began a decade before the CoM patent’s expiry.
PIV monitoring as a commercial early warning system. When a generic files a PIV challenge, IP counsel must immediately assess the merits with commercial input. Not every PIV challenge should be litigated; some should be settled on commercially rational terms that grant the generic a defined market entry date in exchange for early commercial certainty. The decision to litigate or settle is a business decision, not a purely legal one, and IP counsel must frame it as such.
Cross-functional alignment on patient switch strategies. When the CoM patent expires, innovators frequently shift patients to an improved, reformulated version of the drug that is protected by newer patents (extended-release formulations, fixed-dose combinations, or subcutaneous versions of previously IV-administered drugs). These strategies require IP filings that anticipate and support the commercial switch years in advance. Legal, R&D, and commercial must co-design the product lifecycle strategy.
Investors and Financial Analysts: The LOE Calendar as the Revenue Model
For pharmaceutical equity and credit analysis, the patent portfolio is not a legal document. It is a financial schedule.
The fundamental discipline: build the revenue model around the real LOE date, not the headline patent expiry date. Pull patent and regulatory exclusivity data from an intelligence platform. Map both clocks. Identify the true final exclusivity date. Then subject it to stress tests.
A PIV challenge is a material event that should trigger a formal probability-weighted scenario in the model. If the generic’s case has merit (weak claims, strong prior art arguments, narrow prosecution history), assign a meaningful probability to an early entry date. Discount the probability-weighted cash flows from the original LOE date to the potential early entry date. This is the risk premium that weak IP protection deserves.
IRA eligibility is a mandatory parameter for any drug approved after 2022 with significant Medicare exposure. Model IRA pricing beginning in year 9 for small molecules, year 13 for biologics. Apply the government’s published MFP structure. For drugs with cardiovascular, diabetes, or renal indications (historically the highest-Medicare-exposure categories), the IRA revenue haircut is material.
The IP strength index: a drug’s rNPV should incorporate a qualitative assessment of portfolio strength. A single strong CoM patent with no active PIV challenges warrants a lower discount rate than a thicket-protected drug with four active PIV filings and a weak claim history. Patent quality is a financial risk variable, and it should be modeled as one.
The Future of Drug Pricing: Four Converging Forces
The pricing landscape for pharmaceutical innovation is now shaped by four forces operating simultaneously, often in opposition.
Evidence-based value requirements are non-negotiable. ICER, NICE, IQWiG, and an expanding set of national HTA bodies globally will not accept price claims unsupported by comparative clinical evidence. The evidence bar is rising, not falling. The standard of care that your drug must beat is a moving target as competitive innovation continues.
Payer leverage is consolidating. Three PBMs control 80% of U.S. prescription claims. They are vertically integrating into biosimilar manufacturing and private-label distribution. The formulary is increasingly a political instrument as well as a commercial one, as the GLP-1 negotiations demonstrated.
Political will is an active pricing variable. The IRA established government price-setting in Medicare. The Trump administration demonstrated that political negotiation outside the statutory IRA framework is also viable for high-profile targets. Manufacturers who operate blockbuster drugs in Medicare-heavy indications must now model political negotiation as a pricing scenario.
IP-protected duration is the ultimate anchor. All pricing power, regardless of its specific model or mechanism, rests on the legal monopoly the patent system grants. That monopoly has a defined end date. The quality of the IP portfolio, the durability of its claims against challenge, the breadth of its thicket, and the accuracy of the financial model built on top of it determine whether the years of protected revenue are maximized or squandered.
The companies that win the pricing war in this environment are not those with the most sophisticated commercial organizations alone. They are the organizations that integrate their legal, R&D, and commercial strategies from the first days of discovery, treat the patent portfolio as the core financial asset it is, and model the LOE date, the PBM negotiation, and the IRA clock with the same rigor they apply to Phase III trial design.
The patent is the price. Every decision that precedes and follows from it should be made with that premise at the center.
Key Takeaways Summary
The launch price is an IP strategy output, not a commercial add-on. The LOE date is the most important variable in the revenue model, and it must be built from real patent and regulatory exclusivity data, not headline figures.
The R&D cost of $2.8 billion is a policy narrative. No pricing committee uses it to set a specific drug’s price. Clinical value and competitive landscape are the actual inputs.
A superiority trial is the only path to a premium, value-based price. A non-inferiority trial design is a binding commercial decision that forecloses premium pricing. This choice must be made cross-functionally before Phase III begins.
The gross-to-net bubble reached $334 billion in 2023. U.S. list prices are opening bids, not prices. Rebates are the commercial mechanism, and PBMs structurally prefer high-list/high-rebate structures. Patient coinsurance is calculated on the inflated list price, which is where the patient harm concentrates.
The IRA’s 9-year small molecule negotiation clock eliminates an estimated 38% to 40% of lifetime net sales for first-in-class pills. Post-approval clinical trial enrollment for small molecules dropped 43% after the IRA’s passage. R&D capital is already moving toward biologics.
NICE and IQWiG require two fundamentally different evidence dossiers. NICE is an economic review built on QALY models. IQWiG is a clinical review that explicitly rejects the QALY. A single dossier does not satisfy both.
IRP creates price contagion. A low price in a small reference market propagates through dozens of countries’ baskets. The rational commercial response is launch sequencing: U.S. and Germany first, peripheral markets last or delayed.
Gene therapies require Outcomes-Based Agreements to achieve formulary inclusion at multi-million-dollar price points. Manufacturers who launch without OBA frameworks face formulary exclusion, particularly in Medicaid.
Paragraph IV challenges are material events that require financial modeling, not just legal response. A strong PIV case by a generic filer is a signal that the patent cliff may arrive years ahead of the stated LOE date. Track PIV activity and model the probability-weighted early entry scenario.
Frequently Asked Questions
What is the IRA’s ‘small molecule penalty’ and why does it matter?
The IRA created two different timelines for government price negotiation based on drug type. Small molecule drugs (pills) reach the negotiation window 9 years post-approval. Biologics reach it at 13 years. Because years 9 through 13 represent a drug’s peak revenue period, covering approximately 38% to 40% of a first-in-class small molecule’s lifetime net sales by IQVIA’s estimate, this 4-year difference is commercially devastating for pills. It has already produced a measurable shift in post-approval clinical trial investment away from small molecules.
How does regulatory exclusivity differ from a patent, and why do both matter?
A patent is granted by the USPTO and protects the invention (the molecule, formulation, or method) for approximately 20 years from the filing date. Regulatory exclusivity is granted by the FDA upon approval and bars generic applications from relying on the innovator’s clinical trial data for a defined period (5 years for a new chemical entity, 7 years for orphan drugs). These two systems are independent. Your true market monopoly ends on whichever date comes last. A drug whose CoM patent expires in year 8 but holds orphan drug exclusivity for 7 years is protected by the exclusivity through year 7, then by the patent from year 7 to year 8. Revenue modeling that ignores one of the two clocks is incomplete.
Why do drug companies launch with high list prices instead of just setting a low, transparent net price?
Because PBM formulary access requires rebates, and rebates are calculated as a percentage of list price. A $300 transparent net price with no rebate structure gives PBMs no margin to work with and no “savings” to show to their insurer clients. A $1,000 list price with a 70% rebate produces the same $300 net revenue for the manufacturer but gives the PBM a $700 pool to monetize. PBMs systematically favor high-list/high-rebate drugs on their formularies. A manufacturer who launches at a transparent low net price without a rebate structure loses formulary access. The gross-to-net bubble is structurally embedded in the PBM’s business model.
What is the key difference between how NICE and IQWiG assess a new drug?
NICE runs an economic evaluation centered on cost-effectiveness. It asks whether the drug’s cost-per-QALY ratio falls below the willingness-to-pay threshold of approximately £20,000 to £30,000 per QALY. IQWiG conducts a clinical evaluation and explicitly rejects the QALY as a decision criterion. It asks only whether the new drug provides added clinical benefit over the current standard of care, measured on patient-relevant endpoints. A finding of no added benefit in Germany results in pricing at the comparator’s generic level, regardless of the drug’s list price.
How does a Paragraph IV filing affect a financial model?
A Paragraph IV filing is a generic manufacturer’s public challenge to the innovator’s listed patents, certifying that the patents are either invalid or not infringed by the generic product. It signals the generic believes they can enter the market before the stated LOE date. If the innovator files suit within 45 days, a 30-month litigation stay begins. The ultimate outcome (litigation win for the innovator, loss, or settlement) determines whether the original LOE date holds or whether the cliff arrives earlier. For investors, a PIV challenge requires a probability-weighted revenue scenario that discounts cash flows for the probability of early generic entry at each projected entry date the litigation might produce.


")


