In 2019, a mid-sized generic pharmaceutical company committed $340 million to develop a generic version of a branded proton pump inhibitor. The brand’s primary patent had expired. Market projections looked clean. The regulatory path appeared straightforward. Eighteen months later, the company received notice of a patent infringement suit citing four patents it had either overlooked or deliberately discounted—two formulation patents, one process patent, and a method-of-use patent that the company’s legal team had flagged as “low risk.” The litigation ran for four years. The company ultimately settled, paid licensing fees, and launched the product years behind its original schedule, entering a market that had already been claimed by three competitors.
The story is not unusual. What’s unusual is how rarely it gets told openly.
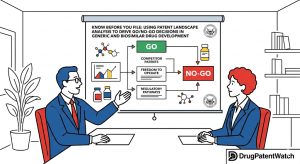
Patent landscape analysis—the systematic mapping of all intellectual property surrounding a target drug compound, its formulations, manufacturing methods, delivery mechanisms, and clinical uses—sits at the precise point where legal strategy, business development, and competitive intelligence converge. When it’s done well, it saves companies hundreds of millions of dollars and years of development time. When it’s skipped, abbreviated, or handed to a junior analyst with a free database subscription, the consequences can end careers and sink product lines.
This article is a practical guide to doing it right. It covers the mechanics of patent landscape analysis for both generic small-molecule drugs and biosimilars, explains the data sources and analytical frameworks that inform sound go/no-go decisions, walks through real case studies where intelligence failures created catastrophic delays, and shows the operational steps that separate companies that consistently win first-to-file positions from those that perpetually play catch-up.
What a Patent Landscape Actually Contains
Most pharmaceutical professionals know that branded drugs are protected by patents. Fewer understand just how many patents can surround a single compound—and how strategically those patents are stacked.
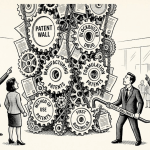
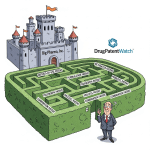
The average blockbuster drug carries between 40 and 100 patents by the time its first generic challenger files an Abbreviated New Drug Application (ANDA). The original compound patent—the one that expires first and gets the most attention—is typically just the beginning. Around it, brand manufacturers construct what scholars call a “patent thicket”: a dense cluster of overlapping patents covering formulations, dosage forms, drug delivery systems, manufacturing processes, metabolites, polymorphs, combinations, and specific methods of use [1].
The purpose of the thicket is not simply to protect innovation. Its primary commercial function is to extend market exclusivity well past the expiration of the base compound patent. Pharmaceutical companies have become highly sophisticated at this. Research published in the Journal of Law and the Biosciences found that nearly 80% of new drug patents granted in a sample period were for modifications to existing drugs rather than new active pharmaceutical ingredients [2]. These secondary patents—sometimes called “evergreening” patents—can extend effective market exclusivity by 10 to 15 years beyond what the original compound patent would have provided.
Understanding this landscape requires looking beyond the compound itself. A complete patent landscape for a small-molecule generic candidate includes:
Compound patents: Cover the active pharmaceutical ingredient (API) in its base chemical form. These typically expire first and signal the opening of the generic window—but almost never define its actual arrival.
Salt and polymorph patents: Cover specific crystalline or amorphous forms of the compound, which can affect solubility, bioavailability, and manufacturability. Some polymorphs have genuine clinical relevance; many exist primarily to generate patent coverage after the base compound patent ages.
Formulation patents: Cover the specific mixture of active and inactive ingredients in a commercial product. These are often the stickiest patents for generic developers because reformulating around them while maintaining bioequivalence is technically difficult.
Process patents: Cover manufacturing methods for producing the API or the finished dosage form. These are frequently invisible to developers focused only on product patents, and their infringement often occurs before a single pill reaches a patient.
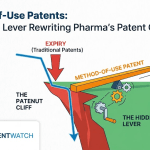
Method-of-use patents: Cover specific therapeutic applications of the compound. In the United States, the FDA’s Orange Book lists only patents the brand holder certifies as covering the approved use of the drug—but method-of-use patents for unapproved indications can still support infringement claims.
Delivery system patents: Cover drug delivery technologies such as osmotic pumps, extended-release matrices, transdermal patches, or liposomal encapsulation. These are particularly common in drugs where delivery technology is central to clinical differentiation.
Combination patents: Cover fixed-dose combinations of two or more active ingredients. When a brand manufacturer releases a combination product shortly before a key compound patent expires, the combination patent can delay generic competition for the new formulation even as the monocomponent product faces competition.
A thorough landscape identifies all of these. It maps expiration dates, identifies relevant legal status (issued, pending, challenged, licensed, or expired), and flags which patents are listed in the FDA’s Orange Book or Purple Book—because listed patents trigger mandatory Paragraph IV certification and the 30-month litigation stay that comes with it.
The Generic Drug Path: Mechanics and Patent Risk
The Hatch-Waxman Act of 1984 created the legal framework for generic drug approvals in the United States. It established the ANDA pathway, created Orange Book patent listing requirements, and set up the Paragraph IV certification system that allows generic manufacturers to challenge branded drug patents before they expire.
Understanding this system is prerequisite knowledge for anyone conducting patent landscape analysis on a generic drug candidate. The framework creates specific, predictable points of patent risk that can be mapped in advance.
How the ANDA Pathway Creates Patent Exposure
When a generic manufacturer files an ANDA, it must certify its position with respect to each patent listed in the Orange Book for the reference listed drug (RLD). The four possible certifications are:
Paragraph I: The patent information has not been filed
Paragraph II: The listed patent has expired
Paragraph III: The ANDA applicant will not launch until the patent expires
Paragraph IV: The listed patent is invalid, unenforceable, or will not be infringed by the generic
A Paragraph IV certification is the mechanism by which generic manufacturers challenge active patents. It triggers immediate notification to the patent holder, who then has 45 days to file suit. If suit is filed, the FDA automatically imposes a 30-month stay on ANDA approval—meaning the agency will not grant final approval for 30 months, regardless of whether the drug is otherwise ready for market [3].
The 30-month stay is not a minor inconvenience. It is a commercially significant delay that brand manufacturers can trigger on every Orange Book-listed patent covering a drug. A brand product with five Orange Book patents could, in theory, trigger five sequential 30-month stays—though courts have placed limitations on this in practice. More realistically, a product with multiple listed patents creates multiple litigation fronts that must be managed in parallel, at substantial legal cost and business risk.
The first generic manufacturer to file an ANDA with a Paragraph IV certification against a specific patent earns 180 days of marketing exclusivity once it resolves the litigation or the patent expires. This “first-filer” advantage is commercially enormous—180 days with no generic competition means the first filer captures the majority of generic market share before a flood of competing generics arrives. Companies that correctly identify go windows and file first earn dramatically higher returns than companies that file second or third [4].
All of this means that patent landscape analysis for a generic candidate must accomplish two specific things before a go/no-go decision gets made: it must map every Orange Book-listed patent, and it must independently assess non-listed patents that could support infringement claims outside the Hatch-Waxman framework.
The Orange Book Is Not the Whole Picture
The Orange Book lists patents that the brand holder has certified as covering the approved drug product. Brand holders have legal obligations around what they list, but the system is imperfect. Some patents that arguably cover a drug are not listed. Some patents that are listed are subject to significant invalidity arguments. The Orange Book is a starting point, not a complete landscape.
Patent landscape professionals use tools like DrugPatentWatch to go beyond the Orange Book. DrugPatentWatch aggregates patent data, ANDA filing information, exclusivity status, and litigation records in a structured format that allows analysts to identify both listed and unlisted patents covering a compound, track the litigation history of Paragraph IV challenges, and benchmark a target drug against comparable products that have already gone through the generic entry process.
The value of a platform like DrugPatentWatch lies not only in the data it aggregates but in the connections it makes visible. Knowing that a specific patent was challenged in prior Paragraph IV litigation—and knowing whether the challenger prevailed—provides direct intelligence about patent strength that no standard patent database delivers. That historical litigation data is the difference between a theoretically complete landscape and one that has been stress-tested against adversarial legal scrutiny.
Identifying the Real Expiry Cliff
The phrase “patent cliff” implies a clean, predictable event: the patent expires, the generic enters, the brand loses market share. Reality is considerably messier.
For most major branded drugs, the effective patent cliff is not a single date. It’s a range of dates corresponding to the expiration of different patent types, each of which may need to be cleared, licensed, or successfully challenged before a generic can actually launch. Mapping this range—and identifying the specific sequence in which patents expire—is one of the core tasks of landscape analysis.
Three factors complicate the picture in ways that many analysts underestimate.
Pediatric exclusivity grants six additional months of market exclusivity to brand manufacturers that conduct FDA-required pediatric studies. This six-month extension applies to all patents and existing market exclusivity periods for the drug—not just the study-related use. For a blockbuster drug with a compound patent expiring in 2026, pediatric exclusivity could push the generic entry window to late 2026. That six-month delay is commercially significant; it typically represents hundreds of millions of dollars in branded sales for major products.
New chemical entity (NCE) exclusivity provides five years of market protection from the date of first approval for drugs containing an active moiety not previously approved by the FDA. NCE exclusivity runs independently of patent expiration. An ANDA can be filed after four years of NCE exclusivity (to trigger the five-year clock), but cannot be approved until the full five years elapse unless a Paragraph IV challenge is filed and litigation does not result in a stay. For drugs that were recently approved, NCE exclusivity may define the go window more precisely than any patent expiration date.
Regulatory exclusivities outside the patent system—including new formulation exclusivities, new indication exclusivities, and orphan drug exclusivities—can further extend the brand’s effective market protection. These are not patent rights and cannot be challenged through Paragraph IV certification, but they create FDA-imposed approval delays that affect the practical timeline for generic entry.
A landscape that reports only patent expiration dates without mapping these additional exclusivities will produce a go window estimate that is systematically too optimistic.
Biosimilar Patent Landscapes: A Different Battlefield
The analytical framework for biosimilar competitive intelligence shares the same basic logic as generic drug analysis—map the patents, assess the risks, model the timelines—but the execution is substantially more complex. Biologics are larger, more structurally intricate molecules produced in living cells, and their patent protection reflects that complexity.
The Biologics Price Competition and Innovation Act (BPCIA) of 2010 created the biosimilar approval pathway in the United States. It established the Purple Book as the reference listing for biologics and created the “patent dance”—a formal information exchange process between biosimilar applicants and reference product sponsors that governs how patent disputes get resolved.
The Reference Product Complexity Problem
Generic drugs must demonstrate bioequivalence to their reference listed drug: the same active ingredient, same dosage form, same route of administration, and comparable pharmacokinetic profiles. If the generic achieves bioequivalence, it’s considered clinically equivalent to the brand.
Biosimilars face a different standard. A biosimilar must demonstrate that it is “highly similar” to the reference product, with no clinically meaningful differences in safety, purity, or potency. The FDA’s guidance acknowledges that minor structural differences—inherent in biological manufacturing—are permissible as long as they don’t affect clinical performance. But establishing “high similarity” requires an extensive analytical and clinical evidence package that typically costs between $100 million and $300 million and takes seven to ten years to assemble [5].
This complexity creates a distinctive patent risk profile. Because biosimilar developers must reverse-engineer a biological product without having access to the originator’s manufacturing process, they face potential infringement claims not just for product patents but for process patents covering manufacturing methods they may independently develop. The originator may hold dozens of patents covering specific cell lines, purification steps, formulation methods, and analytical testing procedures—none of which are obvious from the final product’s clinical profile.
The FDA’s Purple Book lists reference product sponsors and their biologics, but provides less patent-specific information than the Orange Book does for small molecules. Analysts must independently identify relevant patents through a combination of patent database searches, literature review, Freedom to Operate (FTO) analysis, and intelligence on the originator’s patent prosecution history.
The Patent Dance and Its Strategic Implications
The BPCIA’s patent dance is a sequential information-sharing process that begins when a biosimilar applicant submits its application to the FDA. Under the statutory framework:
Within 20 days of FDA filing acceptance, the biosimilar applicant must provide its application and manufacturing information to the reference product sponsor.
Within 60 days of receiving that information, the reference product sponsor identifies patents it believes would be infringed by the biosimilar product.
The parties then negotiate which patents will be the subject of immediate litigation (the “immediate list”) and which will be addressed later (the “later list”).
If the parties cannot agree on an immediate list, there are statutory default provisions that determine which patents get litigated first.
The patent dance creates both opportunities and risks for biosimilar developers. It forces early disclosure of manufacturing details to the reference product sponsor—information that could theoretically inform their own product development or their litigation strategy. It also allows biosimilar applicants to narrow the litigation landscape early, focusing resources on the most commercially critical patents rather than defending against an undifferentiated mass of IP claims.
Competitive intelligence analysis of the patent dance requires understanding not just which patents a reference product sponsor holds, but how they have deployed those patents in prior biosimilar litigations. A sponsor that consistently pursues aggressive process patent claims has a different risk profile than one that focuses primarily on formulation patents—and a biosimilar developer’s manufacturing process choices should reflect that intelligence.
Interchangeability: The Premium That Compounds Risk
The BPCIA created a second tier of biosimilar approval beyond “biosimilar” designation: “interchangeable” designation. An interchangeable biosimilar has met additional FDA requirements demonstrating that it can be substituted for the reference product at the pharmacy level without prescriber intervention, just as a generic drug can be substituted for its branded equivalent.
Interchangeability is commercially valuable because it allows automatic substitution in states that permit it—which, as of early 2026, includes most U.S. states. The first biosimilar to achieve interchangeable status for a given reference product gets a period of exclusivity against other interchangeable biosimilars. This exclusivity structure mirrors the 180-day first-filer exclusivity for generics, though the duration and conditions differ.
The additional data requirements for interchangeability—primarily a switching study demonstrating that patients can switch between the reference product and the biosimilar without adverse effects—mean that interchangeability applicants must conduct additional clinical trials. These trials take time and money, but they also create an additional point of patent exposure: methods of use covering switching regimens could theoretically support infringement claims against a biosimilar developer conducting interchangeability studies.
The commercial calculus on interchangeability is not obvious. For highly competitive biosimilar markets—adalimumab, for example, where roughly 13 biosimilars were approved by 2025—interchangeability status may be necessary to achieve meaningful market penetration. For markets with fewer biosimilar entrants, the additional cost of pursuing interchangeability may not justify the premium.
Patent landscape analysis should model both scenarios: the cost and timeline of pursuing interchangeability, including its patent risk profile, versus launching as a non-interchangeable biosimilar with a potentially narrower market position but fewer litigation triggers.
Building a Patent Landscape: Methodology That Works
Patent landscape analysis is not a literature search. Sophisticated practitioners use a multi-layered methodology that combines database searches, regulatory filings, litigation records, and industry intelligence to construct a complete picture of the IP environment around a target product.
The Search Layer
The foundation of any landscape is a comprehensive patent search. Analysts search across multiple databases—USPTO, EPO Espacenet, WIPO PATENTSCOPE, and commercial databases—using keyword, classification, and structure-based queries.
A common weakness in landscape analyses is over-reliance on keyword searching. Patents are drafted by attorneys who have strong incentives to use broad, non-obvious claim language. A compound that is commercially known as “atorvastatin” may appear in patents under dozens of chemical names, structural designations, and claim formulations. An analyst who searches only for “atorvastatin” will miss a substantial portion of the relevant patent universe.
Best practice combines:
Chemical structure searching: Using tools like SciFinder, Reaxys, or STN to identify all patents that claim the target compound or its structural analogs, regardless of the name used to describe them.
IPC/CPC classification searching: International Patent Classification and Cooperative Patent Classification codes allow analysts to retrieve all patents in a given technology area, which can surface relevant process patents, delivery system patents, and formulation patents that would never appear in compound-name searches.
Citation forward/backward analysis: Examining which patents cite a key reference patent (forward citations) and which patents a key reference cites (backward citations) maps the intellectual lineage of the technology and surfaces related patents that may not have been captured in keyword searches.
Assignee-based searching: Searching by the brand manufacturer’s name and its subsidiaries, licensing partners, and contracted research organizations identifies the full scope of their patent portfolio, including patents they may not have chosen to list in the Orange Book.
The Regulatory Layer
Patent searches find patents. Regulatory analysis connects those patents to the specific FDA-approved product.
Orange Book analysis begins with the listed patents for the RLD, but extends to an examination of the brand manufacturer’s complete ANDA litigation history. If the brand has previously sued Paragraph IV filers, that litigation record—publicly available through court dockets—reveals which patents they have actually litigated, which arguments they have advanced, and whether they have prevailed or settled.
This litigation history is analytical gold. A patent that has never been litigated provides no direct evidence of strength; a patent that has been litigated five times and survived each challenge is presumptively stronger. Conversely, a patent that was litigated and found invalid represents a cleared path for subsequent ANDA filers, though the exact scope of that clearing depends on whether the invalidity finding was broad enough to cover the new filer’s product.
DrugPatentWatch’s litigation tracking function is particularly valuable here. The platform aggregates Paragraph IV litigation outcomes, settlement terms (where public), and ANDA filing histories in a way that allows analysts to identify not just the patent landscape for a specific drug but the entire competitive landscape—how many other generic manufacturers have already filed, how far along their applications are, and what patent challenges they have launched. This competitive intelligence directly informs go/no-go decisions: a market where five generic manufacturers have already filed and two have settled licenses is a fundamentally different opportunity than one where no ANDA has been filed against a compound patent expiring in two years.
The Freedom to Operate Layer
Freedom to Operate (FTO) analysis differs from patent landscape analysis in its objective. A patent landscape asks: “What patents exist around this product?” An FTO analysis asks: “Can we make, use, and sell this specific product without infringing any of those patents?”
FTO analysis requires claim-by-claim evaluation of the relevant patents against the proposed product’s attributes. It is inherently a legal analysis, requiring input from patent attorneys, but it is informed and shaped by the technical inputs from the landscape analysis. A landscape that has failed to identify all relevant patents will produce an FTO opinion that overstates clearance.
The typical output of an FTO analysis is a “clearance letter” or “FTO opinion” that rates the infringement risk for each identified patent as high, medium, or low, and recommends a course of action for each risk category. High-risk patents require a strategy: challenge validity, design around the claim, negotiate a license, or abandon the project. Medium-risk patents require monitoring and contingency planning. Low-risk patents require documentation of the reasoning to support the conclusion.
A rigorous FTO process for a complex drug with 60 relevant patents may take three to six months and cost $500,000 to $2 million in legal fees. That sounds expensive until you compare it to the cost of a 30-month litigation stay, which, for a major product, represents a foregone revenue opportunity typically measured in the hundreds of millions of dollars.
Patent Thickets: How They’re Built and How to Navigate Them
The patent thicket is the branded pharmaceutical industry’s most effective—and most criticized—competitive strategy. Understanding how these thickets are constructed, where they are vulnerable, and how successful generic and biosimilar developers navigate them is the operational core of competitive intelligence.
The Construction of a Thicket
A well-constructed pharmaceutical patent thicket unfolds over time, typically tracking the drug’s regulatory and clinical development trajectory. The pattern is consistent across therapeutic categories.
In the early stage, the brand manufacturer files a compound patent (or patents) covering the API. These are the “genus” patents that claim the broadest possible scope—often covering an entire chemical class rather than a single compound.
As the drug advances through clinical trials and the mechanism of action becomes better understood, the brand files narrower “species” patents targeting the specific compound that shows the most promise. These species patents often claim specific crystal forms (polymorphs), salts, hydrates, or solvates that optimize the compound’s pharmaceutical properties.
Before and around FDA approval, formulation work generates a second wave of patents. These cover the specific combination of excipients that stabilizes the compound, enhances bioavailability, or enables a specific delivery mechanism. Extended-release formulations—which allow once-daily dosing in drugs that would otherwise require twice or three-times-daily administration—generate particularly robust patent coverage because the extended-release technology is commercially valuable and technically complex.
After approval, as the drug’s commercial success becomes clear, the brand files a third wave of patents targeting clinical applications and combinations. New indication patents claim specific patient populations, dosing regimens, or treatment combinations that were defined by post-approval studies. These patents may have genuine clinical grounding, but their patent filing dates coincide suspiciously with the approaching expiration of first-generation compound patents.
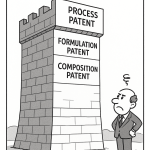
The result is a layered structure in which the compound patent expires, the formulation patents expire a few years later, the delivery system patents expire a few years after that, and the method-of-use patents run to the end of the horizon. A generic manufacturer that defeats the compound patent through a Paragraph IV challenge may still need to clear five more layers to achieve a commercially viable launch.
Case Study: AstraZeneca and Nexium
The history of AstraZeneca’s esomeprazole (Nexium) illustrates patent thicket construction with unusual clarity because it has been documented in multiple court proceedings.
Omeprazole (Prilosec), the parent compound, lost its compound patent protection in 2001. Esomeprazole is the S-enantiomer of omeprazole—essentially, one “handedness” of the same molecule. AstraZeneca filed compound patents on esomeprazole, formulation patents on its specific magnesium salt and its trihydrate form, and process patents on the asymmetric synthesis method used to produce it enantioselectively.
Generic challengers argued that esomeprazole was obvious in light of the prior art on omeprazole. After extensive litigation, the U.S. Court of Appeals for the Federal Circuit upheld the compound patent in 2014, finding that the unexpected superior efficacy of esomeprazole over a racemic mixture of omeprazole was not obvious [6]. This decision extended AstraZeneca’s effective protection and is frequently cited in discussions of enantiomer patent strategy.
The esomeprazole case is instructive because it shows how a technically derived compound—one that a skilled organic chemist would have found straightforward to produce given the parent compound—can survive an obviousness challenge when its clinical properties are sufficiently differentiated. For generic landscape analysts, it demonstrates that a patent that looks vulnerable on paper may survive litigation, and that clinical differentiation data held by the brand can strengthen apparently weak patents during litigation.
Case Study: AbbVie and Adalimumab (Humira)
The adalimumab patent situation represents biosimilar patent thicket construction at its most elaborate. As documented by I-MAK (Initiative for Medicines, Access & Knowledge) and confirmed through FDA records, AbbVie built a portfolio of more than 250 patents around Humira, covering the antibody formulation, manufacturing processes, dosing regimens, delivery devices (the pre-filled pen), and combinations with other drugs [7].
The original compound patents would have permitted biosimilar competition to begin around 2016 in the United States. Instead, the combination of formulation patents, device patents, and AbbVie’s willingness to file suit against every biosimilar entrant pushed effective U.S. competition out to 2023. In Europe, where the patent landscape was less favorable to AbbVie and regulatory frameworks differ, biosimilar competition began in 2018.
The adalimumab case produced one clear data point for biosimilar competitive intelligence: settlement licensing was the dominant exit mechanism. AbbVie licensed several major biosimilar manufacturers on terms that allowed U.S. market entry beginning in 2023, rather than litigating to final judgment. This outcome—reached because AbbVie’s forward-looking patent position was weaker than its filed patent count suggested—illustrates the importance of not counting patents as equivalent units of market protection. A portfolio of 250 patents, many of which are arguably invalid or unenforceable, provides less real protection than 20 strong, well-drafted patents covering core formulation and process innovations.
Analysts who evaluated the adalimumab landscape in 2015 using raw patent counts would have concluded that biosimilar entry before 2030 was nearly impossible. Analysts who evaluated patent claim scope, prosecution history, and prior art in the relevant technologies would have reached a more nuanced—and more accurate—conclusion.
Data Sources That Drive Competitive Intelligence
A patent landscape is only as good as the data sources it draws from. Sophisticated analysts combine primary patent database searches with specialized pharmaceutical intelligence platforms to produce landscapes that are both technically complete and commercially actionable.
Primary Patent Databases
USPTO’s Patent Full-Text and Image Database (PatFT and AppFT) provides free access to all U.S. patents and patent applications. PatFT covers issued patents back to 1976 in full text and includes image files for earlier patents. AppFT covers published U.S. patent applications—those filed after November 2000 that have been published but not yet granted.
WIPO PATENTSCOPE covers international patent applications filed under the Patent Cooperation Treaty (PCT), which is the mechanism most pharmaceutical companies use for filing globally. PCT applications are published 18 months after filing, which means there is an 18-month period during which a company’s patent application is not publicly visible—a structural intelligence gap that analysts must account for.
EPO Espacenet covers European Patent Office applications and provides access to patents from over 100 countries, including significant pharmaceutical patent jurisdictions like Japan, China, India, and Brazil.
Google Patents integrates data from multiple patent offices and provides a cleaner user interface than most primary databases, but its completeness and update frequency lag behind primary sources.
Specialized Pharmaceutical Platforms
DrugPatentWatch provides structured pharmaceutical patent intelligence that goes well beyond raw patent data. The platform aggregates Orange Book listings, ANDA filing data, Paragraph IV certification histories, litigation outcomes, and exclusivity status in a format designed for business decision-making rather than legal research. For a competitive intelligence professional evaluating a specific drug target, DrugPatentWatch provides the ability to see how many other generic manufacturers have already filed ANDAs, which patents have been challenged, and what outcomes those challenges produced.
The platform’s value is particularly high for benchmarking: if you’re considering filing an ANDA on Drug X, you can examine the complete Paragraph IV litigation histories for five structurally similar drugs that have already gone through the generic entry process. That historical data provides calibrated risk estimates that no purely analytical approach can match.
Evaluate Pharma / EvaluatePharma Intelligence provides commercial forecasting data that allows patent landscape findings to be directly connected to market opportunity. Knowing that a drug generates $4 billion in U.S. annual revenue and faces patent expiry in 36 months is a different business case than knowing the same about a $200 million product. The financial modeling that supports go/no-go decisions requires market size data that patent databases don’t contain.
Cortellis (Clarivate) provides integrated pharmaceutical intelligence including clinical trial data, regulatory history, and patent information. For biosimilar analysis, the ability to link a reference product’s clinical development history to its patent portfolio is analytically valuable because clinical trials often generate novel data that supports follow-on patent filings.
Derwent Innovation (Clarivate) provides enhanced patent analysis capabilities including patent family identification, forward citation tracking, and patent strength scoring. For mapping the global scope of a patent portfolio—identifying which countries a brand manufacturer has filed equivalent patents in—Derwent’s patent family data is essential.
Court Records and Regulatory Filings as Intelligence Sources
Federal court records, accessible through PACER (Public Access to Court Electronic Records), provide the full record of patent litigation proceedings. For competitive intelligence, the most valuable documents are:
Claim construction orders (“Markman orders”), in which judges define the legal scope of patent claims. A narrow claim construction can effectively make a previously threatening patent non-infringed; a broad construction can extend a patent’s reach further than the plain text suggests.
Summary judgment opinions, in which courts address patent validity and infringement issues before trial. These opinions often provide the most detailed judicial analysis of a patent’s strength and are frequently more informative than trial verdicts.
Settlement agreements, where they are publicly disclosed. Many pharmaceutical patent settlements are sealed, but the basic terms—particularly exclusion dates—are often disclosed in SEC filings and press releases that are accessible through EDGAR.
FDA ANDA approval letters and Complete Response Letters (CRLs) provide intelligence on the regulatory status of competing ANDA filers that is not available through any other channel. An approved ANDA for a Paragraph IV challenge is public information; a CRL indicating that a competing ANDA has failed regulatory review changes the competitive timeline for all subsequent filers.
The Go/No-Go Decision Framework
Patent landscape analysis produces information. Go/no-go decisions require a framework that converts that information into a structured recommendation.
The framework varies by company culture, product type, and competitive context, but the core variables are consistent across the industry. A sound go/no-go decision for a generic or biosimilar drug product evaluates four primary factors:
Patent risk: What is the probability that launching this product will result in infringement litigation? What is the estimated cost of that litigation? What is the probability of an adverse outcome (injunction or damages award) that would prevent launch or require a license on unfavorable terms?
Timeline risk: Given the patent landscape, when is the earliest legally defensible launch date? How does that date compare to competitors’ anticipated launch dates? What is the probability that delays—from litigation, regulatory holds, or manufacturing issues—will push the actual launch date beyond the first-mover advantage window?
Market opportunity: What is the peak annual revenue potential of the generic or biosimilar product? How quickly will market share erode as additional competitors enter? What is the price erosion curve, and at what point does the market become economically unviable for a given cost structure?
Development cost: What is the fully loaded cost of developing and commercializing this product, including manufacturing development, bioequivalence or clinical studies, regulatory fees, and patent challenge litigation if required?
These four variables produce a financial model in the form of risk-adjusted net present value (rNPV). The calculation is straightforward:
rNPV = [Expected Revenue × Probability of Success] – [Development Cost + Litigation Cost × Probability of Litigation]
The difficulty is not in the formula but in the inputs. Reasonable professionals can disagree substantially about the probability that a specific patent is valid and infringed, the likely revenue of a product that won’t reach market for five years, and the cost of litigation that may or may not occur. The discipline of patent landscape analysis exists precisely to narrow these uncertainties.
Patent Risk Quantification
Quantifying patent risk requires moving from legal analysis to probability estimation—a step that makes many lawyers uncomfortable. But the business decision requires a number, not a brief.
The most defensible approach to patent risk quantification combines three inputs:
Claim scope analysis: How broad are the patent claims? Claims that use functional language, cover entire compound classes, or rely on non-specific claim terms are more vulnerable to invalidity challenges than claims with precise structural or compositional limitations.
Prior art assessment: What prior art exists that could support an invalidity challenge? The strength of a patent is inversely related to the quality and quantity of prior art available against it. Prior art that was before the examiner during prosecution is less useful than art that was not submitted—”non-cumulative” prior art that the examiner never evaluated is the lifeblood of successful invalidity challenges.
Litigation precedent: How have similar claims fared in prior litigation? A formulation patent claiming a specific polymer in a specific concentration range has a different litigation track record than a method-of-use patent claiming treatment of a disease state. Industry databases—including DrugPatentWatch’s litigation tracking—allow analysts to benchmark individual patents against the historical win rates for similar claim types.
Timeline Risk and Competitive Positioning
Timeline risk analysis produces a competitive landscape timeline: a visual mapping of when each identifiable patent expires (or is expected to be cleared through challenge or licensing), when competing ANDA or BLA filers are estimated to launch, and how the cumulative picture affects first-mover advantage.
For generics, the critical question is whether a Paragraph IV challenge is commercially necessary or merely advantageous. If key patents expire within 24 months of an anticipated ANDA filing, a Paragraph IV challenge may not be needed—the company can file a Paragraph III certification and wait for expiry. But if key patents run 10 years beyond the compound patent expiry, a Paragraph IV challenge is the only path to near-term market entry.
For biosimilars, competitive positioning analysis must account for the reference product exclusivity period: the BPCIA provides 12 years of reference product exclusivity from date of first approval, during which no biosimilar can be approved (though it can be filed after 4 years). For a biologic first approved in 2018, no biosimilar can receive approval before 2030. This statutory protection is a ceiling that no amount of patent challenge strategy can overcome.
Within the post-exclusivity period, competitive positioning requires intelligence on which other biosimilar manufacturers have filed or are known to be developing products, their estimated timelines, and their strategic posture (whether they are targeting interchangeability designation or standard biosimilar approval). This competitive intelligence is imperfect—biosimilar development programs are not publicly disclosed until the BPCIA’s patent dance process begins—but inference from clinical trial registrations, manufacturing partnerships, and prior regulatory filings provides a reasonable picture.
Inter Partes Review: The Parallel Battlefield
The America Invents Act of 2012 created Inter Partes Review (IPR), a post-grant review proceeding before the Patent Trial and Appeal Board (PTAB) that allows any third party to challenge the validity of an issued U.S. patent. IPR has become a critical tool in pharmaceutical patent strategy for both generic manufacturers and branded companies.
IPR proceedings have several characteristics that make them attractive to generic challengers:
Favorable standard of review: In IPR, patent claims are evaluated under a “preponderance of the evidence” standard, which is easier to satisfy than the “clear and convincing evidence” standard required to invalidate a patent in district court litigation.
Faster timeline: An IPR proceeding concludes within 12 to 18 months of institution, compared to district court patent litigation that typically takes 3 to 5 years from complaint to verdict.
Broader claim scope: PTAB historically applied a “broadest reasonable interpretation” standard to patent claims, which made it easier to find claims invalid over prior art. Since 2018, the PTAB has used the same “Phillips” construction standard as district courts, narrowing this advantage—but PTAB still provides a faster and generally more accessible forum for invalidity challenges.
No injunctive risk: Unlike district court litigation, an IPR petition cannot result in an injunction against the petitioner’s product. This allows generic manufacturers to challenge patents through IPR without triggering the litigation risks associated with a Paragraph IV certification.
The intersection of IPR and Hatch-Waxman strategy has become increasingly sophisticated. A generic manufacturer facing a blocking patent may simultaneously file an ANDA with Paragraph IV certification (triggering litigation in district court) and petition for IPR on the same patent. The IPR may invalidate the patent before the district court litigation concludes, mooting the litigation. Even if the IPR doesn’t fully invalidate the patent, a PTAB decision canceling some claims can narrow the litigation footprint in district court.
From a competitive intelligence perspective, monitoring IPR petitions and outcomes for patents covering target drugs provides early warning about how other market participants assess patent strength. A wave of IPR petitions against a specific formulation patent suggests that multiple generic manufacturers have independently identified that patent as vulnerable—which is both validation of that analysis and a warning that the market will be competitive.
Coalescent Petitioning and Coalition Risk
One development that competitive intelligence analysts must track is coalition petitioning, where multiple generic manufacturers jointly fund IPR challenges against particularly expensive-to-litigate patents. The Coalition for Affordable Drugs (now operating under different structures) pioneered this approach, filing IPR petitions against pharmaceutical patents on behalf of investor groups and, in some cases, in coordination with generic manufacturers.
Coalition petitioning reduces per-company litigation costs but creates a different strategic problem: the outcome of the IPR is public and benefits all subsequent filers equally. A generic manufacturer that invests in an IPR challenge that succeeds has cleared the path not just for itself but for every competitor who files after the decision. The 180-day first-filer advantage does not automatically benefit the IPR petitioner unless it is also the first Paragraph IV ANDA filer—and the IPR’s outcome may have attracted additional ANDA filers who would not otherwise have entered the market.
The strategic calculus around IPR participation is therefore complex and situation-specific. For high-revenue blockbusters with widely licensed generic markets, IPR success generates large aggregate value even when shared. For niche products with limited generic market potential, IPR investment may not be recoverable even with a successful outcome.
Biologics Manufacturing: The Process Patent Problem
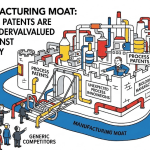
Process patents are the most underappreciated source of patent risk in biosimilar development. Unlike small-molecule drugs, where the synthesis pathway is relatively constrained by chemistry, biologics can theoretically be manufactured through multiple cell lines, fermentation processes, purification sequences, and formulation methods. The originator’s choice of manufacturing process is proprietary—and heavily patented.
What Process Patents Actually Cover
Originator biologics companies file process patents covering:
Cell line patents: The specific genetically modified cell lines used to express the biologic protein. Chinese hamster ovary (CHO) cells are the most common production system for monoclonal antibodies, and specific CHO cell lines with enhanced productivity or specific glycosylation profiles are proprietary.
Fermentation and cell culture patents: The specific growth media compositions, temperature profiles, pH conditions, and feeding strategies used in upstream bioprocessing. These process conditions directly affect the post-translational modifications (particularly glycosylation) of the final protein, which in turn affect its clinical properties.
Purification patents: The chromatography methods—protein A affinity, ion exchange, hydrophobic interaction—used to isolate and purify the biologic from the cell culture. Purification sequences are extensively patented because they directly determine product quality and impurity profiles.
Formulation patents: The specific buffers, stabilizers, and excipients used in the final drug product. For biosimilars, formulation differences from the reference product must be justified analytically and may require clinical bridging studies—so the formulation space is constrained in ways that increase infringement risk.
The challenge for biosimilar developers is that they cannot know the exact manufacturing process used by the originator. They must independently develop a process that produces a biosimilar product—one that is “highly similar” to the reference product in all analytically measurable attributes—without using the originator’s patented methods. If their independently developed process happens to use a patented step, they face infringement liability even though they didn’t know about it.
This risk is not theoretical. In the early U.S. biosimilar market, several biosimilar applicants received infringement notices under the BPCIA’s patent dance process for manufacturing process patents they had independently redeveloped. The typical resolution was a design-around (if feasible) or a license.
Freedom to Operate in Biologics Manufacturing
FTO analysis for a biosimilar development program should begin at the cell line selection stage, before substantial manufacturing development investment is made. Key questions to address include:
Are the target cell lines available without royalties or restrictions? Many commercial cell lines are licensed under agreements that restrict use for specific products or therapeutic areas. Confirming FTO for the chosen expression system before committing to it avoids downstream complications.
Do the planned upstream process conditions infringe any granted or pending process patents? This analysis requires disclosure of the biosimilar developer’s planned process to patent counsel—a step that some companies resist for internal confidentiality reasons but that is essential for a sound FTO opinion.
Does the planned purification sequence replicate patented methods? Many antibody purification sequences follow similar logical frameworks (protein A capture, followed by ion exchange polishing, followed by viral filtration), but the specific conditions of each step—column loadings, elution gradients, pH ranges—may fall within the claims of process patents.
Does the final formulation infringe formulation patents? For biosimilar developers targeting interchangeable status, formulation differences from the reference product must be justified analytically; for those targeting standard biosimilar approval, formulation flexibility is greater but still constrained by the reference product’s pharmacopeial specifications.
Competitive Intelligence in Practice: Building the Function
Understanding patent landscape methodology is necessary but not sufficient. Building a competitive intelligence function that consistently supports sound go/no-go decisions requires organizational design, data infrastructure, and analytical discipline that most pharmaceutical companies—particularly mid-size and smaller generic manufacturers—have not invested in.
The Intelligence Team Structure
Effective pharmaceutical patent intelligence requires a multidisciplinary team. The core functions are:
Patent intelligence analysts: Professionals with both scientific training (chemistry, biology, or pharmaceutical sciences) and patent analysis skills. These analysts conduct the database searches, identify relevant patents, and assess claim scope. In large generic manufacturers, this team may include 10 to 20 professionals; in smaller companies, it may be a single person with access to external counsel.
Regulatory affairs integration: The patent landscape must be continuously connected to the regulatory filing timeline. Patent exclusivity and regulatory exclusivity interact in complex ways that require someone who understands both systems simultaneously. The regulatory affairs team’s ANDA or BLA submission timeline directly determines which patent challenges are commercially necessary.
Litigation intelligence: A dedicated function—or strong relationships with external patent litigation counsel—that monitors PTAB filings, district court dockets, and BPCIA patent dance notifications for all drugs in the company’s pipeline and competitive set. Real-time litigation intelligence allows companies to respond to competitive developments quickly.
Market intelligence integration: Patent landscapes are only useful when connected to market data. The go/no-go decision requires financial modeling that integrates patent expiry timelines, competitive entry timelines, and market size projections. Market intelligence professionals who can build these models and update them as new information arrives are as important as the patent analysts who generate the underlying data. <blockquote> “In a survey of 147 generic pharmaceutical executives, 68% reported that patent intelligence failures—either missed patents or incorrect validity assessments—had directly contributed to at least one commercially significant delay or litigation loss in the prior five years.” — Parexel Consulting / Generic Pharmaceutical Association Industry Survey, 2022 [8] </blockquote>
The Pipeline Review Process
The most successful generic and biosimilar manufacturers run structured portfolio review processes that apply patent landscape analysis at multiple decision gates, not just at the initial go/no-go stage.
At initial screening, landscape analysis is relatively high-level: How many Orange Book patents exist? What are their expiry dates? Are there known Paragraph IV challenges? What is the approximate market size? This takes a few days and produces a preliminary risk-opportunity score that determines whether the product advances to detailed analysis.
At detailed analysis, the full patent landscape is constructed—complete database searches, FTO assessment, competitive filing analysis, and regulatory exclusivity mapping. This phase typically takes six to twelve weeks for a complex product and produces the detailed input for the go/no-go decision.
At development entry, once a go decision is made, the landscape is transferred to the litigation and regulatory teams who will manage it through the ANDA or BLA process. The landscape is treated as a living document: updated when new patents are published, when litigation developments occur, and when competitive intelligence surfaces new information about other filers.
At launch preparation, six to twelve months before the anticipated launch date, the landscape is comprehensively updated to ensure that no new patents have been filed or granted that could affect the launch timeline. For biosimilars, the patent dance notifications from the reference product sponsor provide a formal checkpoint.
ROI of Patent Intelligence: The Numbers Behind the Investment
Patent landscape analysis is expensive. For a complex biosimilar with 200+ relevant patents, a complete landscape including FTO analysis may cost $1 to $3 million in analyst time, database subscriptions, and legal fees. For a mid-size generic manufacturer running 20 to 30 development programs simultaneously, the total investment in patent intelligence may reach $10 to $20 million annually.
The question executives ask—not unreasonably—is whether that investment generates a measurable return.
The answer is yes, and it can be quantified.
The Value of Avoided Litigation
Pharmaceutical patent litigation in the United States costs, on average, $3 to $5 million per party per case for smaller disputes and $20 to $50 million for complex trials involving major products [9]. A Paragraph IV challenge for a blockbuster drug regularly exceeds $50 million in total legal fees across a multiyear proceeding.
Patent intelligence that correctly identifies high-probability-of-loss litigation targets—and steers the company away from initiating Paragraph IV challenges on strong patents—avoids this cost. A CI function that prevents two major adverse litigation outcomes per year generates direct cost savings in the $40 to $100 million range.
The Value of First-Filer Advantage
The 180-day first-filer exclusivity for generic drugs generates substantial commercial value. For a drug with $1 billion in annual U.S. branded sales, a generic entering at 80% of brand price typically captures 75% to 85% of prescriptions within the 180-day exclusivity window. Generic revenue during that period might be $300 to $400 million before the second wave of generics enters and prices decline further [10].
A patent intelligence function that correctly identifies go windows six months earlier than competitors—enabling first-to-file status—directly generates that $300 to $400 million revenue premium. The investment in CI is typically recovered in a single first-filer success.
The Value of Avoided Development Failures
The most painful go/no-go failure is not the litigation loss—it’s the development program that runs to near-completion before a fatal patent obstacle is discovered. Development costs for a complex generic may reach $50 to $100 million before the first ANDA filing; for a biosimilar, $200 to $500 million before regulatory submission. A patent obstacle discovered late in development may not simply delay the program; it may kill it entirely if the only resolution is a design-around that is technically infeasible.
A patent intelligence function that identifies fatal obstacles at the screening stage—before major development investment is committed—prevents these losses. The ROI calculation is straightforward: if CI investment of $5 million per year prevents one $200 million development program from running to failure, it generates a 40x return on the CI investment in that year alone.
The Value of Strategic Intelligence in Licensing
Patent intelligence supports not only go/no-go decisions but negotiation strategy. A generic manufacturer entering licensing negotiations with a brand company needs to know the fair value of the license it’s being asked to pay. That fair value depends heavily on the quality of the brand’s patent portfolio—the scope, validity, and enforceability of the specific patents blocking market entry.
A company with accurate patent intelligence knows when a brand’s demanded license terms reflect genuine patent strength and when they reflect an inflated valuation of a weak portfolio. That knowledge is worth millions in licensing negotiations. Companies that conduct rigorous landscape analysis consistently negotiate lower licensing costs than companies that accept brand valuations at face value.
Global Patent Strategy: Beyond the U.S. Market
U.S. patent landscape analysis is the starting point, but generic and biosimilar competition is a global business. For major markets—Europe, Japan, Canada, Australia, and Brazil—patent protection must be independently assessed because patent rights are national in scope and patent thicket structures vary significantly across jurisdictions.
The European Landscape
Europe’s patent system differs from the U.S. in ways that create systematically different competitive landscapes. The European Patent Office (EPO) has historically applied stricter patentability standards than the USPTO, particularly for pharmaceutical second medical use claims and for minor chemical modifications of known compounds. The result is that many secondary patents that are granted in the United States are not granted by the EPO—giving biosimilar and generic developers meaningfully earlier entry windows in major European markets.
The adalimumab market illustrates this divergence clearly. In Europe, where AbbVie’s secondary patent portfolio was substantially thinner, biosimilar competition began in 2018. In the United States, it didn’t begin until 2023. A biosimilar developer that conducted independent landscape analysis for both markets would have recognized the European opportunity five years earlier and could have allocated development resources accordingly.
The Unified Patent Court (UPC), which became operational in June 2023, has added a new dimension to European patent strategy. The UPC allows patent holders to obtain unitary patent protection across 17 EU member states with a single filing, and allows challengers to invalidate a unitary patent with a single proceeding. For biosimilar developers, the UPC’s centralized revocation proceeding is potentially more efficient than filing national revocation actions in each major European market—but it also creates the risk that a brand manufacturer could enjoin a biosimilar across all UPC member states with a single successful infringement action [11].
Regulatory Data Protection in Europe
Europe uses a different mechanism than the United States for protecting branded biologics from early biosimilar competition. The EU’s regulatory data protection framework provides eight years of data exclusivity plus two years of market exclusivity (the “8+2” regime), with a potential additional year for significant new indications.
Unlike the U.S. 12-year reference product exclusivity, the EU’s data exclusivity period is based on marketing authorization date and does not extend automatically for reformulations or new uses. This means that EU biosimilar entry timelines for drugs approved in Europe differ from U.S. timelines in ways that must be independently modeled.
Japan and the Asia-Pacific Region
Japan represents the world’s third-largest pharmaceutical market and has a well-developed generic drug sector. Japan’s patent system is broadly similar to the U.S. system in its approach to pharmaceutical patents, but with important differences in the treatment of method-of-use claims and in the scope of data exclusivity protections.
The Japanese Patent Office (JPO) has historically been more receptive to pharmaceutical method-of-use patents than the EPO, which creates a richer secondary patent landscape in Japan for some compounds. However, Japan’s “supplementary protection certificates” equivalent—patent term extension for regulatory delay—has specific calculation rules that differ from U.S. patent term extension, which can create different effective expiry dates for the same compound in the two markets.
India and China deserve separate treatment as both major generic manufacturing hubs and as emerging domestic markets. India’s Section 3(d) of the Patents Act famously restricts the patenting of new forms of known substances that do not demonstrate enhanced efficacy—a provision that has eliminated many formulation and polymorph patents that would be valid in the United States. For a generic manufacturer with Indian manufacturing operations, this creates a more permissive manufacturing environment for some products but does not eliminate patent risk in export markets.
Real-Time Intelligence: Monitoring the Landscape After Go Decision
A go decision is not a one-time event. The patent landscape changes continuously—new patents are filed, applications are published, litigation develops, regulatory decisions are issued, and competitors make moves that affect the commercial opportunity. Post-decision monitoring is as important as the initial landscape analysis.
Patent Publication Monitoring
Patent applications are typically published 18 months after their filing date. This means that on the day a company makes a go decision on a drug target, there may be brand manufacturer patent applications already filed but not yet published that will enter the landscape in the coming months. Monitoring the publication of new patent applications—and immediately assessing their relevance to the development program—is essential.
Professional patent monitoring services use automated alerts to notify subscribers when new patents or patent applications are published that match predefined search criteria. For a drug in active development, a monitoring profile might include the drug’s chemical name and synonyms, the brand manufacturer’s assignee name, relevant IPC/CPC classification codes, and the names of specific inventors who work in the relevant therapeutic area. When a new publication matches the profile, analysts receive notification and assess its relevance within days of publication rather than discovering it months later.
Litigation Monitoring
Court dockets for active Paragraph IV litigations change frequently, and key developments—claim construction orders, summary judgment rulings, trial dates, settlement filings—can materially affect go/no-go assessments for products still in development. Automated docket monitoring services track changes to relevant court cases and deliver real-time alerts when significant filings occur.
For biosimilars, BPCIA patent dance notifications are particularly time-sensitive. The 30-day and 60-day statutory response windows in the patent dance leave little time for thoughtful analysis if the company hasn’t already reviewed the reference product sponsor’s relevant patents in advance.
Competitive Filing Intelligence
Monitoring competitor ANDA and BLA filings—to the extent they are publicly identifiable—allows companies to update their competitive timeline models in real time. ANDA approvals, tentative approvals, and Complete Response Letters are reported by the FDA on its website and reflect the competitive landscape for specific drug products. When a competitor receives ANDA approval for a Paragraph IV challenge that the company is also pursuing, the competitive dynamics shift: if the competitor settles and receives a launch date, that date becomes a ceiling on the first-filer exclusivity window.
Common Failures and How to Prevent Them
Patent landscape analysis fails in predictable ways. Understanding these failure modes is as important as understanding best practices.
The “Compound Patent Only” Trap
The most common failure in generic landscape analysis is treating the compound patent as the primary—or only—patent risk. Many product development teams receive a summary that states “the compound patent expires in [year]” and treat that as the go window, without understanding the full formulation, process, and method-of-use patent landscape.
This failure is partly organizational: the team responsible for the compound patent expiry check may not be the same team responsible for FTO analysis, and communication between them is imperfect. It is also partly cultural: in organizations where speed of portfolio building is rewarded, detailed patent analysis is sometimes perceived as a brake on business development momentum.
Prevention requires making full landscape analysis a mandatory decision gate that cannot be bypassed regardless of schedule pressure. The compound patent expiry date should trigger an analysis requirement, not a go decision.
The Jurisdiction Blind Spot
For companies focused primarily on the U.S. market, patent landscape analysis is sometimes conducted exclusively using U.S. patent data—even when the development program encompasses manufacturing in India or Europe, formulation development in a third country, and planned commercialization in multiple markets.
If manufacturing occurs in a country where a process patent is valid, infringement risk exists even if the final product is sold in a jurisdiction where the patent is not granted or has expired. Cross-border patent risk is a specialized area that requires expertise in the patent laws of each relevant manufacturing and commercial jurisdiction.
The Static Landscape Problem
A landscape conducted at go decision and never updated is worse than no landscape at all, because it provides false confidence. Development programs run for years; patent portfolios change; litigation develops; regulatory decisions shift the competitive map. A landscape that was current at the go decision may be materially incomplete by the time the ANDA is filed.
The solution is to treat the landscape as a living document with scheduled updates—at minimum, quarterly reviews for active development programs and event-triggered reviews whenever a significant development occurs.
The “Strong Patent” Assumption
Some analysts, uncomfortable with the uncertainty of patent validity assessments, default to treating granted patents as strong unless they identify specific invalidating prior art. This conservative approach systematically overstates the patent barrier and leads to avoidance of legitimate market opportunities.
The empirical data on pharmaceutical patent litigation outcomes does not support a default assumption of patent strength. Studies of Paragraph IV litigation outcomes have found that generic challengers prevail (through invalidity finding, unenforceability, or non-infringement finding) in roughly 50% to 60% of cases that reach a judicial decision, depending on the study period and methodology [12]. This rate implies that granted pharmaceutical patents, as a class, are not presumptively strong. They are mixed-quality assets that require individual assessment.
The Future of Patent Landscape Analysis: AI, Data Density, and Speed
The pharmaceutical patent intelligence function is changing, primarily because the data environment is changing. Several developments are reshaping how competitive intelligence is conducted.
AI-Assisted Patent Analysis
Machine learning tools are increasingly applied to patent claim analysis, prior art searching, and validity assessment. These tools can process large patent portfolios faster than human analysts and can identify structural and linguistic patterns in patent claims that human reviewers miss. Some commercial platforms now offer AI-assisted “patent strength” scoring that aggregates multiple validity indicators into a single metric.
These tools are genuinely useful for initial portfolio screening—quickly identifying which of 200 patents in a landscape deserve detailed analysis and which can be classified as low risk based on claim scope, filing date, and prosecution history. They are less reliable as standalone validity assessors. Patent validity determinations require legal judgment that AI tools cannot currently replicate, particularly for patents involving complex claim constructions or nuanced prior art combinations.
The most productive approach is to use AI tools to prioritize and scope the human analysis, not to replace it. A landscape that uses AI to identify the 20 patents from 200 that require detailed attorney review is more efficient than one that ignores AI tools entirely—and more reliable than one that treats AI scores as final validity determinations.
Increasing Data Availability
The BPCIA patent dance has generated a growing body of publicly available biosimilar patent litigation data. As more reference products enter the biosimilar-eligible period and more biosimilar applicants navigate the patent dance, the aggregate dataset of biosimilar patent disputes, resolutions, and licensing terms is growing. This historical data—increasingly captured in structured form by platforms like DrugPatentWatch—improves the calibration of forward-looking risk models.
Similarly, the growth of PTAB proceedings since the America Invents Act has generated an extensive public record of pharmaceutical patent challenges, with detailed claim-by-claim analysis by PTAB judges. This record, now spanning more than a decade of proceedings, provides a rich dataset for benchmarking the expected outcome of future challenges.
Speed as a Competitive Differentiator
The convergence of better data, AI-assisted analysis, and integrated intelligence platforms is shortening the timeline for patent landscape analysis. Tasks that took months a decade ago now take weeks. For competitive intelligence in generic and biosimilar development, speed matters because the first-filer advantage is determined by who files first—and the decision to file requires a complete patent landscape.
Companies that have invested in integrated intelligence infrastructure—connecting patent databases, competitive filing data, litigation monitoring, and market intelligence in a unified analytical environment—can execute initial landscape screens in days and complete FTO analyses in weeks rather than months. This speed advantage compounds over a development portfolio: a company that makes go decisions 30 days faster than its competitors, across 20 product decisions per year, accumulates a meaningful timing advantage over time.
Key Takeaways
The compound patent expiry date is a starting point for patent landscape analysis, not a go decision. A complete landscape includes formulation, process, method-of-use, delivery system, and combination patents—all of which can independently block generic or biosimilar market entry.
The Orange Book and Purple Book are mandatory starting points for landscape analysis but are not complete patent maps. Non-Orange Book patents can support infringement claims outside the Hatch-Waxman framework, and biosimilar process patents are not captured in any regulatory listing.
For biosimilars, process patents represent the most underappreciated source of litigation risk. FTO analysis for a biosimilar development program must begin at cell line selection, before significant manufacturing development is committed.
Historical litigation data—available through platforms like DrugPatentWatch—provides more calibrated risk estimates than purely analytical patent validity assessments. A patent that has survived three prior Paragraph IV challenges is demonstrably different from one that has never been litigated.
Regulatory exclusivities (NCE exclusivity, pediatric exclusivity, new formulation exclusivity) operate independently of patent expiration and can extend the effective market protection window by six months to three years. A landscape that doesn’t map these exclusivities will produce systematically optimistic go window estimates.
The 180-day first-filer exclusivity for generics generates commercial returns that can be $200 to $400 million or more for major products. Patent intelligence that identifies and enables first-filer positions is among the highest-ROI functions in generic pharmaceutical business development.
Patent landscapes must be treated as living documents. Quarterly updates at minimum—and event-triggered updates for significant litigation, regulatory, or competitive developments—are necessary to maintain the landscape’s reliability as a decision support tool.
AI-assisted patent analysis tools are valuable for portfolio screening and prioritization but are not substitutes for human legal analysis in validity and infringement determinations.
The cost of a rigorous patent landscape analysis—$1 to $3 million for a complex biosimilar—is recoverable from a single litigation-avoidance outcome or first-filer commercial success.
Global patent strategy requires independent analysis in each major market. Patent thickets that are thin in Europe may be dense in the United States, and vice versa. Market entry timelines must be modeled separately by jurisdiction.
Frequently Asked Questions
Q1: How many patents typically need to be analyzed for a major biosimilar development program, and what does that process actually involve?
For a major reference biologic—a monoclonal antibody with $5 billion or more in annual revenue—the patent universe can range from 100 to 300 granted patents and pending applications across global jurisdictions. In the United States alone, 50 to 150 relevant patents is common for biologics like adalimumab, etanercept, or bevacizumab. The analysis process starts with a comprehensive patent database search using compound name, assignee, inventor, and classification queries. Resulting patents are sorted into families (groupings of related applications filing from a common priority document) to avoid double-counting international equivalents. Each family is assessed for claim scope—what exactly do the claims cover, and does the proposed biosimilar product and manufacturing process fall within those claims? Claims identified as potentially infringed are escalated to patent counsel for formal FTO opinion. The full process for a major biosimilar typically takes 6 to 12 months of analyst and legal work, with quarterly updates thereafter.
Q2: What is the practical difference between a patent landscape and a Freedom to Operate analysis, and do companies need both?
A patent landscape is descriptive: it maps all intellectual property in a defined technology space without necessarily evaluating whether any specific product infringes any specific patent. An FTO analysis is prescriptive: it evaluates whether a defined product, made by a defined process, can be marketed without infringing any identified patent. Both are necessary, and they are complementary. The landscape identifies the universe of relevant patents; the FTO analysis evaluates which ones actually pose infringement risk for the company’s specific development plan. A landscape without FTO analysis tells you what patents exist but not which ones matter for your product. An FTO analysis without a complete preceding landscape may miss relevant patents because the search on which it is based was incomplete. Best practice is to conduct a comprehensive landscape first, then commission FTO analysis on the subset of patents identified as highest risk.
Q3: Can a biosimilar developer use the reference product’s FDA application data as a basis for its own development without triggering patent claims?
No. The BPCIA protects the reference product sponsor’s regulatory data from being used by biosimilar applicants to support approval. What a biosimilar applicant can do is rely on the FDA’s prior finding of safety and efficacy for the reference product—meaning the biosimilar doesn’t need to repeat the full clinical trial program that the originator conducted. But the biosimilar must independently demonstrate analytical similarity to the reference product using its own analytical testing, must independently develop and validate its manufacturing process, and must conduct its own clinical studies (at minimum PK/PD studies, and for many products immunogenicity and safety bridging studies as well). Using the reference product’s manufacturing know-how directly would constitute trade secret misappropriation; developing a similar process independently may trigger process patent claims that must be resolved through the patent dance or through design-around.
Q4: How does a generic manufacturer decide between filing a Paragraph IV challenge and waiting for patent expiry?
The decision hinges primarily on market timing and financial modeling. A Paragraph IV challenge makes economic sense when three conditions are met: the blocking patent has sufficient remaining life that waiting for expiry would delay launch by a commercially significant period (generally 2+ years for major products), the probability of prevailing in the challenge is reasonably high based on prior art and claim scope analysis, and the expected commercial value of earlier entry exceeds the expected cost of litigation. For blockbuster drugs with $1 billion or more in annual sales, even a 30% probability of prevailing in a Paragraph IV challenge may justify the investment because the expected value of first-filer exclusivity is large enough to justify the litigation cost and risk. For products with $100 million or less in annual sales, the economics are less favorable and many companies elect Paragraph III certifications. The calculation also depends on how many other generic manufacturers are likely to file Paragraph IV challenges: if multiple competitors are expected to file, the litigation cost is incurred regardless, but the first-filer exclusivity prize is shared with only the first filer—which makes being first more important, not less.
Q5: How should companies think about patent intelligence for drugs that are approaching loss of exclusivity in 3 to 5 years versus those 10+ years away?
The analytical approach differs significantly by time horizon. For drugs approaching loss of exclusivity in 3 to 5 years, the patent landscape is substantially knowable: most relevant patents are already published, litigation histories exist for many of them, and the competitive ANDA filing landscape is beginning to take shape. Landscape analysis at this stage is primarily confirmatory—verifying that the known patent map is complete, monitoring for new filings, and tracking competitive ANDA submissions to inform first-filer positioning. For drugs 10+ years from primary patent expiry, the landscape is dominated by uncertainty: secondary patents have not yet been filed, clinical development may still be ongoing (generating future patentable inventions), and the commercial opportunity is difficult to size accurately. For distant opportunities, patent intelligence is primarily focused on identifying the patent strategy the brand manufacturer is likely to pursue based on their historical patterns for similar compounds, and on monitoring early patent prosecution activity. The go decision for a 10-year target is necessarily more speculative than for a 3-year target, which is why larger generic manufacturers maintain rolling pipeline analyses that track drugs across the full development timeline and revisit go/no-go decisions annually as new information arrives.
References
[1] Kesselheim, A. S., Avorn, J., & Sarpatwari, A. (2016). The high cost of prescription drugs in the United States: Origins and prospects for reform. JAMA, 316(8), 858–871. https://doi.org/10.1001/jama.2016.11237
[2] Feldman, R. (2018). May your drug price be evergreen. Journal of Law and the Biosciences, 5(3), 590–647. https://doi.org/10.1093/jlb/lsy022
[3] Hatch-Waxman Act. (1984). Drug Price Competition and Patent Term Restoration Act, Pub. L. No. 98-417, 98 Stat. 1585.
[4] Grabowski, H., Long, G., Mortimer, R., & Boyo, A. (2016). Updated trends in US brand-name and generic drug competition. Journal of Medical Economics, 19(9), 836–844. https://doi.org/10.1080/13696998.2016.1176578
[5] Congressional Budget Office. (2021). Research and development in the pharmaceutical industry. U.S. Congressional Budget Office. https://www.cbo.gov/publication/57126
[6] AstraZeneca AB v. Dr. Reddy’s Laboratories, Ltd., 747 F.3d 1358 (Fed. Cir. 2014).
[7] Initiative for Medicines, Access & Knowledge (I-MAK). (2021). Overpatented, overpriced: How excessive pharmaceutical patenting is extending monopolies and driving up drug prices—Special focus: AbbVie’s Humira. https://www.i-mak.org/overpatented-overpriced-humira/
[8] Parexel Consulting & Generic Pharmaceutical Association. (2022). Patent intelligence and development decision-making in generic pharmaceuticals: Industry survey results [Industry survey report].
[9] American Intellectual Property Law Association. (2023). Report of the economic survey. AIPLA. https://www.aipla.org
[10] Frank, R. G. (2007). The ongoing regulation of generic drugs. New England Journal of Medicine, 357(20), 1993–1996. https://doi.org/10.1056/NEJMp078193
[11] Unified Patent Court Agreement. (2023). Agreement on a Unified Patent Court, 2013/C 175/01. Official Journal of the European Union.
[12] Hemphill, C. S., & Sampat, B. N. (2012). Evergreening, patent challenges, and effective market life in pharmaceuticals. Journal of Health Economics, 31(2), 327–339. https://doi.org/10.1016/j.jhealeco.2012.01.004