The real disruption isn’t lower prices—it’s visible margins
Pharmaceutical executives have spent the better part of two decades preparing for the price cut. They built war rooms, modeled revenue erosion scenarios, lobbied Congress, and filed litigation across three federal circuits. Their core assumption: the existential threat to their business model was a number—a lower number on the price of their drugs.
They were wrong about the threat. Not about the direction, but about the mechanism.
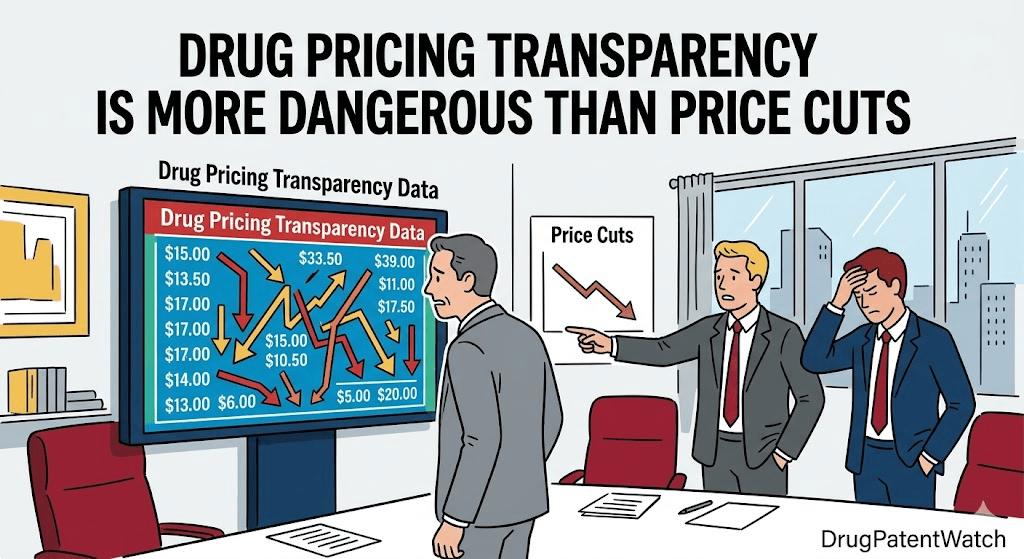
The disruption that is now reshaping the U.S. pharmaceutical industry is not the price reduction itself. It is the act of making prices—real prices, net prices, margin-upon-margin prices—visible. Transparency, it turns out, is structurally more corrosive to incumbent pharmaceutical economics than a direct cut. A cut reduces revenue. Transparency eliminates the architecture that made the revenue model possible in the first place.
This article examines why.
Part I: The System That Opacity Built
How $356 Billion in Annual Discounts Stayed Hidden
Start with a number that should be front-page news every year but rarely is: in 2024, the gross-to-net reductions for all brand-name drugs in the United States reached $356 billion [Drug Channels Institute, 2024]. That is the total value of the gap between what manufacturers publish as their list price—the Wholesale Acquisition Cost, or WAC—and what they actually receive in net revenue after rebates, discounts, and other price concessions are stripped away.
To understand why this matters, you need to understand what the gross-to-net bubble actually is, because the name is misleading. It sounds technical, like an accounting footnote. It is not. It is the operating system of U.S. pharmaceutical commerce. <blockquote> “Pharmaceuticals are the only part of the U.S. healthcare system in which the difference between list and net prices is monetized as rebates and redistributed via intermediaries to payers.” — Drug Channels Institute, 2025 Economic Report on U.S. Pharmacies and Pharmacy Benefit Managers [1] </blockquote>
That single structural fact explains almost everything aberrant about U.S. drug pricing. In every other sector of American healthcare—hospital care, physician services, medical devices—prices are negotiated and the result is a transaction price. Drugs operate differently. A manufacturer sets a high list price. A pharmacy benefit manager negotiates rebates off that list price. Those rebates flow back through intermediaries, some to payers, some retained by PBMs, none reaching patients at the point of sale. The patient’s copay is calculated off the list price, not the net price. The patient pays more. The PBM earns more. The manufacturer maintains access to the formulary. The list price keeps rising.
For this to work, the actual transaction prices must remain confidential. Manufacturers cannot let payers know exactly what competitors are paying. PBMs cannot let employers know how much they are retaining. The entire architecture requires opacity as a load-bearing wall.
The Anatomy of a Drug Price: What You See vs. What Exists
Walk through a concrete example. Eli Lilly’s Humalog insulin had a list price that appeared unchanged from 2018 to 2022. Net prices, however, declined by $22 per vial over that same period—a 35% reduction [Drug Channels Institute, 2024]. By 2022, each vial carried a net price of approximately $40 but generated $235 in rebates and discounts [1]. A diabetic patient requiring multiple vials annually was accumulating a rebate trail worth more than $5,000 per year—money that moved through the system but did not reach them.
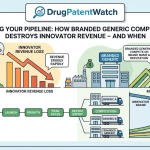
When Lilly finally lowered its list price to $66 in 2023, the gross-to-net spread collapsed from $235 to just $40 [1]. This is the mechanism that transparency disrupts. The lower list price did not reduce net revenue proportionally—it eliminated a margin layer that multiple intermediaries had built their business models around.
This pattern repeats across therapeutic categories. According to SSR Health data reviewed by Drug Channels, brand-name net prices fell for the seventh consecutive year in 2025, with list price growth averaging below 4% annually—a dramatic deceleration from the 10% to 15% increases that characterized the 2010-2015 period [2]. The gross-to-net gap grew at its slowest rate in at least a decade. The bubble is not popping. It is deflating. Slowly, unevenly, but structurally.
Who Actually Benefits from Opacity
The gross-to-net bubble benefits four categories of participants in sequence:
First, pharmacy benefit managers. The three largest PBMs—CVS Caremark, Express Scripts, and OptumRx—control roughly 94% of the commercial PBM market [3]. They negotiate rebates from manufacturers, retain a portion, and pass the remainder to plan sponsors. The FTC documented that the Big Three generated $1.4 billion from spread pricing alone between 2017 and 2021 [4]. Their rebate aggregators—third-party entities created or controlled by PBMs—generated $7.6 billion in fees by 2022 [5]. This revenue requires confidentiality. If employers knew the full rebate amount on every drug, they would demand it all.
Second, manufacturers. High list prices with heavy rebating serve two purposes that purely high net prices cannot. They preserve the appearance of premium value—a $10,000-per-year drug signals medical seriousness in a way a $3,000-per-year drug does not, even if net revenues are identical. They also enable tiered contracting: a manufacturer can offer a 40% rebate to a preferred PBM and a 25% rebate to others, maintaining price discrimination across the channel without publicly disclosed price differences. Transparency collapses that structure.
Third, hospital systems and 340B covered entities. The 340B Drug Pricing Program requires manufacturers to sell drugs at deeply discounted “ceiling prices” to qualifying hospitals and safety-net providers. Those entities then dispense the drugs to patients while billing payers—including Medicare—at list price. The margin between the 340B acquisition price and the reimbursement rate is pure operating revenue for the hospital. According to Drug Channels, for five of the drugs with a Medicare maximum fair price for 2026, covered entities received 340B pricing discounts of 50% or more on Medicare Part D prescriptions paid at full reimbursement rates [6]. A list price reduction deflates this spread directly.
Fourth, pharmacies. Pharmacy reimbursement for brand-name drugs is calculated using the Average Wholesale Price (AWP), which is itself defined as 120% of the WAC list price [6]. A pharmacy reimbursed at AWP minus 20% is actually being paid at the list price level—and purchasing drugs at a 5.1% discount to WAC from wholesalers. That dispensing spread is the pharmacy’s gross profit on the prescription. It tracks directly to the list price. When the list price falls, the spread falls.
The system is elegant, self-reinforcing, and entirely dependent on no one being able to see the full picture.
Part II: The Transparency Shock—Where It’s Coming From
The IRA’s Hidden Mechanism: Not Price Cuts but Price Disclosure
The Inflation Reduction Act of 2022 authorized Medicare to negotiate prices for selected high-expenditure drugs. Most coverage has focused on what the negotiated maximum fair prices (MFPs) will be—the actual numbers. This framing misses the more consequential element: what the negotiation process reveals.
When the Centers for Medicare and Medicaid Services published the MFPs for the first ten negotiated drugs in August 2024, it created a public, auditable record of the relationship between list prices and government-accepted transaction prices. Manufacturers suddenly had a publicly visible net price floor for their highest-revenue products. And critically, the MFP is linked to the list price in the statutory formula—it is calculated as a percentage of the non-federal average manufacturer price (non-FAMP) or the weighted average net price under Part D, whichever is lower [7].
This linkage means that a manufacturer cannot raise its list price without affecting its MFP calculation. It cannot lower its list price without changing the 340B ceiling price and the Medicaid rebate baseline. The price is now part of an interlocking disclosure system rather than a private commercial decision.
The IRA’s inflation rebate program adds a second transparency mechanism. Manufacturers must pay Medicare back for any list price increases above inflation [8]. The rebate requirement, combined with CMS invoicing expected in late 2025, means that historical pricing decisions—previously confidential—now generate publicly reported financial obligations. According to the GAO’s April 2025 report, CMS had obligated approximately $2.9 billion of the $3 billion in negotiation program appropriated funds and was developing infrastructure for rebate invoicing [8]. The administrative machinery of transparency is now built and running.
The CBO had predicted that manufacturers would reduce list price growth or potentially cut prices for many drugs on the market, as raising prices above inflation generates mandatory rebate payments [9]. What the CBO did not fully model is the second-order effect: as manufacturers reduce list price growth to avoid inflation rebates, they erode the gross-to-net spread that funds the entire channel economics structure.
The MFN Executive Order: Forcing International Price Visibility
The Most Favored Nation executive order signed by President Trump on May 12, 2025, introduced a different transparency mechanism: international price comparison [10]. The order directs HHS to set MFN price targets for manufacturers based on the lowest price available in OECD countries with a GDP per capita of at least 60% of U.S. GDP [10].
This is significant not primarily because it will immediately result in lower prices—the legal enforceability of the EO remains uncertain, and the administration has pursued voluntary agreements rather than formal rulemaking as its primary implementation strategy [11]. It is significant because it publicly establishes what comparable economies pay for the same drugs.
U.S. list prices for prescription drugs average nearly three times those in other developed countries, with prices for branded drugs more than four times as high [12]. These ratios were known to policy researchers and occasionally cited in congressional hearings. The MFN framework makes them into contract-level public commitments. When Gilead Sciences agrees under MFN pressure that Epclusa (sofosbuvir/velpatasvir) can be sold for $2,425 rather than $24,920 for patients purchasing directly through TrumpRx [13], the question of why the list price was $24,920 becomes unanswerable in any way that does not involve intermediary economics.
By January 2026, sixteen major manufacturers—including AbbVie, Amgen, AstraZeneca, Bristol Myers Squibb, Eli Lilly, Gilead, GSK, J&J, Merck, Novartis, Novo Nordisk, Pfizer, and Sanofi—had announced MFN agreements for selected products [14]. The agreements’ specific terms are confidential, but their existence and the percentage reductions advertised publicly represent exactly the kind of price visibility that the traditional system was built to prevent.
Pharmaceutical companies are responding by launching direct-to-patient distribution platforms that bypass the traditional channel entirely [15]. AstraZeneca announced a platform allowing cash-pay patients to access drugs at up to 70% off list prices in October 2025. Bristol Myers Squibb created direct platforms for Eliquis and Sotyktu. These platforms reveal, with no ambiguity, how large the list-to-net spread has been. You cannot offer 70% off list without implying that the list price was, at minimum, inflated by the magnitude of the rebates that sustained it.
PBM Transparency Requirements: The Direct Channel Threat
The third transparency vector comes from PBM reform legislation, which has accelerated dramatically since 2024. By early 2026, more than a dozen states had enacted legislation targeting PBM rebate disclosure and spread pricing practices, with over twenty states requiring some form of reporting on manufacturer rebates [16].
The federal trajectory is more significant. A January 2026 spending bill advanced PBM reforms including mandatory 100% pass-through of rebates, fees, and other remuneration to payers [17]. CMS is now required to collect semiannual data including gross and net drug spending, manufacturer rebates, spread pricing arrangements, and formulary placement rationale—and to track financial flows between PBMs and pharmacies [17]. The FTC settled with Express Scripts in February 2026, resolving allegations tied to rebate-driven practices that contributed to inflated insulin list prices, with the settlement requiring drug-level reporting and transparency into broker compensation [18].
What these reforms collectively produce is not merely a fairer distribution of rebate dollars. They produce a data trail. When CMS can track the full path of a rebate—from manufacturer to PBM to plan sponsor, with retention at each stage identified and reported—the question of list price versus net price becomes answerable for regulators, employers, and eventually patients. The opacity that sustained the gross-to-net bubble requires that no single entity can see the whole picture. Semiannual reporting requirements to CMS mean CMS can see the whole picture.
The effect on the PBM business model is already visible in market share data. Use of alternative PBMs—smaller, transparency-focused competitors to the Big Three—increased by approximately 19% from 2024 to 2025, while reliance on CVS Caremark, Express Scripts, and OptumRx decreased by roughly 11% over the same period [19]. OptumRx announced in March 2025 that it would shift to a cost-based pharmacy payment model for more than 24,000 independent and community pharmacies [19]. The shift is voluntary now. It will be mandatory shortly.
Part III: The Patent Dimension—Transparency as IP Threat
Why Patent Data Is the Other Price Signal
Drug pricing and drug patent status are not separate conversations. They are the same conversation at different points in the product lifecycle. A drug priced at $15,000 per year for a cancer treatment is priced partly on the basis of clinical evidence—and partly on the basis of how long the manufacturer believes it can sustain exclusivity without generic competition. That exclusivity assessment requires knowing the true breadth and durability of the patent estate, which is exactly the intelligence that platforms like DrugPatentWatch make publicly accessible.
DrugPatentWatch tracks patent expiration, generic entry, and litigation data across 134 countries, covering the full range of Orange Book listings, Paragraph IV certifications, PTAB challenges, and settlement agreements that define actual market exclusivity timelines [20]. For a pharmaceutical analyst or a payer’s formulary team, access to this data changes the negotiating calculus fundamentally. If a manufacturer is pricing Keytruda (pembrolizumab) at $29 billion in annual global sales partly on the expectation of extended exclusivity through the late 2020s, but the patent cliff data suggests meaningful challenge risk in 2026-2028, the premium over therapeutic alternatives is unjustifiable on a risk-adjusted basis.
The pharmaceutical industry’s upcoming patent cliff is now documented as the largest in its history: an estimated $200-$230 billion in annual branded revenue will lose exclusivity protection between 2025 and 2030 [21]. The drugs concentrated in the 2026-2028 window include Keytruda, Eliquis (apixaban at over $13 billion in BMS revenue alone for 2024), and Opdivo (nivolumab at approximately $9 billion in 2024) [21]. BMS and Pfizer have mounted an aggressive Eliquis litigation campaign, with multiple Paragraph IV ANDAs triggering 30-month stays [21]. A court ruling narrowing or invalidating the apixaban formulation patents could enable generic entry before the nominal expiration date—collapsing the pricing premium that the patent estate was assumed to support.
Patent transparency reframes pricing conversations in three specific ways.
First, it makes the terminal date of a drug’s pricing power visible to purchasers. A hospital system negotiating a multi-year Keytruda contract in 2025 can, using patent intelligence data, estimate the probability that biosimilar competition will materialize before the contract expires. That probability assessment justifies demanding concessions now rather than at renewal. The value of the information is the leverage it creates.
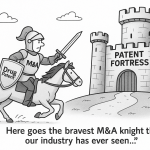
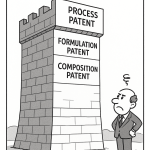
Second, it exposes the gap between listed patents and commercially relevant patents. The Orange Book lists every patent a manufacturer claims covers a drug. But not all Orange Book patents are created equal. Compound patents are generally the strongest. Formulation patents are more vulnerable to design-around. Method-of-use patents are vulnerable to carve-out labeling by generic applicants. Manufacturers have historically listed aggressive patent portfolios in the Orange Book partly to extend the presumptive 30-month stay that triggers automatically when a generic applicant certifies under Paragraph IV. The FTC challenged over 300 patent listings in 2024 and 2025, arguing they delay generic competition illegally [22]. If courts agree that device patents—for inhalers, auto-injectors, and pre-filled syringes—do not ‘claim the drug’ as required by statute, a wave of Orange Book delisting motions will rewrite competitive timelines for multiple drug categories [22]. That outcome has already produced delisting motions across respiratory and injectable categories in 2024 and 2025 [22].
Third, patent transparency illuminates settlement economics. When AbbVie settled biosimilar challenges for Humira (adalimumab) with delayed-entry agreements rather than fighting through full litigation, the settlement terms—and the fact that settlement was chosen rather than litigation—provided market intelligence about AbbVie’s confidence in its remaining IP position [23]. U.S. net prices for adalimumab products fell by approximately 80% from the pre-biosimilar baseline [23]. The biosimilar manufacturers in that case, including Amgen’s Amjevita and Organon’s Hadlima, offered substantial rebates to PBMs rather than simply lowering list prices—replicating the gross-to-net structure of the original product. The visibility created by settlement disclosures made that pricing strategy harder to sustain as subsequent entrants competed for formulary access.
The Biosimilar Pricing Paradox
The adalimumab case reveals a counterintuitive dynamic that affects the transparency argument directly. When biosimilars enter a market, they do not automatically compete on list price. In the current U.S. market structure, they compete on rebate depth—because formulary placement is awarded to the product offering the largest rebate to the PBM, not the lowest price to the patient.
This means biosimilar entry, in the absence of transparency reforms, can extend the gross-to-net bubble rather than deflate it. Humira biosimilars launched in January 2023 with rebates to PBMs, not list price reductions to patients. By late 2023, ten biosimilars had entered the market, and pricing dynamics were more complex than the generic small-molecule analogy would predict [23]. Patients expected their costs to fall. Instead, they often encountered the same high list price with rebates flowing to payers.
Transparency reforms disrupt this pattern by shifting the basis of formulary competition from rebate depth to net price. When semiannual CMS reporting makes the full rebate trail visible, a formulary decision that prefers a high-list/high-rebate biosimilar over a low-list/low-rebate alternative becomes documentable and potentially actionable. The Oregon rebate pass-through law enacted in 2021—which required PBMs to pass 100% of manufacturer rebates to plan sponsors—cut the average 2025 small-group insurance rate increase by 52%, according to a 2024 Insurance Commissioner review [24]. That is the scale of the margin that had been retained. That is what transparency releases.
Part IV: The Strategic Response—What Manufacturers Are Actually Doing
List Price Reduction as Defensive Transparency
The most counterintuitive strategic response to transparency pressure is for manufacturers to proactively reduce their own list prices. This seems self-defeating. It is actually rational under the current regulatory arithmetic.
When a manufacturer has a drug with a high list price and a large rebate—the Medicaid rebate calculation uses the AMP (average manufacturer price) relative to inflation, and when the list price grows faster than inflation, the manufacturer owes Medicaid the excess—the manufacturer faces a choice between paying uncapped inflation rebates to Medicaid and reducing the list price voluntarily. The American Rescue Plan Act of 2021 removed the cap on Medicaid rebates, which had previously been limited to 100% of the AMP. Without the cap, manufacturers of heavily rebated drugs could theoretically owe Medicaid more than they earn from Medicaid sales [25]. That is not theoretical for insulin products.
Eli Lilly, Novo Nordisk, and Sanofi all reduced WAC list prices on widely prescribed insulin products by 50% to 80% in 2024 [2]. These insulin products had more than $20 billion in gross sales prior to the reductions [2]. The list price reductions did not reduce net revenue proportionally—because the Medicaid rebate calculation is tied to the list price relative to inflation, reducing the list price paradoxically increases the net price by reducing mandatory rebate payments. This is the inverted logic that Drug Channels Institute documented: a drug that reduces its list price can see an increase in its net price [1].
For 2025 and 2026, manufacturers reduced WAC list prices on more than 20 brand-name drugs [2]. For 2026, at least 15 more drugs will see list price cuts, reducing gross brand-name revenues by $35 to $40 billion [2]. List prices are dropping by 25% to 85% [2]. This is not altruism. It is a calculated response to transparency-driven regulatory exposure.
Direct-to-Patient Distribution: Bypassing the PBM Entirely
The MFN executive order’s directive that HHS facilitate direct-to-consumer purchasing programs for manufacturers selling at MFN prices [10] opened a channel that manufacturers had been exploring for other reasons. Direct-to-patient distribution bypasses PBMs entirely. No rebate required. No formulary placement negotiation. No spread pricing. Just a manufacturer and a patient and a cash price.
AstraZeneca’s platform—offering drugs at up to 70% off list prices with home delivery—and BMS’s Eliquis direct platform represent the early infrastructure of a channel that transparency pressure is accelerating [15]. Mark Cuban’s Cost Plus Drugs, launched in 2022, had already demonstrated the model’s viability: charge a transparent markup over manufacturing cost, eliminate PBM intermediation, and the resulting price for generic drugs is often 80% to 90% lower than the PBM-negotiated pharmacy price.
Cost Plus Drugs is not a threat to the pharmaceutical manufacturer’s patent-protected revenue; it primarily serves generic products. But the model is now influencing how manufacturers think about branded product distribution. If a manufacturer can reach patients directly at a net price that is still profitable—say, $200 for a drug with a $1,000 list price and a $600 net price after rebates—then the PBM intermediary captures no incremental value. The manufacturer earns the same net revenue. The patient pays less. The PBM earns nothing.
This dynamic explains OptumRx’s preemptive pivot to cost-based pharmacy payment models in March 2025. The PBM is trying to reposition itself as a transparent administrator before legislation forces that role upon it. Whether the pivot is substantive or cosmetic remains to be determined by the semiannual CMS reporting requirements that will make the answer visible.
Portfolio Repositioning: The Small-Molecule Penalty and Its Consequences
The IRA’s negotiation framework treats small-molecule drugs and biologics asymmetrically. Small molecules become eligible for price negotiation after nine years of FDA approval. Biologics are not eligible until thirteen years post-approval [7]. This four-year difference—the “pill penalty” that the bipartisan EPIC Act (H.R. 1492) seeks to eliminate—has already altered R&D investment patterns.
Small-molecule funding dropped 70% since September 2021 [26]. In the first seven months of 2024, biologics received ten times more funding than small molecules [26]. Pfizer announced plans to shift its oncology strategy toward more biologic drugs and reduce small-molecule investment [26]. BMS’s CEO publicly announced a thorough portfolio review, expecting to cancel certain small-molecule programs [26]. In a PhRMA survey, 78% of companies said they expected to cancel early-stage small-molecule pipeline projects [26].
This is a transparency-driven portfolio shift. The IRA’s negotiation framework makes public the regulatory calculus that determines how long a drug is commercially protected from price negotiation. Manufacturers can read that calculus and respond by avoiding the categories with shorter protection windows. The result—if uncorrected by legislation like the EPIC Act—is a research portfolio increasingly biased toward biologics for reasons that have nothing to do with patient need and everything to do with regulatory transparency about pricing timelines.
In 2024, 50 novel drugs were approved by the FDA, 32 of which were small-molecule drugs [26]. The schizophrenia treatment developed by Karuna and Bristol Myers Squibb—with a developmental history spanning over 30 years—was among them. The pipeline for the next decade may look different if the IRA’s small-molecule penalty is not addressed, because manufacturers now have a transparent, quantified incentive to avoid small molecules. When the incentive is visible and quantified, the behavioral response is predictable.
Part V: The Payer Perspective—Why Employers and Insurers Are Demanding Data
How Employers Lost the Pricing Argument
For most of the past two decades, employers buying health insurance for their workers could not determine what their PBM was actually paying for drugs. They received a rebate amount—a lump sum representing a share of the manufacturer rebates negotiated on their behalf—but not the drug-by-drug or contract-by-contract data that would allow them to verify the math. PBMs argued that confidentiality protected their negotiating leverage. Employers accepted this argument because they had no regulatory leverage to demand otherwise.
That changed as transparency legislation accumulated. The Consolidated Appropriations Act of 2021 required group health plans to report drug spending and rebate data to federal regulators. The reporting requirements escalated under subsequent legislation. By 2026, employers with self-funded health plans were receiving drug-level reporting that allowed, for the first time, a calculation of what the PBM retained versus what was passed through.
The numbers revealed were consequential. A 2024 Insurance Commissioner review of Oregon’s rebate pass-through law found that requiring PBMs to remit 100% of rebates slashed the average 2025 small-group insurance rate increase by 52% [24]. The implication is not subtle: roughly half of the prior year’s premium increase represented PBM retention of manufacturer rebates rather than health cost increases. Employers who now have access to this data are not passively accepting it. They are moving to alternative PBM structures, demanding direct contracts with manufacturers, and in some cases self-administering pharmacy benefits through third-party administrators that operate on flat-fee models.
The FTC report released in 2024 titled “The Powerful Middlemen Inflating Drug Costs and Squeezing Main Street Pharmacies” provided an additional catalyst, documenting how the Big Three PBMs structured rebate aggregators to retain revenue and how affiliated pharmacy networks received preferential reimbursement compared to independent pharmacies [29]. Employers reading that report had the language to negotiate differently.
Formulary Design Under a Transparency Mandate
Formulary placement decisions—which drugs get Tier 1 coverage, which get excluded, which face step therapy requirements—have historically been made by PBMs based on confidential rebate offers from manufacturers. A drug offering a 45% rebate could secure preferred placement over a drug offering 30%, regardless of relative clinical value, because the employer could not verify the rebate terms.
Transparency requirements change this calculus in three distinct ways.
The first is that semiannual disclosure of formulary placement rationale—now required under the federal PBM reforms advancing through Congress—creates an auditable record of whether formulary decisions align with rebate depth or clinical evidence [17]. A formulary committee that chooses the higher-list/higher-rebate product over a lower-cost clinically equivalent alternative will need to document that choice in terms that CMS can evaluate.
The second is that outcomes-based contracting becomes more feasible when net prices are visible. A manufacturer cannot offer a performance guarantee tied to clinical outcomes if the plan sponsor does not know the net price against which performance is being measured. Transparency is a precondition for value-based contracting, and value-based contracting is the industry’s best argument against pure price controls.
The third is that the academic literature has flagged a risk that policy makers are slowly recognizing: in concentrated markets, price disclosure can facilitate tacit collusion rather than competition [13]. When detailed rebate and formulary placement data reveal the terms of existing agreements, PBMs may coordinate reimbursement terms rather than compete on them. Granular pharmacy reimbursement data could allow regional coordination among a small number of large PBMs in ways that ultimately harm payers. Transparency mandates designed to increase competition may, if applied to the wrong data elements, reduce it.
This is the nuanced reality that makes pharmaceutical pricing transparency more complicated than its proponents acknowledge. The disclosure has to be structured correctly. CMS reporting to regulators is different from public posting of all rebate terms. The former enables oversight. The latter could enable collusion.
Part VI: The Litigation Angle—How Transparency Is Reshaping Patent Challenges
Paragraph IV Economics After the Transparency Shift
The Hatch-Waxman Act created a litigation framework where filing an Abbreviated New Drug Application (ANDA) with a Paragraph IV certification is the legal equivalent of filing a patent lawsuit before a single tablet is manufactured [21]. The economics of this litigation are driven by transparency on two sides: the generic manufacturer needs to know the value of the market it is targeting (a function of net pricing data and exclusivity timelines), and the brand manufacturer needs to know the cost of defending patents whose value is now visibly tied to a shrinking gross-to-net spread.
As net prices fall and the gross-to-net bubble deflates, the economic value of each year of additional exclusivity decreases. A formulation patent that previously protected $500 million in annual gross margin, with a net-to-gross ratio of 50%, was worth roughly $250 million per year to a manufacturer. If transparency reforms compress the gross-to-net spread and the same patent now protects $300 million in annual gross margin with a 65% net-to-gross ratio, the patent is worth $195 million per year to defend. The litigation investment calculus changes. Settlement terms that were previously unacceptable may become rational.
This dynamic is already visible in the speed of biosimilar settlements. J&J’s Stelara (ustekinumab) faced biosimilar competition beginning in 2025 after Paragraph IV settlements with multiple applicants—settlements reached faster than historical precedent would have predicted [21]. J&J’s conversion strategy toward Tremfya (guselkumab) reflects the recognition that patent defense economics are being altered by pricing visibility.
The FTC’s challenge to over 300 Orange Book patent listings in 2024 and 2025 adds a regulatory transparency layer to the litigation framework [22]. If the challenged listings are found to be improper—because device patents do not “claim the drug” as the statute requires—the 30-month stay that previously delayed generic entry for those products disappears. The immediate consequence is generic entry risk for multiple respiratory and injectable products. The medium-term consequence is that manufacturers will list fewer marginal patents, knowing that each listing invites antitrust scrutiny [22]. A cleaner Orange Book is a more transparent Orange Book. A more transparent Orange Book accelerates generic competition timelines.
DrugPatentWatch’s tracking of litigation records, settlement patterns, and exclusivity data across 134 countries gives pharmaceutical analysts, generic manufacturers, and institutional investors a continuously updated picture of competitive timing that did not exist at this level of accessibility before [20]. A freedom-to-operate (FTO) analysis that previously required months of manual patent review can now be informed by aggregated litigation data showing which patents have been challenged, which have been invalidated, which have survived inter partes review at the PTAB, and which manufacturers have historically settled quickly versus defended aggressively. That information changes the expected value calculation for a Paragraph IV challenge.
The BPCIA’s Patent Dance—Forced Disclosure for Biologics
For biologics, the Biologics Price Competition and Innovation Act (BPCIA) created a process called the “patent dance,” in which the biosimilar applicant exchanges manufacturing information with the reference product sponsor, and both parties negotiate which patents will be litigated before market entry [22]. This process forces disclosure of manufacturing patents—patents that the Orange Book does not list and that previously remained invisible to competitors.
Given the complexity of biologic manufacturing, manufacturing process patents are often the strongest component of a biologic’s IP defense [22]. The BPCIA’s dance compels their disclosure. A biosimilar manufacturer that completes the patent dance knows, before investing in market entry, exactly which patents it will need to design around or challenge. That knowledge—forced transparency in a statutory negotiation process—alters the competitive dynamics for every major biologic approaching biosimilar eligibility.
The FDA’s 2024-2025 policy shift eliminating the separate “interchangeability” designation for biosimilars adds a second transparency mechanism [22]. Previously, biosimilars had to undergo additional switching studies to achieve interchangeability status, which allowed automatic substitution at the pharmacy counter. The FDA’s position that all approved biosimilars are safe to switch—supported by modern analytical science—removes a layer of artificial product differentiation that brand manufacturers used to sustain pricing premiums. If every approved biosimilar is automatically substitutable, the formulary placement negotiation for the reference product changes fundamentally.
Part VII: International Spillover—Why U.S. Transparency Exports Price Pressure Globally
How MFN Referencing Changes Global Launch Strategy
The MFN executive order’s mechanism—pegging U.S. prices to the lowest price in OECD reference countries—creates a global pricing feedback loop that analysts have not fully modeled. The traditional pharmaceutical launch sequence was U.S. first, at maximum price, followed by staggered European launches at prices negotiated downward from a U.S. reference. This sequence worked because U.S. prices were not formally referenced in other markets’ price-setting processes.
MFN reverses the reference direction: the U.S. price is now potentially set by international prices. If a manufacturer launches a drug in Germany at a negotiated price of $8,000 per year for a product that commands $40,000 per year in the U.S., and Germany is in the MFN reference basket, the U.S. price target becomes $8,000. This makes early European launches costly: they set a reference that compresses U.S. pricing.
The response—already being modeled by manufacturers—is to delay or sequence international launches to manage reference pricing risk [42]. PharmExec analysis suggests that conventional launch sequences beginning with U.S. launches before European markets may need to be reversed, with manufacturers launching in the U.S. first at MFN-compliant prices before accessing foreign markets at whatever those markets will pay [42]. The logic inverts the historical model entirely.
But there is a deeper problem in the international referencing mechanism: the prices that MFN would reference are typically gross list prices in foreign markets, not the net prices after the confidential rebates and risk-sharing agreements that foreign health systems use [46]. Germany’s Institute for Quality and Efficiency in Health Care (IQWiG) assesses therapeutic benefit and sets reference prices, but the actual transaction occurs with confidential supplements and discounts that reduce the real price well below the published level. Italy’s average discounts for injectable oncology therapies are approximately 55%, not reflected in the published ex-factory price [47]. An MFN mechanism that references published list prices rather than net prices is referencing a fiction and would still compress U.S. manufacturer margins relative to actual foreign-market economics.
The analysis from Indegene estimated that MFN implementation for a subset of twelve high-spend Medicare drugs would reduce global revenues from approximately $97 billion to $47 billion—a 50% reduction—based on U.S. price drops alone, before accounting for countries that reference U.S. prices in their own price-setting processes [47]. Japan, which formally references U.S. prices in some therapeutic categories, would face additional downward pressure. The international transparency cascade from a U.S. disclosure mandate is not contained at the border.
The Voluntary Agreement Approach and What It Reveals
The Trump administration’s decision to pursue voluntary MFN agreements rather than formal rulemaking—at least as its primary implementation vehicle—tells us something important about the limits of transparency alone. By January 2026, sixteen companies had announced agreements [14]. The terms are confidential. The agreements commit manufacturers to “launching new medicines with a more balanced pricing approach across developed countries” without specifying the arithmetic [14].
This outcome—transparency as a threat whose materialization is avoided by private disclosure—is itself a form of pricing discipline. Manufacturers who agreed to MFN-compliant pricing did not do so because they believed the executive order was unambiguously legal or enforceable. They did so because the public visibility of refusing would have been politically costly, and because the private concessions required were smaller than the public acknowledgment of international price discrimination that formal MFN implementation would have produced.
The voluntary agreement structure allows both parties to avoid full transparency while achieving partial price compression. This is the political economy of pharmaceutical pricing in 2026: transparency as leverage, deployed selectively, with the real transactions still confidential. The full transparency that would most disrupt incumbent pricing structures—drug-level, quarter-by-quarter, net price reporting across all payers—has not yet arrived. The legislation and regulation driving toward it has.
Part VIII: The New Pricing Regime—What the Deflated Bubble Looks Like
Entering the Net Pricing Drug Channel
Drug Channels Institute has named the emerging market structure the Net Pricing Drug Channel (NPDC)—”a market environment in which net prices, not list prices, drive access, economics, and strategy” [2]. The NPDC rewards simplicity and punishes rebate dependence. In this environment, a manufacturer with a drug priced at $2,000 per year with no rebates competes more effectively than a manufacturer with a drug priced at $4,000 per year with a 50% rebate—because the channel economics now favor the simpler product.
The NPDC emerged from the convergence of government actions and consumer behavior that Drug Channels Institute identified as the five forces deflating the gross-to-net bubble:
Uncapped Medicaid rebates under the American Rescue Plan Act, which penalize high list prices with mandatory payments to Medicaid that can exceed 100% of the drug’s AMP [25]. The IRA’s maximum fair price framework, which links negotiated prices to list prices and creates a visible net floor for Medicare products [7]. Most Favored Nation pricing pressure, which references international prices and compresses the ceiling for U.S. list prices [10]. The growth of high-deductible health plans and cost-sharing that moves patient exposure closer to list prices, making high list prices visible as direct costs rather than absorbed by insurance. The rapid growth of cash-pay pharmacies, discount cards like GoodRx, and direct-to-patient manufacturer programs that establish transparent market prices outside the PBM infrastructure [2].
The NPDC is not a single regulatory event. It is the compound effect of transparency mechanisms that individually are manageable but collectively are rewriting the rules of pharmaceutical commerce.
What the Numbers Show in 2025 and 2026
The empirical data from 2025 is unambiguous on direction, if not yet on magnitude. Brand-name net prices fell for the seventh consecutive year [2]. For 2026, manufacturers will cut list prices on at least 15 more drugs, reducing gross brand revenues by $35 to $40 billion [2]. Average list-price growth fell below 4% annually in the most recent two years—the lowest sustained growth rate in at least a decade [2]. For 2024, the gross-to-net spread grew at the slowest rate in at least ten years despite the bubble reaching its record dollar total of $356 billion [1].
The insulin case is the clearest illustration of what the deflated bubble looks like. Lilly, Novo Nordisk, and Sanofi reduced WAC list prices by 50% to 80% in 2024 [2]. These products had more than $20 billion in gross sales before the reductions [2]. The result was not a 50% to 80% collapse in revenue. Because the list price reduction also reduced mandatory Medicaid rebate payments and eliminated the absurd scenario of paying the Medicaid program for the use of their own products, net revenue declined by a smaller fraction than the list price reduction implied. The bubble’s inflation of the list price had been masking a rebate liability. When the list price fell, the liability fell with it.
For channel participants dependent on list-price-indexed economics, the picture is different. Pharmacies whose dispensing spread tracks AWP will lose spread as list prices decline. 340B hospitals whose margin tracks the gap between the 340B ceiling price and Medicare reimbursement will see that gap compress as list prices fall. As Drug Channels noted, the gross-to-net bubble was inflated with deferred pain—pain that is now being distributed across the channel [6].
The Innovation Revenue Argument—and Why It Remains Contested
The pharmaceutical industry’s consistent response to pricing transparency and compression is the innovation argument: lower revenue means less R&D investment, which means fewer new drugs, which means worse patient outcomes. The argument is not frivolous. Drug development is expensive—the estimated cost of bringing a new molecular entity to market, accounting for failures, runs to $2 billion or more in capitalized terms, though the range of estimates is wide and contested.
The IRA’s small-molecule penalty has produced documented R&D responses. Small-molecule funding dropped 70% from 2021 to 2024. Pfizer shifted its oncology strategy toward biologics [26]. BMS reviewed its pipeline for cancellations [26]. These are real behavioral responses to a regulatory transparency mechanism, not hypothetical risks.
But the innovation argument is complicated by the gross-to-net data. If manufacturers are earning $356 billion in gross-to-net reductions annually [1]—money that flows to PBMs, pharmacies, hospitals, and plan sponsors rather than to patients—then the argument that pricing compression will deplete R&D capital requires showing that those $356 billion were, in fact, funding R&D. They were not. They were funding channel economics. The R&D question is about net price, not list price. If net prices are falling while the list price remains high, the manufacturer is already absorbing R&D risk from a diminishing revenue base. Transparency that compresses the gross-to-net spread may accelerate that compression—or it may redirect dollars from channel participants back to manufacturers in a way that actually improves their net revenue position.
The insulin case makes this concrete. When Lilly reduced Humalog’s list price to $66, the gross-to-net spread shrank from $235 to $40 [1]. Lilly earned roughly the same net revenue. The $195 per vial that previously funded PBM rebates and channel economics stopped flowing. Lilly’s R&D budget was not diminished by the list price reduction. The channel participants’ margins were.
ITIF argued in a February 2025 report that the IRA is “negotiating the United States out of drug innovation” based on the documented reduction in small-molecule investment [26]. The counterargument—offered by a Sage Journals paper and others—is that small companies will continue developing small molecules even if large companies shift [26]. ITIF responded that large pharmaceutical companies support smaller ones through licensing, partnership, and acquisition, and that the broader ecosystem matters [26]. Both arguments have merit. Neither is fully proven by the data available.
What the transparency framework adds to this debate is clarity about where the revenue goes. When the full path of every drug dollar is visible—from manufacturer gross price through PBM retention through plan sponsor receipt through patient cost-sharing—the innovation argument can be evaluated on actual data rather than list price assumptions.
Part IX: Strategic Implications—Who Gains, Who Loses
The Manufacturer Calculus: Four Categories
Not all pharmaceutical manufacturers face the transparency shift equally. The impact distributes across four categories based on product type and pricing structure.
High-list/high-rebate manufacturers of mature drugs—the category most exposed to the gross-to-net deflation—face the most immediate structural pressure. These are companies whose drugs have been on the market long enough to accumulate large rebate agreements with PBMs, whose list prices have grown faster than clinical value would justify, and whose revenue model depends on the continued opacity of gross-to-net economics. AbbVie’s Humira at its peak exemplified this category; the biosimilar market entry has since compressed the model. These manufacturers need to transition to net price management or face the regulatory and market forces that are doing it for them.
Manufacturers of newly launched specialty drugs face a different challenge. They enter the market now knowing that any drug remaining on the market for nine years will be eligible for IRA negotiation, and that the negotiated price will be publicly disclosed. This forces a launch-price rationalization that historically did not occur: pricing too high triggers inflation rebates under the IRA’s mandatory payment mechanism; pricing low enough to avoid inflation rebates may limit the gross-to-net spread available for formulary competition. The optimal launch price under transparency constraints is lower and simpler than under opacity.
Biologic manufacturers have more runway—thirteen years before IRA negotiation eligibility—but face MFN pressure from the executive order and increasing biosimilar competition after the FDA’s interchangeability policy shift [22]. The runway allows more time to build net price models, but the direction is the same.
Generic and biosimilar manufacturers are net beneficiaries of transparency, provided the reforms actually accelerate access. If FTC patent listing challenges remove improper Orange Book patents, if PTAB continues to invalidate weak patents, and if biosimilar interchangeability is expanded rather than restricted, generic and biosimilar manufacturers enter markets faster and face less litigation risk. Their competitive timeline shortens. Their development investment in Paragraph IV challenges is better calibrated by patent intelligence data.
The PBM Transformation: Fee-Based or Extinct
The PBM business model that emerged from the 1990s and scaled through the 2000s was built on information asymmetry. The PBM knew what every manufacturer’s net price was, what every plan sponsor’s rebate was, and what every pharmacy’s actual acquisition cost was. No single other party in the channel had that full picture. The PBM monetized the information advantage.
Transparency legislation is eliminating that advantage systematically. Semiannual CMS reporting requirements will give regulators drug-level data across the channel. Mandatory rebate pass-through will eliminate the retained-rebate revenue stream. Prohibition on spread pricing will eliminate the pharmacy spread revenue. Administrative fee caps will limit what PBMs can charge for the administrative service they provide.
The FTC’s February 2026 Express Scripts settlement required drug-level reporting, broker compensation disclosure, and formulary design changes that end preference for higher-list-price drugs when lower-cost equivalents are available [18]. Express Scripts, as the nation’s largest stand-alone PBM, accepted structural changes to avoid litigation—changes that, if industry-wide, would eliminate the rebate-dependent revenue model that has sustained the Big Three.
The alternative PBM model—flat-fee administration, full rebate pass-through, transparent formulary placement rationale—is what the market is moving toward under regulatory pressure and employer demand. Some PBMs are transitioning voluntarily. Others are being forced. The transition produces the same outcome: a channel in which the competitive advantage is administrative efficiency and clinical program design, not information asymmetry on drug prices.
Hospital Systems and the 340B Reckoning
The 340B Drug Pricing Program is the largest and least-examined beneficiary of the gross-to-net bubble for non-PBM entities. In 2024, the program covered over $100 billion in drug purchases by qualifying hospitals and safety-net providers. The hospital acquires drugs at the 340B ceiling price—which tracks to the manufacturer’s list price minus a statutory discount—and bills Medicare and commercial insurers at the reimbursement rate, which tracks to the list price (or AWP-based formula).
As list prices fall, the 340B margin falls. The IRA’s MFP framework for 2026 includes a 340B Rebate Model Pilot Program, which applies to products subject to MFPs and introduces rebate-based accounting that hospitals have vocally opposed [6]. The hospital industry’s argument—that a rebate model will require hospitals to “float millions of dollars to pharmaceutical companies” and create administrative burdens—reflects exactly the concern that a revenue source they have built into operating models is being made visible and then compressed.
DrugPatentWatch’s patent intelligence is relevant here too: as hospital systems face 340B margin compression, their purchasing decisions for off-patent biologics and specialty generics become more price-sensitive. A hospital formulary committee with access to accurate patent expiration and biosimilar entry timing data can anticipate when a high-cost biologic will face competition and plan accordingly, rather than locking into multi-year contracts that do not reflect the true competitive timeline.
Part X: What Comes Next—The Remaining Opacities
The Data Gaps That Transparency Has Not Yet Closed
For all the regulatory activity of 2024-2026, substantial opacity remains in the U.S. pharmaceutical market. Four areas are worth tracking specifically.
The first is commercial market pricing. The IRA’s MFP negotiation applies only to Medicare. Commercial payer negotiations are still confidential. The gross-to-net bubble in commercial markets is not directly affected by the MFP mechanism, only by the indirect pressure of list price reductions (which do affect commercial channel economics) and PBM reform legislation (which varies by state and has not yet produced uniform federal disclosure requirements).
The second is international net prices. The MFN mechanism references published list prices in foreign markets, not the confidential net prices that reflect actual transaction values. German, Italian, French, and UK net prices are substantially lower than published prices after confidential rebates and managed entry agreements [47]. A transparency framework that references only published international list prices cannot accurately benchmark U.S. prices against actual international transaction economics.
The third is Medicare Part B drug pricing. The IRA’s first round of negotiated drugs were primarily Part D (pharmacy-dispensed) products. The expanded program will include Part B (physician-administered) drugs beginning in 2028. Part B drug pricing is currently tied to the Average Sales Price (ASP) plus a percentage add-on, which is itself a lagged measure of actual transaction prices. The add-on creates provider incentives to prescribe higher-priced drugs. As Part B drugs enter IRA negotiation, their pricing will be disclosed at the MFP level, reducing the ASP-based spread over time.
The fourth is the actual content of voluntary MFN agreements. By January 2026, sixteen companies had announced MFN agreements, but the specific terms—which products, at what prices, to which purchasers—remained confidential [14]. The administration’s voluntary framework was structurally designed to produce price reductions without the regulatory disclosure that formal rulemaking would require. If the voluntary agreements are not followed by formal transparency requirements, they represent a transitional moment of price compression without the institutional transparency that would sustain it.
The Role of Patent Intelligence Going Forward
The convergence of pricing transparency and patent transparency is producing a new category of strategic analysis: integrated pricing/IP intelligence that connects the remaining commercial value of a drug’s patent estate to the pricing concessions that regulators and payers are demanding.
A drug with five years of remaining exclusivity and a 40% gross-to-net spread has very different negotiating leverage than a drug with ten years of remaining exclusivity and a 60% gross-to-net spread—even if both drugs have identical list prices. The former should be accepting significant pricing pressure now; the latter has more runway to manage the transition. Without accurate patent intelligence—including probability-weighted assessments of Paragraph IV challenge risk, PTAB invalidation history in the relevant technology class, and litigation track records for the specific manufacturer—that analysis cannot be performed accurately.
Platforms like DrugPatentWatch provide the continuous, updated intelligence that makes this integrated analysis feasible [20]. For a payer’s formulary committee, the question of whether to preference a brand-name drug or its biosimilar competitor is partly a clinical question and partly a competitive timing question: if the brand has significant remaining IP protection, the biosimilar’s competitive discipline is limited; if the brand’s key patents are vulnerable to challenge, the biosimilar’s pricing leverage is stronger. The patent intelligence is the missing variable that transparency mandates have not yet made universally available but that specialized services are now providing on a commercial basis.
For manufacturers, the integrated analysis runs in the other direction. If a manufacturer knows—from patent intelligence and litigation tracking—that its competitor’s key formulation patents are likely to be invalidated in the next 18 months, it can accelerate biosimilar development to enter that market as an early mover. The 180-day exclusivity available to the first Paragraph IV filer can be worth hundreds of millions of dollars, and it is won by the company that correctly analyzes the patent landscape before the challenge is filed, not after [21].
Conclusion: The Architecture Has Changed
The debate about drug pricing in the United States has long been framed as a question of numbers: how low can the price go, how much can the government negotiate, how quickly will generics enter. The transparency shift reframes it as a question of architecture.
The system that produced $356 billion in gross-to-net reductions, that sustained list prices four times international comparators, that routed manufacturer revenues through PBM intermediaries and hospital 340B margins before reaching any patient, was not an accident. It was built—deliberately, incrementally, over decades—on the structural requirement that no single participant could see the full picture. The opaque pricing of each drug depended on the opacity of every other drug’s pricing.
What is happening now is not primarily a price cut. It is a structural dismantling. The IRA makes MFP negotiation public. PBM reform makes rebate flow reportable. MFN pressure makes international price comparisons policy-relevant. FTC action makes Orange Book patent listings subject to challenge. BPCIA makes biologic manufacturing patents visible in the patent dance. State legislation makes rebate retention illegal in an expanding number of jurisdictions.
Each transparency mechanism individually is manageable. The pharmaceutical industry has managed every individual regulatory challenge of the past thirty years. What is different now is the simultaneity—multiple transparency requirements hitting overlapping phases of the drug commercial lifecycle at the same time. A manufacturer cannot optimize around the IRA’s pricing visibility while simultaneously maintaining the high-list/high-rebate model that the PBM reform is eliminating while simultaneously complying with MFN pricing while simultaneously defending Orange Book patent listings that the FTC is challenging.
The architecture that sustained the current pricing model required opacity everywhere to work anywhere. The transparency shift is closing the gaps one by one. The revenue implications of a fully transparent pharmaceutical market—where net prices are visible, patent timelines are accurate, and rebate flows are traceable—are not the same as the revenue implications of a fully lower-priced pharmaceutical market. Some manufacturers will find that their net revenues are more stable in the transparent model than in the opaque one, because list price reductions that eliminate mandatory Medicaid rebates can increase net revenue. The channel participants who monetized the opacity—PBMs, 340B hospitals, specialty pharmacy chains—will find the transition more painful.
The price cut was the headline. The transparency is the story.
Key Takeaways
The gross-to-net spread between drug list prices and actual net revenues reached $356 billion in 2024—a record, but growing at its slowest rate in a decade. The bubble is deflating, not from direct price cuts, but from transparency mechanisms that are eliminating the economic structures that inflated it.
The Inflation Reduction Act’s MFP negotiation, the Most Favored Nation executive order, and PBM reform legislation are distinct regulatory instruments that share a common mechanism: they make previously confidential pricing relationships visible to regulators, payers, and eventually patients.
Manufacturers are responding to transparency pressure by reducing list prices voluntarily—not out of altruism, but because uncapped Medicaid rebate requirements and IRA inflation penalties make high list prices economically irrational for heavily rebated drugs. Paradoxically, list price reductions can increase a manufacturer’s net revenue by eliminating mandatory rebate liabilities.
PBMs face the most structurally damaging transparency exposure. Their revenue model depends on information asymmetry across the drug channel. Semiannual CMS reporting requirements, rebate pass-through mandates, and spread pricing bans are systematically eliminating that asymmetry.
Patent intelligence—provided by platforms including DrugPatentWatch—is the complementary transparency mechanism that connects pricing power to its legal foundation. Accurate, real-time patent expiration and litigation data changes the negotiating calculus for payers, the investment calculus for generic manufacturers, and the settlement calculus for branded manufacturers defending exclusivity.
The IRA’s small-molecule/biologic asymmetry (nine years versus thirteen years to negotiation eligibility) is producing documented R&D portfolio shifts toward biologics. The EPIC Act’s proposed fix deserves close attention: an uncorrected regulatory asymmetry will distort pharmaceutical R&D in ways that have nothing to do with medical need.
Hospital systems’ dependence on 340B Program margins is directly tied to list prices. As list prices fall—driven by transparency mechanisms—340B margins compress. The sector’s resistance to 340B rebate model pilots reflects the scale of this exposure.
The voluntary MFN agreements reached by sixteen major manufacturers by January 2026 demonstrate that transparency pressure generates pricing behavior before legislation is fully enacted. The threat of public visibility is itself a pricing instrument.
FAQ
Q1: If net drug prices have been falling for seven consecutive years, why do patients still report high out-of-pocket costs?
The gross-to-net bubble explains this directly. Manufacturers’ net prices have fallen because PBMs have extracted larger rebates, not because list prices have declined. Patient cost-sharing under most commercial insurance is calculated on the list price—or a co-insurance percentage of it—not the net price. A drug with a $1,000 list price and a 50% rebate means the manufacturer receives $500 in net revenue. But the patient paying 20% coinsurance pays $200, calculated on the $1,000 list price. The PBM captures $500 in rebate. The patient has no claim to any portion of that rebate. Transparency reforms that force rebate pass-through and shift cost-sharing to net prices would directly address this patient-level affordability problem. Until cost-sharing is redesigned around net prices rather than list prices, manufacturer net price reductions do not translate into patient savings.
Q2: How does the Most Favored Nation executive order interact with the IRA’s drug price negotiation program?
They operate through different mechanisms on different populations, but the combined effect is convergent. The IRA’s MFP negotiation targets Medicare drugs that have been on the market for nine years (small molecules) or thirteen years (biologics), producing publicly disclosed negotiated prices that apply starting in 2026 for the first ten drugs. The MFN executive order targets all brands without generic or biosimilar competition across all markets, using international reference prices to set targets. Both mechanisms create public price floors for high-revenue branded drugs. Where the IRA’s MFP is a statutory ceiling with a specific calculation formula, the MFN is an executive target with uncertain enforceability and a preference for voluntary compliance. Their interaction is not fully resolved: a drug subject to IRA negotiation that also receives an MFN price commitment will need to reconcile two price benchmarks for Medicare reimbursement purposes. The Congressional Research Service analysis flagged this overlap as legally complex and not yet addressed by implementing guidance.
Q3: Why did biosimilar entry for Humira (adalimumab) not produce the patient cost reductions that generic entry typically produces?
Because biosimilar manufacturers adopted the incumbent’s rebating strategy rather than competing on list price. In the small-molecule generic model, an ANDA filer launches at 20% to 30% of the brand’s list price, pharmacies automatically substitute generically, and patients immediately pay lower costs. Biosimilars have no automatic substitution (though the FDA’s elimination of the separate interchangeability designation is changing this), so they must compete for formulary placement by offering rebates to PBMs. A biosimilar at 85% of Humira’s list price with a 50% rebate produces a net price comparable to Humira’s net price—but the list price remains high, the PBM’s rebate income is preserved, and the patient’s cost-sharing, calculated on list price, does not fall. The adalimumab market demonstrated that biosimilar entry under the current U.S. channel structure can replicate rather than disrupt the gross-to-net bubble. Transparency reforms that shift formulary competition from rebate depth to net price would change this outcome for subsequent biosimilar launches.
Q4: What does the “patent cliff” mean for pharmaceutical pricing strategy between 2025 and 2030?
An estimated $200-$230 billion in annual branded revenues will lose exclusivity protection between 2025 and 2030, concentrated in Keytruda, Eliquis, Opdivo, and other mega-blockbusters. For pricing strategy, the cliff creates three distinct pressures. First, manufacturers of cliff-adjacent drugs are under pressure to maintain pricing as long as possible, making them more likely to defend marginal patents aggressively—which the FTC’s Orange Book challenge program is making more costly. Second, the revenue lost to generic and biosimilar competition must be replaced from a new drug pipeline that is increasingly biased toward biologics (due to the IRA’s small-molecule penalty) and toward orphan/specialty indications with small patient populations but high prices. Third, payers who have been paying brand prices for these drugs are preparing for generic entry and have less tolerance for pre-cliff price increases, particularly under IRA inflation rebate requirements. The cliff is not simply an event—it is a pricing discipline that operates for the five years before expiration as well as after.
Q5: Can the pharmaceutical industry’s innovation model survive a fully transparent pricing environment?
The honest answer is: it can survive, but it must change its distribution of profit across the channel. The gross-to-net bubble’s $356 billion in annual reductions flowed primarily to intermediaries—PBMs, pharmacies, hospitals—not to manufacturers, and certainly not to patients. Manufacturers’ actual R&D spending has been more constrained than list prices implied, because net revenue has grown more slowly than list prices for most of the past decade. In a fully transparent environment with net prices visible, cost-sharing aligned to net prices, and rebate flows traceable, the competitive advantage shifts to manufacturers with genuinely differentiated drugs and to those who can deliver clinical value efficiently. Drugs priced at their actual economic contribution to patient outcomes will sustain their prices. Drugs priced on the basis of monopoly leverage and rebate architecture will not. That is not the end of pharmaceutical innovation. It is the end of pharmaceutical pricing obscurity—which is a different, and less medically consequential, loss.
Citations
[1] Drug Channels Institute. (2025). 2025 Economic Report on U.S. Pharmacies and Pharmacy Benefit Managers. HMP Global. Retrieved from https://www.drugchannels.net/2025/12/gross-to-net-bubble-hits-356b-in.html
[2] Drug Channels Institute. (2026, January). U.S. Brand-Name Drug Prices Fell in 2025 as the Net Pricing Drug Channel Emerges. Drug Channels. Retrieved from https://www.drugchannels.net/2026/01/us-brand-name-drug-prices-fell-in-2025.html
[3] CSG South. (2025, December 19). Just What the Doctor Ordered: How States Are Reforming Pharmacy Benefit Manager Regulations. Council of State Governments South. Retrieved from https://csgsouth.org/policies/just-what-the-doctor-ordered-how-states-are-reforming-pharmacy-benefit-manager-regulations/
[4] Definitive HC. (2025, September 4). PBM Oversight Accelerates in 2026: Drug Pricing Transparency. Retrieved from https://www.definitivehc.com/blog/pbm-oversight
[5] Aphora Health. (n.d.). PBM Transparency: Opening the Black Box of Drug Pricing. Retrieved from https://aphorahealth.com/blog/pbm-transparency-opening-the-black-box-of-drug-pricing
[6] Drug Channels Institute. (2025, December). List Price Reductions Will Deflate the Gross-to-Net Bubble—and Threaten Pharmacy and 340B Profits from IRA-Negotiated Drugs. Drug Channels. Retrieved from https://www.drugchannels.net/2025/12/list-price-reductions-will-deflate.html
[7] Congressional Research Service. (2024). Medicare Drug Price Negotiation Under the Inflation Reduction Act: Industry Responses and Potential Effects. Congress.gov. Retrieved from https://www.congress.gov/crs-product/R47872
[8] U.S. Government Accountability Office. (2025, April 28). Inflation Reduction Act of 2022: Initial Implementation of Medicare Drug Pricing Provisions (GAO-25-106996). Retrieved from https://www.gao.gov/products/gao-25-106996
[9] Commonwealth Fund. (2023, November 29). How Drug Price Reforms in the Inflation Reduction Act Could Impact States. Retrieved from https://www.commonwealthfund.org/blog/2023/how-drug-price-reforms-inflation-reduction-act-could-impact-states
[10] The White House. (2025, May 12). Delivering Most-Favored-Nation Prescription Drug Pricing to American Patients [Executive Order]. Retrieved from https://www.whitehouse.gov/presidential-actions/2025/05/delivering-most-favored-nation-prescription-drug-pricing-to-american-patients/
[11] Holland & Knight. (2025, May 14). Trump Administration Revives Most-Favored-Nation Drug Pricing: Here’s What to Know. Retrieved from https://www.hklaw.com/en/insights/publications/2025/05/trump-administration-revives-most-favored-nation-drug-pricing
[12] ISPOR. (2026, March). International Reference Pricing Comes to America: The MFN Policies Explained. Value & Outcomes Spotlight. Retrieved from https://www.ispor.org/publications/journals/value-outcomes-spotlight/vos-archives/issue/view/preventive-medicine/international-reference-pricing-comes-to-america–the-mfn-policies-explained
[13] The White House. (2025, December 19). Fact Sheet: President Donald J. Trump Announces Largest Developments to Date in Bringing Most-Favored-Nation Pricing to American Patients. Retrieved from https://www.whitehouse.gov/fact-sheets/2025/12/fact-sheet-president-donald-j-trump-announces-largest-developments-to-date-in-bringing-most-favored-nation-pricing-to-american-patients/
[14] PharmExec. (2026, April). The Most-Favored-Nation Policy: Outlook and Implications Beyond U.S. Pharmaceutical Executive. Retrieved from https://www.pharmexec.com/view/most-favored-nation-policy-outlook-implications-beyond
[15] Pharmaphorum. (2025, June 16). US Drug Pricing Overhaul: The Inflation Reduction Act (IRA) and the Executive Order (EO) on Most-Favored-Nation (MFN) Drug Pricing in Focus. Retrieved from https://pharmaphorum.com/sales-marketing/us-drug-pricing-overhaul-inflation-reduction-act-ira-and-executive-order-eo-most
[16] National Academy for State Health Policy. (2025, December). Drug Price Transparency Toolkit. Retrieved from https://nashp.org/drug-price-transparency-toolkit/
[17] AJMC. (2026, April). PBM Reforms Signed Into Law, Reshaping Medicare Part D Drug Pricing Transparency. American Journal of Managed Care. Retrieved from https://www.ajmc.com/view/pbm-reforms-signed-into-law-reshaping-medicare-part-d-drug-pricing-transparency
[18] NFP. (2026, February 13). Pricing Transparency and Cost-Containment. Retrieved from https://www.nfp.com/insights/pricing-transparency-and-cost-containment/
[19] Mintz. (2025, November 4). PBM Policy and Legislative Update—Summer/Fall 2025. Retrieved from https://www.mintz.com/insights-center/viewpoints/2025-11-04-pbm-policy-and-legislative-update-summer-fall-2025
[20] DrugPatentWatch. (n.d.). Predict Generic Entry, Patent Risk, and Revenue Shifts—Before Your Competitors. Retrieved from https://www.drugpatentwatch.com/
[21] DrugPatentWatch. (2026, March 10). The Patent Cliff Playbook: Pharmaceutical IP Valuation, Generic Entry Timing, and Biosimilar Strategy. Retrieved from https://www.drugpatentwatch.com/blog/patent-expirations-seizing-opportunities-in-the-generic-drug-market/
[22] DrugPatentWatch. (2026, January 18). Maximizing Pharmaceutical Patent Longevity: A Mechanistic and Strategic Guide to IP Term Extension and Lifecycle Fortification. Retrieved from https://www.drugpatentwatch.com/blog/how-long-do-drug-patents-last/
[23] DrugPatentWatch. (2026, March 8). Expired and Abandoned Drug Patents: The Hidden Goldmine Everyone Ignores. Retrieved from https://www.drugpatentwatch.com/blog/expired-and-abandoned-drug-patents-the-hidden-goldmine-everyone-ignores/
[24] American Legislative Exchange Council. (2026, February 2). U.S. House Passes PBM Reforms: Where Are We Now? Retrieved from https://alec.org/article/u-s-house-passes-pbm-reforms-where-are-we-now/
[25] Drug Channels Institute. (2024, July 16). PBM Power: The Gross-to-Net Bubble Reached $334 Billion in 2023—But Will Soon Start Deflating. Drug Channels. Retrieved from https://www.drugchannels.net/2024/07/pbm-power-gross-to-net-bubble-reached.html
[26] Information Technology and Innovation Foundation. (2025, February 25). The Inflation Reduction Act Is Negotiating the United States Out of Drug Innovation. Retrieved from https://itif.org/publications/2025/02/25/the-inflation-reduction-act-is-negotiating-the-united-states-out-of-drug-innovation/
[27] Drug Channels Institute. (2024, July 23). Gross-to-Net Bubble Update: 2023 Pricing Realities at 10 Top Drugmakers. Drug Channels. Retrieved from https://www.drugchannels.net/2024/07/gross-to-net-bubble-update-2023-pricing.html
[28] AJMC. (2026, March). Under the Magnifying Glass: A Wave of Drug Price Transparency. American Journal of Managed Care. Retrieved from https://www.ajmc.com/view/under-the-magnifying-glass-a-wave-of-drug-price-transparency
[29] Petrie-Flom Center, Harvard Law School. (2025, May 22). The Global Risks of America’s ‘Most-Favored-Nation’ Drug Pricing Policy. Retrieved from https://petrieflom.law.harvard.edu/2025/05/22/the-global-risks-of-americas-most-favored-nation-drug-pricing-policy/
[30] Morgan Lewis. (2025, February 11). US Administration Signals Potential Changes to Inflation Reduction Act Drug Price Negotiations. Retrieved from https://www.morganlewis.com/pubs/2025/02/us-administration-signals-potential-changes-to-inflation-reduction-act-drug-price-negotiations
[31] Rodwin, M.A. (2025). Negotiating Medicare Drug Prices: A New Attempt to Control Purchase Prices. Journal of Law and the Biosciences, 53(1), 147-157. https://doi.org/10.1017/jme.2025.59
[32] Indegene. (2025, August 8). Most Favored Nation Drug Pricing Revisited. Retrieved from https://www.indegene.com/what-we-think/reports/mfn-end-price-gouging-for-medications-act
[33] Sidley Austin LLP. (2025). Drug Pricing Executive Order Aims to End Inflation Reduction Act ‘Pill Penalty,’ Resurrect Policies From First Trump Administration. Retrieved from https://www.sidley.com/en/insights/newsupdates/2025/04/drug-pricing-executive-order-aims-to-end-inflation-reduction-act-pill-penalty-resurrect-policies
[34] DrugPatentWatch. (2026, March 18). How to Check If a Drug Is Patented: The Complete Intelligence Playbook for Pharma Analysts, IP Teams, and Institutional Investors. Retrieved from https://www.drugpatentwatch.com/blog/how-to-check-if-a-drug-is-patented/
[35] DrugPatentWatch. (2026, February 23). Know Before the Cliff: How to Forecast Drug Patent Expiry. Retrieved from https://www.drugpatentwatch.com/blog/know-before-the-cliff-how-to-forecast-drug-patent-expiry/