The generic drug industry runs on a paradox. Generics fill more than 90% of all U.S. prescriptions yet account for roughly 18% of total drug spending. That chasm between volume and revenue is not a rounding error; it is the structural reality that dictates every pricing decision a generic manufacturer makes. Get the entry strategy right, and you capture a substantial slice of a market projected to expand from $491 billion in 2024 to $817 billion by 2034. Get it wrong, and you absorb the sunk costs of an Abbreviated New Drug Application (ANDA), years of patent litigation, and scale-up manufacturing investment, with nothing to show at launch.
This pillar page builds a complete operational and strategic framework for generic and biosimilar pricing. It is written for IP teams evaluating molecule targets, portfolio managers building NPV models, R&D leads assessing formulation complexity, and institutional investors who need to understand why two companies filing on the same patent cliff can produce wildly different financial outcomes.
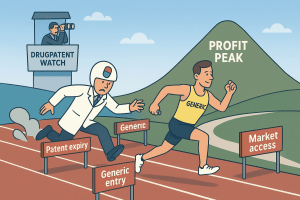
The Market Architecture: Why Generic Pricing is Not Discount Arithmetic
The Volume-Value Paradox and Its Strategic Implications
The 90%/18% split is not accidental. It is the deliberate outcome of the Hatch-Waxman Act’s design, which intended to drive prescription volume through generics while preserving innovator margin during exclusivity periods. The result is a market where enormous prescription share translates into thin per-unit economics, particularly once a molecule attracts six or more ANDA filers.
The global generic market’s projected compound annual growth rate sits between 5% and 8.5%, depending on the research house you consult. That variance itself carries analytical value. The spread reflects genuine uncertainty about two forces pulling in opposite directions: the predictable wave of patent expiries on blockbuster small molecules and biologics, on one hand, and the accelerating pace of price erosion driven by consolidation among generic manufacturers and PBM formulary management, on the other. A financial model anchored to a single CAGR estimate is fragile. Models that bracket the range, stress-testing NPV at 5% and 8.5% growth, produce more defensible investment cases.
The drugs now approaching loss of exclusivity (LOE) are not simply large in revenue terms. They are concentrated in therapeutic areas, including oncology, immunology, diabetes, and obesity, that carry high patient adherence and complex dosing requirements. That complexity increases the barriers to generic entry, which, in turn, supports pricing power for those manufacturers who clear the technical hurdles.
The Bifurcation of the Generic Business Model
The generic pharmaceutical industry has fractured into two distinct operating models, and the pricing strategy available to any given company depends almost entirely on which model it competes in.
The first model, which can be called Volume Operations, covers simple small-molecule oral solids, standard immediate-release tablets, and capsules where the chemistry is well-understood and manufacturing is mature. Atorvastatin, metformin, lisinopril, and their peers sit here. Price is the only lever. Margins are measured in single-digit percentages. The winning position belongs to the manufacturer with the lowest API cost, the highest plant utilization rate, and the most automated quality control infrastructure. Pricing in this segment is reactive: you watch what your four or five ANDA-holding competitors charge and you price at or slightly below them.
The second model covers complex generics, drug-device combination products, long-acting injectables, narrow therapeutic index drugs, and biosimilars. The FDA’s Office of Generic Drugs defines complex products by their active ingredient (complex mixtures, proteins, peptides), route of delivery, dosage form, or the complexity of the drug-device interface. This population includes inhaled corticosteroids, transdermal systems, liposomal formulations, and subcutaneous biologics. Barriers to entry are high enough, and the number of likely ANDA filers small enough, that manufacturers in this segment can build pricing models that incorporate a genuine return on technical investment rather than simply matching competitors.
The strategic choice of which segment to target precedes every other pricing decision. A company that commits R&D resources to crack a complex injectable formulation is buying pricing power measured in years, not months. A company that chases a me-too oral solid on a well-populated molecule is buying volume and accepting commodity economics from day one.
Key Takeaways: Market Architecture
The volume-value paradox in generics is structural and permanent. Pricing strategy must start with molecule and formulation selection, because the competitive density at launch, which is itself the strongest predictor of price erosion, is largely determined before an ANDA is filed. Complex formulations and biosimilars offer pricing power; simple oral solids do not. Stress-test NPV models across the published CAGR range rather than anchoring to a single market growth estimate.
Investment Strategy Note
Institutional investors evaluating generic manufacturers should weight R&D pipeline complexity as a leading indicator of sustainable margin. A portfolio weighted toward complex injectables, drug-device combinations, and biosimilars will outperform a simple-oral-solid portfolio on margin per prescription over any three-to-five year horizon, even if headline prescription volume appears lower. Track the ratio of complex-to-simple ANDA filings across a company’s pipeline as a proxy for future pricing power.
The Regulatory Game: Hatch-Waxman, Paragraph IV, and the 180-Day Prize
Hatch-Waxman as IP Architecture, Not Just Regulatory Pathway
The Drug Price Competition and Patent Term Restoration Act of 1984, universally called Hatch-Waxman, resolved a fundamental tension that had suppressed generic competition for decades. Before 1984, generic manufacturers were required to conduct their own clinical trials to demonstrate safety and efficacy, an obligation that was both duplicative and prohibitively expensive. Generic drugs held approximately 19% of U.S. prescription volume in 1984. They now exceed 90%.
The mechanism that made this possible is the ANDA. An ANDA applicant does not prove safety and efficacy from scratch. It proves bioequivalence to the Reference Listed Drug (RLD), meaning its formulation delivers the same amount of active ingredient into systemic circulation within the same time window as the brand-name product. The bioequivalence standard, expressed as a 90% confidence interval for the ratio of test-to-reference pharmacokinetic parameters (AUC and Cmax) falling within 80% to 125%, is the scientific shortcut that makes generic competition economically viable.
The Orange Book, formally ‘Approved Drug Products with Therapeutic Equivalence Evaluations,’ is the operational backbone of this system. It lists every FDA-approved drug, the patents protecting it, and the therapeutic equivalence rating assigned to each generic. For a generic IP team, the Orange Book is not simply a reference document. It is a competitive map. The patents listed there, and the patent certification a filer must make for each of them, determine the legal terrain that must be crossed before a product can launch.
The IP Valuation of Orange Book-Listed Patents
Every patent listed in the Orange Book has a discrete economic value that can be modeled before filing an ANDA. That value is a function of four variables: the remaining patent term at the time of projected generic launch, the annual net sales of the brand drug, the probability that a Paragraph IV challenge succeeds in invalidating or designing around the patent, and the likely number of ANDA filers who will attempt the same challenge.
For compound patents, which cover the active molecule itself, the IP value is typically highest and the challenge probability lowest. Compound patents are difficult to design around because the molecule is the drug. For formulation patents, covering specific excipient combinations or delivery mechanisms, the challenge probability increases because a generic manufacturer may be able to bioequivalently formulate around the patent claims. Method-of-use patents are the most vulnerable: they can be ‘carved out’ of the generic label through a so-called skinny label, allowing the generic to launch for non-patented indications while acknowledging the brand’s exclusivity for the patented indication.
The decision to mount a Paragraph IV challenge on any specific patent is therefore an IP valuation exercise as much as a legal one. The economic model should assign a probability-weighted NPV to each Orange Book-listed patent, accounting for litigation costs (typically $5 million to $15 million per patent per side through district court), the 30-month stay triggered by a brand lawsuit, and the size of the prize if the challenge succeeds.
The Paragraph IV Mechanism: Anatomy of a Challenge
A Paragraph IV (P-IV) certification states that the Orange Book-listed patent is either invalid, unenforceable, or will not be infringed by the proposed generic. Submitting an ANDA with a P-IV certification is, by statutory design, a constructive act of patent infringement. This triggers the brand’s right to sue within 45 days. If the brand files suit, the FDA cannot grant final approval to the ANDA for 30 months, or until the district court rules in the generic’s favor, whichever comes first.
The 30-month stay is the brand’s most powerful automatic defense. It buys roughly two and a half years to either litigate to a favorable outcome, exhaust the generic’s financial resources, or negotiate a settlement. For the generic filer, the stay represents a capital commitment: litigation costs accumulate while the product sits unapproved and generates zero revenue.
The strategic decision to file a P-IV is therefore not a binary go/no-go. It is a sequenced analysis. First, assess the probability of winning on validity and non-infringement for each listed patent, based on the claim scope, the prior art landscape, and any prosecution history estoppel. Second, model the litigation cost and timeline. Third, calculate the expected value of the 180-day exclusivity if the challenge succeeds. Fourth, discount that expected value by the probability of success and the probability of an Authorized Generic launch by the brand. Only when the risk-adjusted expected value exceeds the litigation cost plus the cost of a failed launch does the P-IV make financial sense.
The 180-Day Exclusivity: High-Value Asset with Complex Triggers
The 180-day first-to-file (FTF) marketing exclusivity is the primary financial incentive structure in Hatch-Waxman. During this window, the FDA cannot approve any subsequent ANDA for the same drug. The resulting market structure, a temporary duopoly or near-duopoly between the brand and the FTF generic, can generate hundreds of millions of dollars for a blockbuster molecule.
The exclusivity period begins on one of two triggering events: the date the FTF generic begins commercial marketing, or the date a court decision finds the challenged patent invalid, unenforceable, or not infringed. The second trigger creates a critical legal and financial trap that many companies underestimate.
A favorable district court ruling starts the 180-day clock. If the FDA has not yet granted final ANDA approval at that point, the exclusivity window begins burning before the company can ship a single unit. Consider the arithmetic: if the district court rules in the generic’s favor on day one of month four of a 30-month stay, the exclusivity clock begins. If FDA approval takes another five months, the generic enters the market with only one month of exclusivity remaining.
The at-risk launch scenario compounds the problem. A company with a district court win and FDA approval may choose to launch commercially before the brand’s appeal is resolved. If the appellate court subsequently reverses the district court, the generic manufacturer faces treble damages for willful infringement, calculated on the brand’s lost profits during the at-risk period. For a drug with $3 billion in annual brand revenue, even six months of at-risk sales implies a potential damages exposure in the hundreds of millions. The risk-adjusted pricing model for an at-risk launch must incorporate this contingent liability explicitly, typically by increasing the probability-weighted cost of capital for the launch program.
Evergreening Tactics: The Brand’s Full IP Defense Roadmap
Brand manufacturers do not concede market share passively. The practice of ‘evergreening,’ extending effective market exclusivity beyond the compound patent term through incremental IP strategies, is the standard lifecycle management playbook. Generic IP teams must map the full evergreening architecture before filing.
The primary evergreening tactics form a layered IP estate that can extend functional exclusivity by five to fifteen years beyond the compound patent:
Formulation patents cover modified-release mechanisms, specific polymorphic forms of the API, salt forms, ester prodrugs, and co-crystals. A generic manufacturer must either design around these claims or challenge them via P-IV. The challenge probability here is materially higher than for compound patents, because prior art showing the general concept of modified-release formulation may support an invalidity argument.
Dosing regimen patents protect specific dose levels, dosing intervals, or patient titration schedules. These are candidates for skinny-label carve-outs, where the generic label omits the patented regimen while retaining approval for non-patented indications. The legal risk is whether the carve-out is complete enough to preclude induced infringement claims.
Pediatric exclusivity adds six months to every Orange Book patent term for drugs that complete an FDA-required pediatric study under the Best Pharmaceuticals for Children Act. This is not a patent; it is a regulatory exclusivity layered on top of every listed patent. It cannot be challenged via P-IV. It simply delays generic entry by six months regardless of litigation outcome.
New Chemical Entity (NCE) exclusivity blocks FDA ANDA acceptance for five years from the NDA approval date, with a specific carve-out allowing P-IV filings in year four. Combined with a successful 30-month stay, NCE exclusivity can protect a new molecule for approximately 7.5 years from approval before any generic can enter, independent of the patent landscape.
Key Takeaways: The Regulatory Game
The 180-day FTF exclusivity is a probabilistic asset, not a guaranteed cash flow. Its value must be discounted by the probability of an Authorized Generic launch, the risk that the exclusivity clock begins running before FDA approval, and the contingent liability from an at-risk launch if the brand appeals a district court loss. Evergreening adds layered IP complexity that requires systematic Orange Book and patent portfolio analysis before committing to a P-IV filing. The economic value of challenging any individual patent is calculable, and that calculation should drive filing decisions.
Investment Strategy Note
For institutional investors, track the Orange Book-listed patent count and remaining terms for drugs in a company’s ANDA pipeline. A high count of secondary and tertiary patents on a given molecule signals that the brand has built a layered evergreening structure. Each additional layer reduces the probability-weighted NPV of a P-IV challenge. Companies that file on molecules with thin IP estates, where the compound patent is the primary or sole Orange Book entry, face lower litigation risk and clearer paths to FTF exclusivity.
Authorized Generics: How Brands Weaponize Their Own IP
The Authorized Generic Mechanism and Its IP Basis
An Authorized Generic (AG) is the brand manufacturer’s own drug product, sold under the original NDA at a generic price, without the brand name on the label. Because it operates under the NDA rather than an ANDA, the Hatch-Waxman exclusivity granted to the FTF generic does not block it. The 180-day exclusivity provision specifically prohibits the FDA from approving other ANDAs. It says nothing about the brand selling its own product under a different trade dress.
The AG effectively converts what the FTF generic calculated as a duopoly into a three-way market at the moment most critical to the generic’s financial case. The brand captures generic-priced market share directly, driving down the average generic price and reducing the FTF exclusive’s revenue by an amount the FTC quantified in its 2011 analysis: 40% to 52% revenue reduction during the exclusivity window.
AG IP Valuation: The Hidden Cost in Every P-IV Model
From an IP valuation standpoint, the AG option has a calculable monetary value to the brand. If the brand’s compound patent expires and the generic market is projected at $800 million annually, the AG option is worth roughly the brand’s fully-loaded margin on $400 million in sales during a six-month exclusivity window, or approximately $100 million to $150 million at typical brand operating margins, minus the cost of operating a generic-label distribution channel.
For the FTF generic, this is a direct reduction in the value of the exclusivity prize. A P-IV challenge model that ignores the AG option overvalues the FTF asset by roughly 50%. This is not a minor modeling error; it is the difference between a viable project and an uneconomic one on many mid-sized molecules.
Pay-for-Delay and the No-AG Clause
Settlement negotiations between brand manufacturers and P-IV challengers frequently include provisions that explicitly address the AG option. In a ‘reverse payment’ settlement, the brand compensates the generic firm to delay market entry. The FTC has identified two primary forms of this compensation: direct cash payments, and a promise by the brand not to launch an AG in exchange for the generic’s agreement to delay launch until an agreed-upon date.
The FTC’s characterization of these agreements as anticompetitive has been sustained by the Supreme Court’s 2013 decision in FTC v. Actavis, which held that reverse payment settlements can violate antitrust law under a rule-of-reason analysis. The practical effect is that companies entering into these settlements face regulatory scrutiny and litigation risk, but settlements continue because the alternative, years of district court and appellate litigation, is also expensive and uncertain.
A no-AG clause in a settlement agreement has quantifiable value to the FTF generic: it restores approximately 50% of the revenue that would otherwise be lost to an AG during the exclusivity period. The generic IP team negotiating a settlement should assign a dollar value to this clause based on the projected brand net price, expected prescription conversion rates, and the length of the exclusivity window. In practice, a no-AG commitment on a $1 billion drug can be worth $80 million to $120 million in incremental FTF generic revenue.
Key Takeaways: Authorized Generics
The AG option is a real, exercisable financial instrument held by every brand manufacturer whose product faces a P-IV challenge. Its expected cost to the FTF generic is a 40% to 52% revenue reduction during the 180-day exclusivity period. Every P-IV NPV model must incorporate the AG probability explicitly. A no-AG clause in a settlement agreement has calculable economic value and should be treated as a negotiable financial asset.
Pre-Launch Market Analysis: The Four-Pillar Intelligence Framework
Pillar 1: Molecule-Level Market Sizing with Patent Cliff Quantification
Market sizing for a generic launch operates at two levels simultaneously. The macro level establishes the growth trajectory of the overall generic market, the therapeutic class, and the payer landscape. The molecule level builds a bottom-up revenue model for the specific drug.
The macro analysis matters because generic market growth is not uniform across therapeutic classes. Oncology generics, particularly oral chemotherapy agents, have commanded pricing premiums 15% to 30% higher than the typical 60% discount off brand, reflecting physician reluctance to switch established cancer regimens and the higher inherent risk tolerance required of manufacturers who formulate cytotoxic compounds. Injectable generics for hospital use trade on supply chain reliability as much as price. Retail oral solids are pure commodity markets governed by PBM formulary placement.
The molecule-level model requires current brand net sales (not WAC, which is a fiction for drugs with high rebate liabilities), prescription volume segmented by channel (retail pharmacy, mail order, specialty pharmacy, hospital), patient population size and growth rate, and any pipeline data on new branded entrants that might erode the market before generic entry. The semaglutide case illustrates the model in practice. Indian generics analysts projecting the market after semaglutide patent expiry in India calculated an immediate price collapse of up to 80%, followed by a market expansion from approximately Rs 700 crore at launch to Rs 8,000-10,000 crore over the following decade as affordability drove adoption. That projection then feeds a bottom-up launch model: how many patients convert from brand to generic in year one, year two, and year three, at what price per course, and at what gross margin.
The ‘Forecast Delta’ as a Stress-Testing Tool
Research houses publishing generic market projections rarely converge. CAGR estimates for the global generic market over the next decade range from approximately 5% to 8.5% depending on assumptions about biosimilar uptake, IRA Medicare negotiation effects on the branded market, and API supply chain resilience. Rather than arbitrarily selecting a point estimate, the analytically rigorous approach uses both endpoints to define a scenario range. The project’s NPV at 5% growth represents a bear case; the NPV at 8.5% growth represents a bull case. The investment committee should see both, along with the assumptions driving each.
Pillar 2: Competitive Pipeline Intelligence
The number of eventual market entrants is the single most consequential input to the price erosion model. FDA data shows that a generic market with one entrant prices approximately 39% below the brand; two entrants produce a 54% discount; four entrants reach 79%; and six or more converge above 95% discount. The difference between a two-entrant market and a six-entrant market is not incremental. It is the difference between a viable business and a money-losing obligation to supply.
Competitive pipeline intelligence must therefore be forward-looking, not contemporaneous. At the time of your ANDA filing, the relevant question is not how many ANDAs are approved today, but how many will be approved by the time your product launches, 24 to 36 months from now.
The leading indicators of future competition, available through patent monitoring databases and FDA docketing systems, include the number of ANDAs already filed for the target drug, the number carrying P-IV certifications (signaling challengers pursuing early entry), the litigation docket for any P-IV suits already filed, and the number of tentative approvals already granted (signaling companies ready to launch the moment legal and exclusivity barriers clear). Specialized platforms that integrate Orange Book data, ANDA filing records, and litigation status allow a generic IP team to monitor this pipeline in near real-time and update its NPV model as new information arrives.
Advanced competitive intelligence goes further than counting filers. Patent prosecution filings by competitors can reveal their formulation strategies months before any public ANDA disclosure. A competitor filing broad claims around a specific polymorphic form of the API signals that they are pursuing a formulation approach that may be difficult to replicate, or that they intend to block other ANDA applicants through a separate IP position. Identifying these ‘stealth programs’ early allows a company to adjust its own formulation development or challenge the competitor’s claims preemptively.
Biosimilar Competition: A Different Intelligence Problem
For biosimilars, competitive intelligence requires tracking a different set of indicators. The number of 351(k) biosimilar applications filed with FDA, the interchangeability designations granted (which allow pharmacist-level substitution without prescriber authorization), and PBM formulary positioning decisions are all leading indicators of market structure. The Humira (adalimumab) experience demonstrated that a large number of approved biosimilars does not automatically translate into a competitive market. Interchangeability status and PBM co-promotion agreements turned out to be more decisive than launch pricing.
Pillar 3: Deconstructing the Brand’s IP and Commercial Position
Understanding the brand’s position requires forensic analysis at two levels: the IP estate and the commercial relationship infrastructure.
At the IP level, the goal is to map every Orange Book-listed patent by type (compound, formulation, method-of-use), remaining term, prosecution history, and prior art vulnerability. This mapping produces an ordered list of patents from most to least challengeable, which directly informs the P-IV filing strategy. A formulation patent with a weak prosecution history and strong prior art may be worth challenging even if the compound patent is solid, because a successful formulation challenge enables a skinny-label launch.
At the commercial level, the brand’s net price, not its WAC, is the ceiling from which generic launch pricing is calculated. Net price reconstruction requires analyzing rebate disclosures in the brand’s 10-K filings (which are increasingly detailed under federal transparency requirements), formulary placement data from PBM drug lists, and published analysis from drug pricing research organizations. A brand with a WAC of $500 per month but a net price of $200 after PBM rebates presents a much lower price ceiling for the generic launch than the WAC implies.
The brand’s PBM relationships are particularly important. A brand that has entrenched formulary positions with all three major PBMs through multi-year, portfolio-level rebate agreements will be harder to displace than one whose formulary access depends on a single product’s rebate economics. The generic entry strategy must account for the PBM relationship inertia the brand has built.
Pillar 4: The Price Erosion Curve as a Financial Model Input
The price erosion relationship between competitor count and market price is the most important quantitative input to any generic launch financial model. The data from HHS ASPE and FDA generic competition studies, covering Medicare Part D claims from 2007 through 2022, produces the following price reduction schedule relative to brand price:
One generic entrant: 39% discount. Two entrants: 54%. Three entrants: 61%. Four entrants: 79%. Five entrants: approximately 85%. Six or more entrants: above 95%.
This schedule is not linear. The marginal price drop from the first to second entrant (15 percentage points) is larger than from the third to fourth (18 percentage points) but the progression is roughly predictable. Critically, the steepest price collapse comes in the transition from a two-entrant market (54% discount) to a four-entrant market (79% discount). This zone represents the period most likely to make a generic product economically marginal for manufacturers with higher cost structures.
The correct way to use this schedule in financial modeling is to combine it with the competitive pipeline forecast from Pillar 2. If pipeline intelligence suggests two ANDA filers at month six post-launch, four at month twelve, and seven at month twenty-four, the price erosion model projects prices accordingly: 54% discount at month six, 79% at month twelve, and above 95% at month twenty-four. Multiplied by forecast prescription volume and your cost of goods structure, this produces a dynamic revenue and margin model across the product lifecycle, which feeds directly into the NPV and IRR calculation for the investment decision.
Key Takeaways: Pre-Launch Intelligence
Competitive pipeline forecasting, not current competitor count, drives the pricing model. The difference between a two-competitor and a six-competitor outcome at month twelve of launch can reduce gross margin by 40 percentage points. Brands with strong PBM relationships create commercial inertia that pricing alone cannot overcome. The net brand price, not WAC, is the correct ceiling for generic launch pricing benchmarks.
Cost of Goods Architecture: Building the Unassailable Cost Floor
The R&D Cost Advantage: What Generic Manufacturers Don’t Pay
The economic logic of generic drug production rests on the elimination of the innovator’s multi-billion-dollar, decade-long discovery and development cost. Hatch-Waxman allows the generic manufacturer to rely on the brand’s clinical data. The development cost for a simple generic is typically $2 million to $10 million, covering bioequivalence studies, analytical method development, and ANDA preparation. For a complex generic, that cost rises to $50 million to $150 million, and for a biosimilar, analytical characterization, clinical pharmacology studies, and comparability data can push development investment above $200 million.
Even at the high end, the generic developer’s investment is a fraction of the brand’s cost. That cost advantage is what makes the 60% to 95% price discount financially viable. The pricing floor is not set by what the brand spent; it is set by what the generic manufacturer needs to recover its own, much lower, development cost plus ongoing COGS.
COGS Architecture: API Dominance and Its Geopolitical Risks
The COGS structure for a typical small-molecule generic oral solid allocates approximately 50% to 52% of production cost to the Active Pharmaceutical Ingredient (API). Excipients and formulation account for 5% to 10%, direct labor for 10% to 15%, manufacturing overhead (utilities, depreciation, facility maintenance) for 10% to 20%, and quality and regulatory compliance for 10% to 25%.
The API’s dominant share of COGS makes API sourcing the primary cost management lever and the primary supply risk vector simultaneously. The U.S. generic drug market is heavily dependent on API manufactured in India and China. Indian manufacturers supply the majority of APIs used in generic drugs consumed in the U.S. market; Chinese manufacturers supply a substantial portion of the key starting materials (KSMs) and chemical intermediates that Indian manufacturers process into finished API.
This geographic concentration creates structural fragility. Trade disputes, export restrictions, environmental enforcement actions against manufacturing facilities, and domestic regulatory crackdowns in either country can disrupt API supply chains with minimal warning. The COVID-19 pandemic exposed this fragility acutely, accelerating regulatory and legislative pressure in the U.S. to onshore or nearshore critical API production. For a generic manufacturer, the cost of qualifying a second, geographically diversified API supplier must be treated as a cost of resilience and factored into the COGS model, even if the primary supplier currently offers the lowest unit price.
The Manufacturing Technology Inflection: Continuous Manufacturing
Traditional pharmaceutical manufacturing operates in batches. Each discrete step, granulation, compression, coating, testing, sits in sequence with cleanout, transfer, and retesting between stages. Continuous Manufacturing (CM) eliminates those discrete stages, operating as an integrated, uninterrupted production flow from API blend to finished dosage form.
The cost economics of CM represent a structural advantage large enough to alter competitive dynamics in a commodity generic market. Comparative analyses of CM versus batch manufacturing show facility cost reductions of 30% to 50%, labor cost reductions of 25% to 40%, quality control cost reductions of 30% to 50%, and physical footprint reductions of up to 70%. A CM facility operating at scale can produce finished oral solid dosage forms at a COGS that would be unachievable through batch processing.
The strategic implication is direct. In a market with six or more generic competitors, where price has converged to more than 95% below brand WAC, the only manufacturers that remain profitable are those with the lowest marginal cost of production. A company that has invested in CM can sustain positive gross margins at price points that drive batch-manufacturing competitors to market exit. The resulting consolidation then reduces the number of active suppliers, which can trigger price recovery, at which point the CM operator’s margin advantage compounds.
For a generic manufacturer evaluating CM investment, the decision is not solely a manufacturing capital allocation question. It is a long-term competitive positioning decision that determines whether the company can compete profitably in the highest-volume, most price-competitive segment of the market.
Fixed Tollbooth Costs: GDUFA Fees and Litigation Amortization
Two categories of fixed costs must be amortized against product revenue and are frequently underweighted in simplified financial models.
GDUFA fees, established under the Generic Drug User Fee Amendments, include ANDA filing fees, Drug Master File (DMF) fees for the API, and annual facility fees for both finished dosage and API manufacturing sites. Facility fees for a single U.S. manufacturing site can exceed $500,000 annually. For companies operating multiple facilities, aggregate GDUFA fee exposure can run into the millions of dollars per year, independent of which products are being developed or manufactured. These fees must be allocated across all products in development and production to arrive at a true all-in cost basis.
Patent litigation costs for a contested P-IV challenge typically run from $5 million to $15 million through the district court phase, per patent, per side. Companies that challenge patents with multiple listed claims, or where the brand asserts multiple patents simultaneously, can face cumulative litigation costs of $30 million to $60 million before any appellate risk is added. These costs must be amortized over the expected sales volume during the exclusivity period and subsequent open market phase. Amortizing $40 million in litigation costs against the projected FTF exclusivity revenue is a direct test of whether the P-IV challenge is economically rational before it is filed.
Key Takeaways: COGS and Cost Floor
API is 50% of COGS and the most volatile cost component, exposed to geopolitical and supply chain risks that require diversified sourcing as a standard practice. Continuous Manufacturing can reduce total production costs by 30% to 50%, translating into a structural pricing advantage in commoditized markets. GDUFA fees and litigation costs are significant fixed obligations that must be explicitly amortized in any financial model; companies that exclude them understate the true cost basis and overstate project NPV.
Investment Strategy Note
CM adoption is a leading indicator of long-term cost competitiveness for generic manufacturers. Investors should track which companies have received FDA approval for CM-based production lines, which is disclosed in facility inspection reports and FDA approval letters. Companies with operational CM capabilities for high-volume molecules have a defensible cost advantage that is difficult for competitors to replicate quickly.
The Phased Pricing Strategy: From Launch Day Through Commodity Market
Phase 1: Value Capture During the Limited-Competition Window
The FTF exclusivity period is the only time in a generic product’s life when pricing can be set on a value-capture basis rather than a cost-matching basis. Pricing during this phase is benchmarked downward from the brand’s net price, typically launching at 15% to 30% below brand WAC, calibrated to drive rapid payer and formulary conversion without collapsing the price floor prematurely.
The financial rationale is straightforward. The 180-day period, or whatever limited-competition window exists, is the window during which the manufacturer must recoup its ANDA development costs, litigation investment, and scale-up costs. A launch price that maximizes short-term revenue per unit, while still offering enough price incentive to drive formulary placement, maximizes the NPV of the exclusivity asset.
First-mover advantages in the generic market are durable. Studies of launch dynamics across multiple blockbuster generic launches show that the first ANDA entrant captures 80% more market share than the second entrant, and 225% more than the third. Atorvastatin’s first generic captured over 70% of the genericized market at launch; Teva’s generic sildenafil took 70% of market share within twelve months. These first-mover positions can persist for three to ten years due to prescription habit inertia, pharmacy stocking preferences, and the PBM’s own administrative reluctance to re-tier a product that is already on the preferred list.
Pricing the At-Risk Launch: Risk Adjustment Mechanics
When a company launches at-risk, after a favorable district court ruling but before appellate resolution, the pricing decision requires a formal risk-adjustment. The expected value of the at-risk period is:
(Probability of appellate confirmation x Revenue during at-risk period x Gross margin) minus (Probability of appellate reversal x Treble damages)
Treble damages are calculated on the brand’s lost profits, not the generic’s revenue. For a $3 billion drug, if the generic captures 40% of prescriptions at a lower net price during a six-month at-risk period, the brand’s lost profit claim could plausibly be $300 million, which trebled is $900 million. If the probability of reversal is 25%, the expected damages liability is $225 million. That must be weighed against the expected gross margin from at-risk sales, which for the same scenario might be $80 million to $120 million. Many companies conclude the at-risk launch is not financially rational on these terms, even after a strong district court win.
Phase 2: Market Share Retention in the Hyper-Competitive Market
Once exclusivity ends and multiple ANDAs receive final approval, pricing shifts from value capture to market share defense. In this phase, pricing is market-based: you watch competitor net prices through PBM chargeback data, wholesaler price lists, and customer purchasing feedback, and you price to remain competitive on net cost per prescription while covering marginal COGS.
The floor in this phase is the marginal cost of production. A company that prices below marginal COGS is destroying value with every unit sold. The correct response to that situation is either cost reduction (if achievable within a relevant timeframe) or market exit. Drug shortages in the U.S. generic injectable market, where average shortage duration now exceeds three years, are partly explained by manufacturers exiting markets where prices have eroded below the marginal cost of GMP-compliant sterile manufacturing.
The Phase 2 pricing dynamic creates a natural selection mechanism. Companies with lower COGS can maintain profitability at lower price points, survive the consolidation that follows commodity price competition, and ultimately achieve higher market share at a stable residual price after weaker competitors have exited. The strategic investment in CM, in vertically integrated API production, and in manufacturing scale is not primarily about reducing current unit cost; it is about surviving the Phase 2 price war that follows every successful generic launch.
The PBM Labyrinth: Spread Pricing, Formulary Mechanics, and the Two-Price Reality
No analysis of U.S. generic pricing is complete without an explicit treatment of Pharmacy Benefit Manager economics. The three largest PBMs, CVS Caremark, Express Scripts (Cigna), and OptumRx (UnitedHealth), collectively manage formulary access for the majority of commercially insured U.S. patients. Their business practices create a pricing environment that is, in important respects, the inverse of what economic theory would predict.
Spread Pricing and the Perverse Incentive for Higher List Prices
PBMs in many market segments profit from spread pricing: they reimburse the dispensing pharmacy at one price and bill the health plan at a higher price, retaining the difference. For generic drugs, which have low absolute prices, the spread per prescription is small in dollar terms but large in percentage terms. An Ohio Medicaid audit found average spreads of 31.4% on generic prescriptions.
The relevant implication for a generic manufacturer is counterintuitive. A generic drug with a very low WAC leaves little room for the PBM to build a profitable spread. The PBM has limited financial incentive to promote a product that generates minimal spread revenue. To gain preferred formulary placement, a generic manufacturer may need to set a higher list price than the minimal-margin floor, then offer a direct rebate to the PBM to generate the spread that makes the product financially attractive to the intermediary.
This produces the ‘two-price reality’: a list price calibrated to create PBM margin, and a net price to the manufacturer calibrated to cover COGS and generate acceptable gross margin. The gap between these two prices is the rebate paid to the PBM as the cost of formulary access. For a company optimizing solely on net price, ignoring PBM economics, the optimal price is the lowest net cost per unit. For a company operating in the actual U.S. payer environment, the optimal pricing architecture is a higher WAC paired with a contracted rebate structure.
Formulary Tier Mechanics and Generic Displacement Risks
The standard expectation is that generics automatically populate Tier 1 (lowest co-pay) of a drug formulary, displacing the brand to Tier 2 or Tier 3. This expectation is correct in most cases but has notable exceptions driven by PBM rebate economics.
In some therapeutic classes, the brand manufacturer offers sufficiently large portfolio-level rebates to maintain Tier 1 or Tier 2 positioning even after generic entry. Under this arrangement, the net cost to the PBM for the brand, after rebates, is lower than the generic’s list price. The PBM then keeps the brand on preferred formulary and lists the generic at a higher tier. This is not illegal, but it is commercially damaging to the generic manufacturer and materially delays patient access to the lower-cost alternative.
The generic manufacturer’s response must include a direct rebate strategy competitive with the brand’s rebate offer, targeted at securing Tier 1 placement, combined with utilization management tools (prior authorization, step therapy) that encourage payers to implement formulary controls favoring the generic. In high-stakes therapeutic classes, this negotiation is as important as the launch price itself.
The Humira Case: PBM Co-Promotion as Market Access Strategy
The adalimumab biosimilar launch in the U.S. illustrates the extreme version of PBM market power. After patent litigation settlements established biosimilar market entry timelines, multiple products, including Sandoz’s Hyrimoz, Coherus’s Yusimry, and Boehringer Ingelheim’s Cyltezo, launched in early 2023. By conventional generic market theory, a field of ten or more biosimilars at prices 20% to 80% below Humira’s WAC should have driven rapid market conversion.
Instead, Humira retained over 97% of its prescription volume through the first year of competition. PBMs continued placing Humira on preferred formulary tiers because AbbVie’s portfolio-level rebate structure made the brand’s net cost competitive with biosimilars. The biosimilar manufacturers, lacking Humira’s rebate leverage, could not secure the formulary placement necessary to drive conversion.
The market only shifted when CVS Caremark deployed its subsidiary Cordavis to co-promote Sandoz’s Hyrimoz under a co-branded arrangement, then removed Humira from its formulary entirely. Hyrimoz captured approximately 14% of all adalimumab prescriptions within one month of the formulary change. The lesson is structural: in biosimilar markets with strong incumbents, market access depends more on PBM partnership strategy than on product price. The winning biosimilar manufacturer may be the one that offers the PBM the most attractive economics and relationship architecture, including a co-promotion arrangement, rather than the one that offers the lowest launch price.
Key Takeaways: Phased Pricing and PBM Strategy
The FTF exclusivity window is the only period where value-capture pricing is viable. First-mover market share advantages are durable and quantifiable; the first entrant captures 225% more market share than the third entrant. At-risk launches require formal probability-weighted NPV analysis that includes potential treble damages liability. The U.S. PBM environment creates a two-price reality where WAC and net price serve different strategic functions. Biosimilar market access in concentrated PBM environments may require PBM co-promotion partnerships rather than competitive pricing alone.
Investment Strategy Note
For analysts modeling generic and biosimilar revenues, the WAC-to-net price gap is the critical adjustment. A biosimilar launching at 30% below brand WAC but without PBM formulary access will underperform a biosimilar launching at 15% below brand WAC with Tier 1 placement on three major PBM formularies. Market access agreements should be tracked as leading revenue indicators, not lagging commercial metrics.
IP Valuation Deep Dives: Atorvastatin, Imatinib, and Adalimumab
Atorvastatin (Lipitor): The Canonical Patent Cliff Playbook
Pfizer’s atorvastatin, marketed as Lipitor, was at its peak the world’s best-selling drug, generating annual revenue exceeding $12 billion. Its patent expiry and subsequent generic entry represent the most-studied example of a blockbuster patent cliff in pharmaceutical history.
IP Estate Valuation at Expiry
The primary compound patent on atorvastatin expired in late 2011. Pfizer had pursued an aggressive lifecycle management strategy, listing multiple formulation and process patents in the Orange Book to delay generic entry beyond the compound patent expiry date. Ranbaxy filed the first P-IV certification, challenging these secondary patents, and became the FTF ANDA applicant after years of litigation. Watson Pharmaceuticals was among the subsequent ANDA filers.
The IP valuation of the atorvastatin franchise at the time of generic entry can be quantified in retrospect. The compound patent’s residual value to Pfizer, measured as the present value of profits foregone to generic competition, was approximately $4.7 billion in annual savings projected for the healthcare system, which is the inverse of the revenue Pfizer was no longer able to capture. The secondary formulation patents, which Ranbaxy successfully challenged, had delayed generic entry and preserved that revenue stream for a period measured in years.
For the FTF generic, the prize was correspondingly large. During Ranbaxy’s 180-day exclusivity, the market was briefly a duopoly, and Ranbaxy’s generic captured substantial revenue at prices approximating a 20% to 30% discount to brand WAC.
Pfizer’s Co-Pay Card Defense: Brand IP Monetization Beyond Launch
Pfizer’s response to generic entry illustrates a sophisticated brand defense strategy that does not rely on IP litigation. The Lipitor-For-You co-pay assistance program reduced out-of-pocket costs for commercially insured patients taking brand Lipitor to as little as $4 per month, frequently below the patient co-pay for the generic alternative. Pfizer simultaneously offered deep rebates to PBMs and health plans, making the brand’s net cost competitive with the generic’s net cost during the exclusivity period.
This strategy does not extend the patent or create new IP. It uses the brand’s marketing budget to create an effective price floor in the generic market. A generic manufacturer competing against a brand co-pay card program must account for it explicitly in market share projections. The co-pay card temporarily neutralizes the patient’s financial incentive to request the generic, slowing market conversion during the most profitable phase of the generic lifecycle.
Imatinib (Gleevec): When Pay-for-Delay Costs Payers $700 Million
Novartis’s Gleevec, the first tyrosine kinase inhibitor approved for chronic myeloid leukemia (CML), carried a list price of approximately $123,000 per year by the time its primary patent approached expiry. The drug was genuinely transformative for CML patients, converting a historically fatal disease into a manageable chronic condition.
IP Estate and the Settlement Architecture
Novartis’s Orange Book patent estate for imatinib included the compound patent and several secondary formulation patents covering the beta-crystalline form. Sun Pharmaceuticals filed the first P-IV certification and entered into a settlement agreement with Novartis that included a delayed entry provision, pushing Sun’s launch from July 2015 to February 2016, a six-month delay.
The economic cost of that six-month delay, calculated at the brand’s then-current list price for the patient population, was approximately $700 million in additional spending by payers and patients relative to what would have been paid under full generic competition. This is the quantifiable cost of a reverse-payment settlement, and it is the metric the FTC uses to evaluate the anticompetitive harm from pay-for-delay agreements.
Sun Pharma’s Launch Pricing: The 6.4% Discount That Shocked the Market
When Sun Pharma launched generic imatinib in February 2016, the initial price was approximately 6.4% below Gleevec’s then-current list price. This was not a competitive market-clearing price; it was a strategic positioning decision to maximize revenue during the initial exclusivity window, leveraging the market dynamics created by the settlement’s delayed entry provision.
The 6.4% discount illustrates a critical principle: the pricing strategy during the FTF exclusivity window is not constrained by competitive pressure from other generics. It is constrained only by payer resistance and formulary mechanics. If payers are willing to pay a price that is 6.4% below brand list for the first generic, and if no other generic competitor has entered the market, that is the revenue-maximizing price for that moment. The Novartis executives who reportedly characterized this as ‘good news’ understood that a high-priced generic entry extended the period during which the overall market price remained elevated, benefiting the brand’s own ongoing commercial position.
The broader implication for IP teams is that settlement terms, entry date, and the no-AG commitment (or its absence) collectively determine the pricing power of the FTF generic at launch. A settlement that delays entry but includes no competitive constraints on Sun’s launch pricing allowed both parties to benefit from a controlled, high-price market entry.
Adalimumab (Humira): Biosimilar IP, PBM Architecture, and Interchangeability Designation
AbbVie’s Humira, with peak annual sales exceeding $20 billion, is the best-selling drug in pharmaceutical history. Its biosimilar landscape is the most complex and commercially instructive in the industry.
AbbVie’s IP Fortress: The ‘Patent Thicket’ Strategy
AbbVie built what analysts and litigants have called a ‘patent thicket’ around adalimumab, accumulating more than 130 patents covering formulation, manufacturing process, dosage form, concentration, administration device, and methods of treating specific indications. When the core composition-of-matter patent expired, AbbVie retained IP protection through this secondary patent estate. Settlement agreements with every major biosimilar manufacturer, including Sandoz, Amgen, Boehringer Ingelheim, and others, established U.S. entry dates in 2023, years after the core patent expiry date. These settlements also include restrictions on biosimilar entry into certain markets as part of their terms.
The IP valuation of this thicket strategy is measurable. The delayed entry allowed AbbVie to extend Humira’s exclusivity in the U.S. market by approximately six years beyond the core patent expiry, preserving tens of billions of dollars in brand revenue that would otherwise have transferred to biosimilar manufacturers. AbbVie’s R&D investment in building the secondary patent estate, including clinical studies supporting new formulations and combination patents covering its pre-filled syringe device, cost a fraction of the revenue it protected.
Interchangeability Designation: The Regulatory Moat for Biosimilar Leaders
In the biosimilar market, the FDA’s interchangeability designation is a significant competitive differentiator. An interchangeable biosimilar can be substituted for the reference product by a pharmacist without prescriber authorization, subject to state pharmacy practice laws. This designation, which requires demonstration of switching equivalence through clinical studies showing no increased safety or efficacy risk from alternating between the biosimilar and the reference product, materially increases the likelihood of prescription-level automatic substitution.
For a biosimilar manufacturer, obtaining interchangeability designation is worth a quantifiable increment in formulary access and market share. Pharmacies can and will substitute an interchangeable biosimilar at the point of dispensing, particularly when the PBM’s formulary places the biosimilar on a preferred tier. Without interchangeability, the prescriber must actively re-write the prescription for the biosimilar, creating a conversion barrier at the point of care. The development cost of the switching study required for interchangeability is $30 million to $80 million for a typical subcutaneous biologic; the commercial value of the designation can exceed $500 million in incremental lifetime revenue for a successfully launched product.
Key Takeaways: IP Valuation Case Studies
Secondary patent estates (formulation, process, device) can extend functional exclusivity by five to fifteen years beyond the compound patent. The cost of building this IP protection is far less than the revenue it preserves. Pay-for-delay settlements have a calculable cost to payers, which creates regulatory and litigation risk for companies that pursue them aggressively. Biosimilar market success depends as much on interchangeability designation and PBM partnership architecture as on launch price. The Humira experience shows that ten approved biosimilars at competitive prices can fail to generate meaningful market share without PBM formulary support.
International Pricing Frameworks: IRP, Emerging Markets, and Global Launch Sequencing
International Reference Pricing: Mechanism and Pharmaceutical Market Impact
International Reference Pricing (IRP) is the practice by which a government sets or negotiates the price of a drug based on the prices paid for that same drug in a basket of comparator countries. More than 25 European countries use some form of IRP. The basket composition, the calculation method (lowest price, average, median), and the frequency of price revisions vary significantly by country.
For branded drugs, IRP creates a well-documented problem: launching first in a low-price market creates a ceiling that propagates through the entire European reference basket, depressing prices in subsequent launch markets. This incentivizes pharmaceutical companies to delay launches in reference countries or to conduct price negotiations in parallel rather than sequentially.
For generic drugs, IRP operates differently but with equally significant consequences. Generic drug prices in IRP markets are typically set as a percentage below the brand’s IRP-based price. If IRP compresses the brand ceiling, the generic’s maximum price is compressed by the same mechanism. A generic launching in a country where the brand’s IRP-derived price is 40% of U.S. WAC will face a price ceiling far lower than one launching where the brand price reflects market negotiation without IRP constraints.
Emerging Market Generic Pricing: Volume vs. Margin Dynamics
Emerging markets, particularly India, Brazil, and Southeast Asia, present a distinct pricing challenge. In these markets, out-of-pocket spending dominates pharmaceutical purchasing for the majority of patients. Price sensitivity is extreme. The competitive landscape differs fundamentally from the U.S.: branded generics, where a generic manufacturer markets a product under its own trade name, command modest price premiums over commodity generics and are frequently preferred by prescribers.
The semaglutide market in India exemplifies the volume-versus-margin dynamic. At a projected price collapse of 80% post-generic entry, the revenue per course of treatment drops dramatically. But the patient population that becomes financially capable of accessing the drug expands by an order of magnitude. A manufacturer pricing at the low end of the post-patent market captures volume that compensates for the compressed per-unit margin. A manufacturer that prices at a higher level to protect margin risks ceding volume to competitors who prioritize market penetration.
Global Launch Sequencing Strategy
For generic and biosimilar manufacturers operating across multiple markets, the sequence of country launches is a strategic decision with financial consequences that extend across the entire global portfolio. Launching first in the U.S. or Germany, markets with higher price ceilings and more favorable generic pricing dynamics, establishes a reference price that does not immediately propagate through IRP baskets. Launching first in a low-price IRP market establishes a floor that competing countries can reference, potentially depressing prices in all subsequent markets.
The optimal global sequencing strategy involves launching first in markets with the highest absolute price potential and weakest IRP linkages, then sequencing into IRP-connected markets in an order that minimizes reference cascades. This requires a centralized global pricing team with real-time visibility into IRP basket compositions, revision schedules, and the price history of the drug in each reference country.
Key Takeaways: International Pricing
IRP compresses generic price ceilings by compressing brand reference prices. The optimal global launch sequence enters high-price markets before IRP-connected markets to minimize reference price cascades. In emerging markets, the volume-versus-margin trade-off is explicit, and market penetration pricing may generate higher lifetime NPV than margin-protective pricing given the large, price-sensitive patient populations.
The Future Architecture: Complex Generics, Biosimilar Policy, and Manufacturing Transformation
Complex Generic Technology Roadmap
The strategic flight from commoditized oral solids toward complex generics is producing a technology roadmap that will define generic market structure for the next decade. The FDA’s Complex Drug Substances and Drug Products Working Group has identified the primary formulation categories that qualify as complex, and each carries a distinct development and IP challenge profile.
Inhalation products, including metered-dose inhalers and dry powder inhalers, require bioequivalence demonstration through in vitro device characterization studies in addition to pharmacokinetic data. The device-drug combination IP challenge is particularly acute: the metered-dose inhaler device may carry active patents independent of the drug IP, requiring parallel P-IV strategies for both the drug and device Orange Book listings.
Long-acting injectable formulations, including microsphere-based products and in-situ forming implants, require characterization of drug release kinetics across the full therapeutic duration, which can extend to one to three months per injection. The bioequivalence pathway for these products often requires in vivo pharmacokinetic studies rather than simple AUC/Cmax comparisons, because the release kinetics differ structurally from immediate-release comparators.
Topical products, including creams, gels, and transdermal patches, require demonstration of dermatopharmacokinetic equivalence or, for some categories, pharmacodynamic endpoint studies. The FDA has developed product-specific guidances for many of these dosage forms, but significant scientific uncertainty remains for complex topicals, creating barriers to ANDA approval that limit competitive entry.
Ophthalmic suspensions and complex ocular formulations require sterility combined with specific particle size distributions and viscosity profiles. Each of these characteristics may be covered by formulation patents, requiring a P-IV strategy on multiple Orange Book entries simultaneously.
Biosimilar Policy Evolution: IRA, Medicare Negotiation, and Part D Redesign
The Inflation Reduction Act’s Medicare drug pricing negotiation provisions, effective beginning with selected drugs in 2026, will alter the reference price landscape for biosimilars. When Medicare negotiates a price for a reference biologic, the negotiated price becomes the effective ceiling for Medicare Part B and Part D reimbursement of that product. Biosimilars priced as discounts from the negotiated brand price will face different market dynamics than biosimilars priced as discounts from an unnegotiated WAC.
The specific mechanism matters. If Medicare negotiates Humira’s price from a WAC basis down to, for example, 80% of current WAC, biosimilars must then demonstrate price advantage relative to this already-reduced reference, not the original WAC. This compresses the absolute dollar discount that a biosimilar can offer while maintaining a positive price position relative to the brand. For biosimilar manufacturers, the IRA’s negotiation provisions may reduce the addressable price gap and therefore the financial rationale for biosimilar development on drugs that enter the negotiation list.
Supply Chain Onshoring: Regulatory and Cost Implications
Federal policy pressure to onshore API manufacturing, including the BIOSECURE Act’s provisions restricting U.S. government procurement from certain Chinese pharmaceutical manufacturers, is beginning to alter the API supply chain economics that have defined generic drug production costs for two decades. Domestic API production is estimated to cost 20% to 40% more than equivalent offshore production from established Indian or Chinese manufacturers.
For generic manufacturers with domestic API production ambitions or obligations, this premium must be incorporated into COGS models. In a commodity market where price erosion to 95% below brand WAC is the eventual equilibrium, a 20% to 40% API cost premium may render certain molecules unprofitable to produce domestically without federal procurement preferences or production subsidies.
The policy trajectory suggests that domestic API production will be incentivized through a combination of mandates, procurement preferences (analogous to the Defense Production Act mechanism used for critical medical countermeasures), and potentially direct production subsidies. Generic manufacturers that proactively build domestic API capabilities position themselves advantageously for this regulatory environment, even if the short-term cost is higher.
Key Takeaways: Future Architecture
Complex generic product development requires technology investment that extends the barrier-to-entry timeline by years and limits the eventual competitive set, supporting more durable pricing power. The IRA’s Medicare negotiation provisions will compress the absolute biosimilar price advantage relative to negotiated brand prices, potentially reducing biosimilar development ROI for drugs on the negotiation list. API onshoring will add 20% to 40% to production costs for domestic sourcing scenarios, which requires either domestic procurement incentives or pricing adjustments to remain viable.
A Synthesis: The Integrated Generic Pricing Decision Framework
The optimal launch price for a generic drug is not a number produced by a formula. It is the output of a sequenced analytical process that integrates legal assessment, competitive intelligence, cost modeling, and commercial strategy. The sequence is:
Select the target molecule based on IP estate vulnerability (compound patent expiry, thin secondary patent estate), market size at generic pricing, and technical feasibility for your manufacturing capabilities. Run the P-IV economic model: probability-weighted expected value of the FTF exclusivity adjusted for the AG probability, litigation costs, and at-risk launch contingent liability. If the risk-adjusted NPV exceeds the investment threshold, file the ANDA and P-IV. Build the pre-launch intelligence framework across all four pillars: macro market sizing and scenario analysis, competitive pipeline monitoring for ANDA count projection, brand net price reconstruction and PBM relationship mapping, and price erosion curve modeling linked to pipeline forecasts. Construct the COGS model from API sourcing through packaging, incorporating the amortization of GDUFA fees and litigation costs. Identify the lowest sustainable price point that covers all-in costs including capital allocation. Set the launch price architecture with two components: the WAC, calibrated to create acceptable PBM spread economics, and the net price, calibrated to cover COGS and generate target gross margin. Engage PBMs and payers before launch with a formulary access strategy that includes the financial structure necessary to secure preferred tier placement. Monitor competitive entry in real time post-launch and adjust net pricing as competitor count increases, managing the erosion curve with the cost floor as the binding constraint.
This process does not guarantee a profitable launch. Generic pricing involves structural risks, regulatory delays, at-risk launch liability, and PBM market power that can neutralize even a well-constructed strategy. But executing this framework systematically reduces the probability of a catastrophic outcome: over-pricing into formulary exclusion, under-pricing into margin destruction, or failing to anticipate competitive density that collapses the economics before COGS are recovered.
The generic drug market rewards disciplined pre-launch analysis more consistently than any other variable. The companies that win the long game are the ones that make explicit, quantified decisions at every decision point, from molecule selection through post-launch pricing management, rather than relying on heuristics or historical analogies.
Frequently Asked Questions
What is the optimal first-generic discount during 180-day exclusivity?
The revenue-maximizing launch price for the FTF generic during 180-day exclusivity typically ranges from 15% to 30% below the brand’s WAC. The lower bound of this range reflects the minimum discount required to drive payer and formulary conversion; the upper bound reflects the price below which you begin leaving material revenue on the table. A deeper discount accelerates market share capture but reduces per-unit revenue during the most profitable phase of the product lifecycle. The exact calibration depends on the brand’s net price, whether the brand is deploying a co-pay card program, and the PBM’s formulary positioning.
How does an Authorized Generic change the launch pricing calculation?
An AG during the exclusivity period converts the expected duopoly into a three-player market and reduces FTF generic revenues by 40% to 52%, per the FTC’s empirical analysis. The correct response is to discount the expected revenue from the exclusivity period by this percentage when the brand has a history of AG deployment or when intelligence suggests an AG launch is likely. A no-AG clause in a settlement agreement is worth recovering this discount, and should be valued accordingly in settlement negotiations.
At what competitor count does a generic market become economically marginal?
The price erosion data from HHS ASPE shows that price reduction versus brand reaches approximately 79% at four competitors and exceeds 95% at six or more. For a drug with a brand WAC of $100 per unit, six competitors drive the market price below $5. Whether that price is above or below your COGS depends entirely on your manufacturing cost structure. For batch-manufactured oral solids, marginal COGS for a mature molecule is typically $0.50 to $2.00 per unit, leaving positive margin even at six-competitor pricing. For sterile injectables, GMP compliance costs push marginal COGS higher, and markets with five or more competitors may not be viable without manufacturing scale.
How do you structure a PBM engagement strategy for a biosimilar launch?
A biosimilar PBM strategy must start before ANDA or 351(k) approval. Early engagement with formulary decision-makers at the three major PBMs, CVS Caremark, Express Scripts, and OptumRx, should begin eighteen to twenty-four months before projected launch. The engagement must include a financial offer that creates economic value for the PBM, whether through direct rebates, co-promotion economics, or a partnership structure like the Sandoz-Cordavis arrangement. Interchangeability designation, if achievable, substantially improves the formulary negotiating position by enabling automatic substitution. Without preferred formulary placement, even a biosimilar priced 80% below brand WAC may capture less than 5% market share in the first year.
What is the financial impact of the IRA’s Medicare negotiation provisions on biosimilar development ROI?
When Medicare negotiates the brand drug price below WAC, the biosimilar’s economic advantage is measured against the negotiated price rather than the pre-negotiation WAC. If Medicare negotiates a 20% price reduction on a reference biologic, and the biosimilar was projected to launch at 20% below brand WAC, the biosimilar’s net price advantage collapses to zero on a Medicare-covered patient basis. Biosimilar developers should model their development ROI scenarios using both the current WAC and a range of potential negotiated prices to assess whether the project remains viable if the reference drug enters the negotiation list before the biosimilar achieves market penetration.
This analysis draws on publicly available FDA regulatory data, HHS ASPE Medicare competition studies, FTC enforcement reports, peer-reviewed health economics literature, and corporate disclosure filings. It does not constitute legal, financial, or regulatory advice. Readers should consult qualified legal and commercial advisors before making investment or product development decisions.