A drug patent is not a legal document. It is a financial instrument — one whose value fluctuates from zero to tens of billions depending on eight compounding variables that most valuation models either collapse into a single ‘IP strength’ score or miss entirely. This guide breaks them apart.
The rNPV on a composition-of-matter patent for a Phase I CNS asset sits closer to $30M. The same CoM patent on a Phase III GLP-1 agonist with Breakthrough Therapy Designation might be valued north of $4B. The molecule in both cases could weigh the same. The difference is the architecture around it — the patent thicket density, the probability-of-success stack, the litigation-adjusted revenue tail, the statutory exclusivity layer, and the post-Amgen v. Sanofi enablement risk baked into every broad genus claim.
This analysis is for pharma IP teams conducting portfolio audits, portfolio managers sizing licensing bids, R&D leads assessing pipeline assets before partnering discussions, and institutional investors modeling loss-of-exclusivity events. It covers each valuation driver at the technical depth required to make actual decisions.
Factor 1: Composition of Matter Claims, Secondary Patent Architecture, and Effective Market Life
What the ‘Gold Standard’ Actually Buys You
A composition of matter patent covers the active pharmaceutical ingredient itself — the specific chemical compound or biologic molecule responsible for therapeutic effect. It is the most direct form of pharmaceutical IP protection because it blocks any product containing that structure, regardless of formulation, dosing regimen, or indication. For decades, the CoM expiration date was treated as synonymous with loss of exclusivity. That model is now obsolete.
The effective commercial life of a CoM patent in the U.S. is rarely the full 20-year statutory term. Drug development consumes 10 to 15 years of that term before first approval. The result: effective patent life — the period between launch and CoM expiration with no generic competition — typically runs 7 to 12 years. A drug approved in year 14 of its patent term has six years of CoM protection. The valuation implications are severe. Six years of monopoly pricing on a drug that cost $2.23B to develop (Deloitte’s 2024 figure for capitalized development costs per asset) is a structurally different investment thesis than 12 years.
Patent Term Extension under the Hatch-Waxman Act allows up to five additional years, and the European Supplementary Protection Certificate (SPC) provides equivalent relief in EU markets. Each restored year of exclusivity on a drug generating $2B annually is worth $2B in risk-adjusted revenue. PTE and SPC eligibility analysis is not optional in any credible valuation.
Secondary Patent Architecture: The Real IP Asset
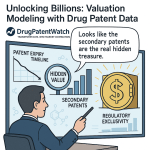
The valuation of a modern drug’s IP does not concentrate in the CoM patent. It distributes across a deliberately constructed portfolio of secondary patents, each filing extending effective exclusivity by blocking specific attack vectors a generic or biosimilar challenger could exploit.
Formulation patents protect specific drug product engineering — extended-release matrices, nanoparticle delivery systems, osmotic pump mechanisms. The commercial value here is not trivial. A reformulated extended-release version of a drug enables a ‘product hop’ — shifting prescribers and patients to the new formulation before the original CoM expires — so that when generics launch against the old form, the commercial market has already migrated.
Method-of-use patents cover specific therapeutic indications. Discovering a new indication for an approved drug generates a fresh 20-year patent from the new filing date. AstraZeneca used this structure with dapagliflozin (Farxiga): originally approved for type 2 diabetes, subsequent method-of-use patents covering heart failure and chronic kidney disease extended the commercial lifecycle significantly. Each indication has its own Orange Book listing and its own Paragraph IV challenge exposure.
Process patents protect novel manufacturing methods. For small molecules, these are weaker barriers because generic manufacturers routinely design around them. For biologics, they are considerably more powerful. The manufacturing process for a monoclonal antibody — cell line development, expression system parameters, protein folding protocols, purification train — is both patentable and frequently kept as a trade secret simultaneously, creating a layered barrier that goes beyond what any patent alone provides.
Polymorph and salt-form patents cover crystalline structures and ionic forms of the API that differ in solubility, stability, or bioavailability. AstraZeneca’s litigation over omeprazole and its magnesium salt form (Nexium) is the textbook case: the company shifted commercial promotion to the new form ahead of generic entry on the original, extracting billions in revenue at premium pricing from patients who received brand switching without any meaningful therapeutic difference.
Dosage regimen and combination patents protect specific dosing schedules or co-formulated combinations. Pfizer used combination patents extensively to extend the Lipitor portfolio, though the core CoM strategy ultimately could not withstand the generic assault in 2011.
IP Valuation as a Standalone Asset: Balance Sheet and Transaction Considerations
For M&A due diligence and licensing transactions, the IP portfolio is valued as a standalone asset separate from the enterprise valuation. Three methodologies apply: the income approach (rNPV of future cash flows attributable to the IP), the market approach (comparable licensing transactions), and the cost approach (cost to recreate the IP, rarely primary for pharmaceutical assets given the path-dependency of clinical data).
The income approach dominates for clinical-stage assets with revenue forecasts. The market approach anchors valuations when comparable deals exist — royalty rates for pharmaceutical licenses typically range from 2% to 15% of net sales, with oncology biologics at the high end and primary care small molecules closer to the floor. The cost approach applies primarily to academic spin-outs and early-stage platform technologies where revenue projections are speculative.
A critical input often ignored in secondary transaction valuations: the maintenance cost liability of a global patent portfolio. A drug with 50 active patents across 30 jurisdictions carries annual annuity costs in the range of $500,000 to $1.5M per year. For assets with modest commercial potential, this liability can push the net IP value into negative territory — a condition discussed in the FAQ section below.
The PCT Window as a Strategic Financing Tool
The Patent Cooperation Treaty filing strategy deserves more analytical attention than it typically receives in valuation discussions. A PCT application secures a priority date in 150+ member states from a single filing. The national phase deadline — when the expensive country-by-country prosecution costs hit — falls at 30 to 31 months from the priority date. Under the Paris Convention alone, that deadline is 12 months. The PCT window therefore provides an additional 18 to 19 months of capital preservation: a company can gather Phase II data, complete a financing round, or close a partnership before committing to the $2M to $5M cost of global prosecution.
For biotech companies with pre-clinical or Phase I assets, this PCT window is a genuine financial option. Valuation models that ignore the optionality of the PCT window understate the practical IP value of early-stage portfolios.
Key Takeaways: IP Architecture
The CoM patent is the foundation, not the full structure. Secondary patent portfolios — formulation, method-of-use, process, polymorph, and regimen claims — determine the effective commercial life and the barrier height facing challengers. For a blockbuster asset, the IP value is the aggregated NPV of all incremental exclusivity these secondary claims provide. Valuation models that read a single expiration date from the Orange Book and stop there will systematically understate portfolio value by years of protected revenue.
Investment Strategy Note
For portfolio managers evaluating biopharma equities: the gap between a drug’s CoM expiration date and its actual loss-of-exclusivity date — driven by secondary patent portfolio depth — is a quantifiable and frequently mispriced variable in sell-side revenue forecasts. Companies with dense secondary portfolios around assets approaching CoM expiration (2026-2032 cliff window) often have 3 to 7 years more protected revenue than consensus models assume. Screen for secondary patent filing density using Orange Book and USPTO data before accepting Street LOE estimates at face value.
Factor 2: Commercial Horizon — Addressable Market, Unmet Need, and Pricing Power
Building the Patient Funnel: From Prevalence to Paid Prescriptions
Market size analysis for drug patent valuation begins with epidemiology and ends with payer negotiation. The Total Addressable Market figure cited in most pitch decks is the prevalence number — all people with the disease. The number that determines actual revenue is smaller by a consistent sequence of filters.
Prevalence data provides the ceiling. Diagnosis rates apply the first filter: many diseases, particularly in psychiatry, neurology, and oncology, have substantial undiagnosed populations. Treatment rates apply the second filter: not every diagnosed patient receives pharmacological intervention. Formulary access and payer coverage apply the third: a drug can be approved and on the market but blocked from most patients by prior authorization requirements, step therapy protocols, or non-formulary status on major plans. The paid prescription volume — the bottom of the funnel — is what generates revenue.
A properly constructed TAM model works down this funnel with condition-specific data. Autoimmune diseases have high diagnosis rates in the U.S. relative to global averages, but treatment rates vary sharply by severity sub-segment. Oncology markets are smaller in raw prevalence but higher in treatment rates and dramatically higher in per-patient revenue, particularly in solid tumors with genomically defined patient subsets. CNS diseases — Alzheimer’s, Parkinson’s, schizophrenia — combine large prevalence numbers with low treatment rates and historically poor drug approval success, making their TAMs look larger than their revenue-generating populations.
Unmet Need as a Pricing Power Multiplier
Unmet medical need is the single most powerful pricing lever in pharmaceutical markets. The Institute for Clinical and Economic Review (ICER) threshold for cost-effectiveness in the U.S. sits around $100,000 to $150,000 per QALY, but payers have repeatedly accepted pricing well above this for genuinely first-in-class therapies in high-unmet conditions. Gene therapies for rare pediatric diseases — Zolgensma (onasemnogene abeparvovec-xioi) at $2.1M per treatment, Hemgenix (etranacogene dezaparvovec) at $3.5M — represent the outer edge of this pricing power.
Differentiation analysis requires a structured comparison against the current standard of care across multiple axes. A drug that extends median overall survival from 18 months to 26 months in a population with no approved second-line therapy commands fundamentally different pricing than one that achieves similar PFS gains in a market with four existing options. This comparison must be forward-looking: the standard of care at anticipated launch — which may be three to eight years away for clinical-stage assets — is what matters, not the current landscape.
First-in-class status correlates with pricing power, but the relationship is not automatic. Novel mechanisms that generate durable responses in difficult-to-treat patient populations extract premium pricing. Novel mechanisms in patient populations that are already well-served by inexpensive generic alternatives rarely command premium pricing regardless of the science. The question for valuation is: what is this drug’s clinical differentiation in the market that will exist at launch?
Peak Sales Forecasting: Why the Industry Gets It Wrong
A comprehensive analysis of 1,700 forecasts across 260 drugs found actual peak sales differed from projections made one year before launch by an average of 71%. Six years post-launch, forecasts were still 45% off. These are not rounding errors; they are structural biases in how commercial teams build models.
The primary source of error is market penetration optimism. Commercial forecasters routinely apply penetration rates from prior successful launches without adjusting for competitive intensity at the time of the forecast drug’s launch. A drug entering a market with two established branded competitors and a generic available for the second-line indication will not achieve the same penetration curve as the drug that created the category.
Deloitte’s 2024 analysis found that average forecast peak sales for late-stage pipeline assets at the top biopharma companies has reached $510M, driven by the concentration of those pipelines in obesity, diabetes (GLP-1 class), oncology, and rare disease — all high-value, large-market segments. The GLP-1 market alone is reshaping commercial forecasting conventions: Novo Nordisk’s semaglutide (Ozempic/Wegovy) generated over $10B in 2023 revenue, a figure that would have been considered unreachable for a single molecule five years ago.
Credible peak sales forecasts for valuation purposes require bottom-up patient funnel modeling, competitive penetration analysis, scenario-weighted pricing assumptions, and payer access modeling by market. Models that apply a top-down market share percentage to a prevalence number without building the patient funnel are not fit for investment-grade valuation work.
Key Takeaways: Commercial Horizon
Market size, unmet need, differentiation, and pricing power compound. A large market with no unmet need generates commodity pricing. A high-unmet condition with a small patient population generates orphan pricing. The maximum commercial value concentrates at the intersection of large addressable patient populations, meaningful differentiation from existing treatments, and payer willingness to pay premium prices. Forecast peak sales are systematically overstated; apply skeptical scenario analysis before accepting commercial projections in licensing or M&A contexts.
Factor 3: Clinical Development Stage, Data Quality, and FDA Regulatory Pathway
The rNPV Inflection Stack: Where Value Gets Created and Destroyed
A patent’s value in early development is a probability-weighted option on future cash flows. The option gets exercised — or expires worthless — at each clinical phase transition. The stage-specific probability-of-success rates determine the discount that must be applied to the commercial value calculated above.
Phase-specific success rates vary substantially by therapeutic area. Average figures across indications: Phase I to Phase II, 50 to 65%; Phase II to Phase III, 30 to 40%; Phase III to approval, 60 to 70%. The cumulative success rate from preclinical to approval sits between 1% and 5%. CNS drug development runs at the low end of these ranges — the cumulative success rate from Phase I to approval for CNS assets is approximately 8%, compared to roughly 18% for oncology and 28% for infectious disease.
These numbers matter for valuation precisely because they are not uniform. A Phase I CNS compound and a Phase I infectious disease compound with identical commercial opportunity have materially different rNPVs solely because of their therapeutic area success probability profiles. Using industry-average success rates across all indications introduces systematic error for assets in either CNS or infectious disease.
Value inflection points occur at three primary junctures. Phase II proof-of-concept data — particularly from randomized, biomarker-selected trials with a clear dose-response signal — is the first major de-risking event. Positive Phase III pivotal data is the second, and typically the largest single value step. Regulatory approval in the U.S. (FDA) or Europe (EMA) is the third, eliminating the terminal regulatory risk.
Acquirers and licensing partners consistently pay the most per unit of probability when they enter after Phase II proof-of-concept but before Phase III initiation — they capture most of the clinical value creation while paying for remaining Phase III and regulatory risk. This is where most large-platform licensing deals and mid-size acquisitions occur.
Endpoint Selection: Hard Outcomes vs. Surrogate Measures
The nature of the clinical endpoints used to support regulatory approval has direct implications for patent valuation because it determines the strength of the commercial franchise.
Overall Survival (OS) data is the hardest endpoint in oncology and the most difficult to attack in payer negotiations, HTA reviews, or post-approval scrutiny. A drug approved on OS data with a hazard ratio below 0.70 has a durable commercial position that is difficult for competing therapies to displace without their own OS data.
Surrogate endpoints — Progression-Free Survival, Objective Response Rate, Event-Free Survival — accelerate approval timelines but create downstream commercial risk. Payers in markets with formal HTA processes (NICE in the UK, G-BA in Germany, HAS in France) routinely restrict reimbursement or demand price concessions for drugs approved on surrogate endpoints without confirmatory OS data. The FDA’s Accelerated Approval pathway has recently come under increased scrutiny; the Omnibus bill of 2022 gave the FDA authority to require post-market confirmatory trials on a faster timeline, and the agency has moved to withdraw approvals where confirmatory data failed (the aducanumab/Aduhelm situation being the most high-profile example, though the mechanism was different).
For valuation purposes, a drug approved on a surrogate endpoint should carry a risk discount reflecting potential HTA restrictions in ex-U.S. markets and the probability that confirmatory trial data either fails to materialize or generates a negative result that undermines the commercial franchise.
FDA Designations as Quantifiable Value Events
Breakthrough Therapy Designation (BTD) produces measurable value through two mechanisms: timeline compression and FDA engagement intensity. NBER analysis found BTD shortens clinical development time by an average of 23% versus non-designated development programs, without detectable adverse impact on post-approval safety profiles. That 23% compression saves direct Phase III costs exceeding $5M per asset, and brings revenue forward by one to three years — a value creation event that runs into the hundreds of millions for blockbuster-caliber drugs.
Orphan Drug Designation (ODD) generates seven years of market exclusivity post-approval in the U.S., separate from and additive to patent protection. For assets where the CoM patent expires before or shortly after launch, this seven-year orphan exclusivity can be the primary exclusivity protection. A retrospective study found that publicly listed companies with orphan drug portfolios had 9.6% higher return on assets and 15.7% higher market-to-book values than non-orphan comparators — a measurable equity premium that flows directly from the ODD’s exclusivity and financial incentive package.
Fast Track designation provides more frequent FDA communication and rolling review eligibility. It is the least transformative of the expedited designations for valuation purposes. Accelerated Approval allows early market entry on a surrogate endpoint but requires confirmatory trial commitment, creating the downstream risk noted above.
Priority Review shortens the standard 12-month review period to 6 months. Combined with BTD and rolling review, this can compress the total regulatory phase by 18 months or more, a material value driver for any asset projecting large annual revenues.
Key Takeaways: Clinical Pathway
Clinical stage, therapeutic area success probabilities, endpoint choice, and FDA designation status are the four variables that move rNPV the most between preclinical filing and approval. A Phase II oncology asset with BTD and a clean OS dataset in a well-defined biomarker-selected population represents a categorically different risk/reward profile than a Phase II CNS asset relying on a composite endpoint in a heterogeneous patient population. Both may have identical paper patent portfolios. Only one has a viable path to a $1B+ revenue ceiling.
Investment Strategy Note
The clearest value creation trade in clinical-stage biopharma M&A: acquiring an asset immediately after positive Phase II data, before the company files for BTD or initiates Phase III. The BTD filing is a public, searchable event on the FDA’s designation database. Phase III initiation is reported in ClinicalTrials.gov. Tracking both with patent expiration data creates a data-driven signal for when assets transition from early-stage risk to de-risked mid-stage positions — the zone where per-unit probability adjusted value is highest.
Factor 4: Competitive Landscape and the Mechanics of Exclusivity Erosion
Mapping the Battlefield: Existing Treatments and Pipeline Threats
Competitive analysis for patent valuation is forward-looking. The current standard of care is a baseline; the competitive environment at the asset’s anticipated launch date is the operative frame.
Pipeline analysis requires systematic tracking of competitor programs across stage of development, mechanism of action, and target patient population. An asset entering Phase III today will launch in three to five years. In that window, competitors filing Phase II now will be in Phase III. What is the landscape likely to look like? How many approved therapies will exist? What will their pricing look like? Will any of them have gone generic?
The ‘ease of designing around’ the patent is a distinct but related analytical factor. Patents with narrow, highly specific claims — protecting a single molecule’s specific salt form or a highly particular release matrix — are easier for competitors to circumvent with structurally distinct but therapeutically similar molecules. The CGRP receptor antagonist class for migraine provides a recent example: four approved products (erenumab/Aimovig by Amgen/Novartis; fremanezumab/Ajovy by Teva; galcanezumab/Emgality by Eli Lilly; eptinezumab/Vyepti by Lundbeck/Alder) each protected by distinct CoM patents, each capturing market share in the same indication. The competitive dynamic in a multi-drug class is categorically different from a true monopoly, and revenue forecasts must reflect it.
The Patent Cliff: Scale, Timing, and Revenue Impact
The patent cliff is not a single event; it is the end state of a multi-year process of competitive pressure accumulation. The financial scale of the 2023-2030 cliff is the largest in pharmaceutical history: $200B to $300B in annual branded revenues facing generic competition. Bristol-Myers Squibb faces loss of exclusivity on Eliquis (apixaban) around 2026-2028, a drug generating over $11B annually. Merck faces LOE on Keytruda (pembrolizumab) starting around 2028-2032, with annual revenues exceeding $25B. Johnson & Johnson faces biosimilar competition for Stelara (ustekinumab), which began entering in 2023.
The revenue decay pattern after generic entry differs sharply by drug class. Small molecules lose 80-90% of branded revenue in the first 12 months post-generic launch — the standard Hatch-Waxman dynamic of automatic pharmacy substitution in most U.S. states. Branded revenue does not ‘fall off’; it collapses. Biologics lose revenue more slowly due to the higher regulatory bar for biosimilar interchangeability, the absence of automatic substitution at the pharmacy level for non-interchangeable biosimilars, and the ability of innovators to deploy pricing and contracting strategies that slow uptake.
Lifecycle Management Case Study: AbbVie’s Humira (adalimumab)
Humira’s IP strategy deserves detailed attention because it set the standard for biologic defense and continues to shape how companies structure patent portfolios around major biologics.
The core CoM patent on adalimumab expired in the U.S. in 2016. At that point, AbbVie’s patent portfolio for Humira numbered approximately 136 patents in the U.S. alone, with roughly 90% filed after the drug’s initial 2002 approval. This portfolio covered formulations, manufacturing processes, methods of use across the drug’s 10+ approved indications, and dosing regimens. The economic logic was straightforward: each individual secondary patent might not be iron-clad, but the collective litigation burden of challenging dozens of them made at-risk biosimilar launch financially irrational.
AbbVie used this portfolio as a settlement instrument rather than a trial weapon. Every potential U.S. biosimilar entrant — Amgen (Amjevita), Samsung Bioepis (Hadlima), Pfizer (Abrilada), Sandoz (Hyrimoz), and others — received licenses with staggered U.S. launch dates beginning January 2023. The settlements effectively auctioned off entry slots in a controlled market opening seven years after the CoM expiration.
The product hop to a high-concentration, citrate-free formulation (40mg/0.4mL, replacing the original 40mg/0.8mL) was executed before biosimilar launch. Citrate causes injection site pain; the citrate-free formula was a genuine patient preference improvement. By 2023, prescribers and patients had migrated to the newer formulation. Most biosimilars referenced the original formulation and were therefore not interchangeable at the pharmacy level with the market-leading product. One year after U.S. biosimilar entry, AbbVie’s branded Humira retained over 96% of its market share. Sales declined roughly 31% in 2023 — painful, but nothing like the 80-90% collapse seen with small molecules.
The Humira case established that a well-constructed biologic patent thicket, combined with a timely product hop, can convert a patent cliff into a managed revenue step-down over three to five years rather than a collapse in 12 months.
Lifecycle Management Case Study: Pfizer’s Lipitor (atorvastatin)
Atorvastatin’s LOE in 2011 is the canonical small-molecule cliff case. Pfizer’s peak Lipitor revenue exceeded $13B annually. The Ranbaxy settlement (part of the broader Paragraph IV resolution) allowed generic entry beginning November 30, 2011. Watson Pharmaceuticals launched immediately as a second authorized generic. Within one year, branded Lipitor held less than 5% of the atorvastatin market.
Pfizer’s defensive strategies included the ‘Lipitor for You’ co-pay program, which made the branded drug’s co-pay competitive with or lower than generic co-pays for commercially insured patients during the initial 180-day period. Pfizer also licensed an authorized generic through Watson, capturing some generic revenue rather than ceding it entirely.
None of it materially altered the trajectory. The lesson from Lipitor is that no lifecycle management tactic can prevent the small-molecule cliff once a Paragraph IV challenge succeeds and generics launch. Strategy can soften the landing, compress the timeline of the transition period, and capture some generic revenue — it cannot prevent 80-90% branded revenue loss.
Key Takeaways: Competitive Landscape
The post-LOE revenue trajectory is the primary variable that distinguishes biologic from small-molecule patent valuations. Biologic patents have structurally more valuable tails than small-molecule patents of equivalent size, driven by the interchangeability hurdle, the absence of automatic pharmacy substitution for non-interchangeable biosimilars, and the patent thicket’s capacity to control entry timing. Any valuation model that applies identical LOE erosion curves to a biologic and a small molecule will materially undervalue the biologic.
The risk-adjusted Net Present Value model is the pharmaceutical industry standard for valuing clinical-stage assets because it explicitly handles the binary risk of development failure that a standard DCF ignores. The mechanics are straightforward: projected revenues and costs at each future period are multiplied by the cumulative probability of reaching that period, then discounted to present value.
Required model inputs: annual revenue projections across the commercial life of the asset; annual cost projections covering remaining R&D, manufacturing (COGS), and commercialization (SG&A); phase-specific probability of success for each remaining development stage; a discount rate; and a terminal value assumption for revenues beyond the primary patent-protected period.
The probability of success inputs are the most consequential for early-stage assets. The therapeutic area specificity matters more than most modelers acknowledge. Phase II-to-Phase III success rates for oncology (40.8%), CNS (27.9%), and infectious disease (52.8%) differ enough that applying an average rate produces material valuation errors. Sourcing these from recent, large-sample studies (not 15-year-old datasets) is standard practice for investment-grade work.
R&D Cost Capitalization and the True Cost of Failure
Deloitte’s 2024 analysis set the average capitalized cost per approved asset at $2.23B, up from $2.17B in 2023. The capitalized figure is not the out-of-pocket cost for a single drug; it accounts for two economic realities that out-of-pocket figures obscure.
The cost of failure: every dollar spent on a Phase II compound that fails must be financially borne by the compounds that succeed. If nine out of ten Phase II compounds fail before producing a marketed drug, the cost of the one successful drug must implicitly carry the nine failures. The cost-of-failure load is the primary driver of the gap between out-of-pocket costs ($500M to $900M per approved drug in some estimates) and capitalized costs ($2B+).
The time value of money: capital committed to a 15-year development program earns no return during that period. The opportunity cost of that capital, compounded over the development timeline, accounts for a significant portion of the capitalized cost — some analyses attribute nearly half of the total capitalized figure to opportunity cost alone.
For rNPV modeling purposes, the remaining R&D cost projection — what it will cost to complete development from the current stage to approval — is what enters the model, not the sunk-cost history. Remaining Phase III costs for a large-indication oncology trial typically run $200M to $800M depending on trial size, endpoint, and geography. These figures significantly impact rNPV for mid-stage assets.
Discount Rate Selection: The Difference Between 10% and 40%
The discount rate is the single most contested input in pharmaceutical rNPV modeling, and the source of the most significant variance between models built by different analysts on the same asset.
In a standard NPV model (without explicit probability-of-success adjustment), the discount rate must carry all risk — including the risk of development failure. This produces very high, stage-specific rates: surveys of biotech practitioners using standard NPV have found average discount rates of 40.1% for early-stage projects, 26.7% for mid-stage, and 19.5% for late-stage. These rates render early-stage asset valuations negligible, which is mathematically consistent but practically useless for deal-making.
In an rNPV model, the development failure risk has already been captured by the probability-of-success adjustment. The discount rate needs to account only for systematic market risk and the time value of money. Large biopharmaceutical companies using rNPV typically apply rates between 10% and 13%, anchored to WACC. A survey of major biotech companies found a median rNPV discount rate of 10%.
The practical implication: two analysts modeling the same Phase II oncology asset, one using a 10% discount rate in an rNPV model and one using 35% in a standard NPV model, may produce valuations that differ by a factor of three or more for the same asset and the same revenue forecast. Confirming which methodology a counterparty is using is essential before interpreting any third-party valuation.
Key Takeaways: Financial Modeling
The rNPV model is the correct tool for clinical-stage pharmaceutical assets. Its accuracy is determined by four inputs that require domain expertise to estimate well: therapeutic area success rates, commercial revenue projections, remaining R&D cost projections, and discount rate selection consistent with the model type. Using industry averages as plug-ins for any of these produces results that are numerically precise and analytically unreliable.
Investment Strategy Note
For licensing deal pricing: the rNPV model should be built independently by both parties, with explicit disclosure of the methodology and key assumptions. Deals that fall apart in negotiation most commonly do so because the buyer is running a 10% rNPV model and the seller is running a 35% standard NPV — producing estimates of ‘fair value’ that differ by 3x on the same asset. Aligning on methodology before exchanging numbers saves deal time.
Factor 6: Paragraph IV Litigation Risk, Enforceability, and the Cost of Defense
The Hatch-Waxman Framework and Why Litigation is a Certainty
The Drug Price Competition and Patent Term Restoration Act of 1984 — Hatch-Waxman — created the ANDA pathway for generic approval and formalized the Paragraph IV certification mechanism for patent challenges. A Paragraph IV filing is the generic company’s declaration that the innovator’s Orange Book patents are either invalid, unenforceable, or will not be infringed by the generic. It is a legal act of commercial warfare that almost always triggers an infringement suit.
When an innovator files suit within 45 days of receiving Paragraph IV notice, a 30-month stay on FDA final approval of the ANDA automatically activates. This stay is the primary defensive value of the Hatch-Waxman litigation structure. It provides 30 months of protected revenue without requiring the innovator to win on the merits — the generic cannot launch at risk during the stay period without facing the full damages exposure of an infringement verdict.
The first generic filer under Paragraph IV who wins or settles receives 180 days of market exclusivity against subsequent generic filers, creating a significant first-mover financial incentive that drives the initial challenge.
Market Value as the Primary Predictor of Patent Challenge
A 2024 cross-sectional study published in PLOS Medicine analyzing 210 new small-molecule drugs found that market value was the dominant predictor of Paragraph IV challenge. Drugs in the bottom deciles of market value faced challenge roughly 24% of the time. Drugs with annual sales between $484M and $1B faced challenge in approximately 90% of cases. For drugs above $1B in annual sales, challenge is essentially certain.
This finding reframes the analytical treatment of litigation in pharmaceutical patent valuation. It is not a risk to be assigned a probability and discounted; it is a near-certain future expense for any commercially successful drug. The valuation question is not whether litigation will occur, but when it will occur, how long it will take, what the probable outcome is, and what the cost will be — all of which can be estimated from litigation history and the patent portfolio structure.
The American Intellectual Property Law Association estimates median total litigation costs (through trial and appeal) for high-stakes pharmaceutical patent cases at $5.5M. Cases where more than $25M is at risk — the standard for any commercially significant drug — run at the high end. These costs are a predictable liability to be included in the financial model, not a contingent loss to be footnoted.
Settlement Dynamics and the ‘Pay-for-Delay’ Question
Many Paragraph IV disputes resolve through settlement agreements in which the innovator pays (or provides something of value to) the generic company in exchange for a delayed launch date. The FTC calls these ‘reverse payment’ settlements; the industry calls them ‘authorized generic’ or ‘settlement’ agreements. The Supreme Court’s 2013 FTC v. Actavis decision established that these agreements can be challenged under antitrust law, though the standard is rule-of-reason rather than per se illegality.
For valuation purposes, settlement economics are analyzable. The generic company will accept a settlement only if the present value of the licensed, delayed entry date exceeds the probability-weighted value of winning outright in litigation. The innovator will offer a settlement only if the cost of the settlement plus the delayed generic revenue is less than the value of the additional exclusivity purchased. When both conditions hold simultaneously, settlement occurs. The resulting agreed-upon entry dates represent the market’s clearing price for extended exclusivity, and they are observable in FDA ANDA approval databases and court filings.
Enforceability and Infringement Detection
Patent enforceability is a practical dimension of value that legal strength analysis alone does not capture. A process patent on a manufacturing step that occurs inside a competitor’s facility is technically enforceable but practically difficult to assert without discovery — which requires litigation, which requires triggering the cost and time of a lawsuit before any evidence can be obtained. The incentive to challenge an undetectable infringement is low.
Composition of matter patents are the most practical to enforce: the competitor’s product can be obtained from the market and analyzed. Method-of-use patents are more complex to enforce because the infringer is often the physician, not the manufacturer, and inducing infringement by the manufacturer requires proving the manufacturer actively encouraged the infringing use. Diagnostic and biomarker patents face the divided infringement problem (discussed in the FAQ) where no single party performs all claimed steps.
The ratio of practically enforceable claims to total claims in a patent portfolio is a dimension that due diligence processes frequently skip. A portfolio of 100 patents, 80 of which cover manufacturing processes that cannot be detected from the market, is less practically valuable than a portfolio of 40 patents covering formulations and methods of use that can be observed in the marketed product.
Key Takeaways: Litigation Landscape
For any drug with annual sales above $500M, Paragraph IV challenge should be treated as a budgeted certainty in the financial model, not a risk scenario. The value of the patent is its litigation-adjusted revenue potential: the probability-weighted outcome of winning, losing, or settling, multiplied by the revenue implications of each outcome, discounted at the appropriate WACC-based rate.
Factor 7: Biologic vs. Small-Molecule Structural Differences in IP Valuation
Two Different Asset Classes Requiring Two Different Models
A systematic comparison of biologic and small-molecule drug development and IP economics — drawing on a 2024 analysis by Beall et al. published through LSE Research Online — reveals structural differences large enough to require separate valuation frameworks.
Patent density: biologics carry a median of 14 Orange Book-listed patents per product. Small molecules carry a median of 3. This density difference directly reflects the greater patentability of manufacturing processes and formulations for biologics, and the strategic imperative to construct a patent thicket around high-cost biologic programs.
Statutory exclusivity: the Biologics Price Competition and Innovation Act (BPCIA) of 2009 provides biologics with 12 years of reference product exclusivity from the date of first approval, in addition to patent protection. Small-molecule new chemical entities receive 5 years of New Chemical Entity (NCE) exclusivity under Hatch-Waxman. This 7-year gap in baseline statutory exclusivity is, by itself, worth multiple billions in NPV for any major biologic.
Post-LOE revenue erosion: biosimilar entry in the U.S. has consistently produced slower revenue erosion than generic entry for small molecules. Without FDA interchangeability designation — a designation that requires additional switching studies beyond the standard biosimilar approval — biosimilars cannot be automatically substituted at the pharmacy level. The physician must specifically prescribe the biosimilar. This creates a structural barrier that generic manufacturers of small molecules do not face, and it allows innovators to use rebate and contract strategies to protect managed care formulary position.
Development economics: median development costs for biologics run approximately $3.0B per approved asset (Beall et al. 2024 estimate) versus $2.1B for small molecules — roughly a 43% premium. The higher cost requirement sets a higher commercial threshold for biologic investments to be value-creating.
Commercial ceiling: biologics achieve higher median peak revenues ($1.1B) and substantially higher annual treatment costs (median $92,000/year) than small molecules ($500M median peak revenue; $33,000/year median treatment cost). The premium pricing is partly cost-based, partly structural — biologics’ longer effective exclusivity periods support sustained premium pricing that generic entry on small molecules eliminates.
Biosimilar Interchangeability: The Regulatory Threshold That Determines Revenue Tail Value
The FDA interchangeability designation is the most commercially consequential regulatory outcome for a biologic’s long-term IP strategy. An interchangeable biosimilar can be substituted by a pharmacist without a new prescription in most states, replicating the automatic substitution dynamic that drives rapid brand erosion for small molecules. A non-interchangeable biosimilar requires active physician prescribing.
As of 2025, only a handful of biologics have interchangeable biosimilars approved — Semglee (insulin glargine) and Cyltezo (adalimumab) among them. The interchangeability standard requires additional clinical data demonstrating that switching between the reference product and the biosimilar does not produce safety or efficacy risks beyond those observed with the reference product alone. Most biosimilar manufacturers have not pursued this designation for the high-value immunology biologics currently losing exclusivity because the additional study cost, combined with market uncertainty, has not justified the investment.
For patent valuation: a biologic patent portfolio that effectively delays interchangeability designation — through litigation, licensing agreements with entry date conditions, or product hopping to a formulation the biosimilar doesn’t reference — materially extends the revenue tail beyond what the patent expiration dates alone would suggest.
Key Takeaways: Biologic vs. Small Molecule
Biologic patents require a separate analytical framework from small-molecule patents. The 12-year statutory exclusivity period, 14-patent median portfolio density, slower post-LOE erosion curve, higher development cost base, and higher commercial ceiling all change the fundamental valuation structure. A model that applies small-molecule LOE erosion assumptions to a biologic asset will systematically undervalue the tail revenue by three to seven years.
Factor 8: Legal Precedent, Technology Disruption, and Precision Medicine IP
Amgen v. Sanofi (2023): The Enablement Standard Reshapes Biologic Patent Scope
The Supreme Court’s May 2023 unanimous decision in Amgen Inc. v. Sanofi, 598 U.S. 594, redrawn the outer boundary of what a biologic patent can claim. The practical implications for portfolio valuation are substantial.
The dispute centered on Amgen’s PCSK9-targeting antibody patents supporting evolocumab (Repatha). Amgen’s claims were functional — the patents covered any antibody that could bind the PCSK9 protein at specific sites and block it from interacting with LDL receptors, regardless of the specific amino acid sequence. Amgen disclosed the sequences of 26 specific antibodies and then claimed a monopoly over the potentially millions of antibodies that could perform the same function. Sanofi (and Regeneron, whose alirocumab/Praluent was the competitive product) challenged the claims as non-enabled.
Justice Gorsuch’s opinion articulated the governing standard with unusual clarity: ‘The more one claims, the more one must enable.’ Amgen’s specification described 26 antibodies. Its claims covered an effectively unlimited class. The Court held that to enable someone skilled in the art to make and use the entire claimed genus without undue experimentation, a patentee must do more than point to an underlying functional principle and invite competitors to discover the rest. The claims were invalid for lack of enablement.
The decision’s effect on portfolio valuation: broad, functionally defined genus claims — the type that had been standard practice for antibody patents in the biologics era — are now presumptively vulnerable to enablement challenges. Any patent that claims a genus of biologics by function rather than by specific sequence or structure must be analyzed with its post-Amgen invalidity risk explicitly priced in.
This has two responses in practice. First, companies are narrowing their primary claims to specifically exemplified molecules, accepting narrower protection in exchange for stronger enforceability. Second, they are compensating for narrower claims by increasing portfolio density — filing more patents, each covering a specific molecule, formulation, or use, rather than relying on a single genus claim to cover the field. The net effect is higher prosecution costs per asset and greater portfolio complexity for the same commercial coverage.
For due diligence on any biologic patent portfolio that includes broad genus claims filed before or shortly after the Amgen decision, enablement vulnerability analysis is now standard. The discount applied to potentially invalid genus claims must reflect the post-Amgen environment, not the pre-2023 prosecution landscape.
Precision Medicine and Companion Diagnostic IP: Roche’s Herceptin/HercepTest as the Foundational Model
The co-development of Herceptin (trastuzumab) and the HercepTest companion diagnostic by Genentech and DAKO (now Agilent) in 1998 established the commercial and IP architecture for targeted oncology.
HER2 gene amplification or protein overexpression occurs in approximately 20-30% of breast cancers. The HER2-positive subgroup has a more aggressive disease course but responds specifically to HER2-directed therapy. Trastuzumab was developed to target the extracellular domain of the HER2 protein. Without the HercepTest (and subsequent FISH-based companion diagnostics), identifying the treatable subpopulation was impractical at scale. The CDx was the commercial gateway to the drug’s market.
The IP implications run in both directions. Roche’s patent estate on trastuzumab is more valuable because the CDx creates a gated market that competitors cannot serve without either developing their own compliant CDx (an additional capital commitment) or licensing the existing diagnostic platform. The CDx patent estate has independent commercial value as a diagnostic product. The combination — drug patent plus companion diagnostic exclusivity — creates a more durable commercial position than either alone.
The Mayo v. Prometheus and AMP v. Myriad decisions have complicated patenting in the CDx space. Mayo (2012) held that a patent claiming the relationship between a thiopurine drug dosage and metabolite levels — essentially a diagnostic correlation — was claiming a law of nature and was therefore patent-ineligible. AMP v. Myriad (2013) held that isolated naturally occurring DNA sequences were not patentable. These decisions pushed CDx IP strategy toward the tangible applications: the diagnostic kit itself, the synthetic probes and reagents, and the specific assay methodology — rather than the underlying biological relationship.
For precision medicine asset valuations, the CDx component requires separate analysis: who owns the CDx IP, what is the access cost for prescribers, how is the CDx reimbursed, and what happens to the drug’s commercial market if the CDx patent or exclusivity lapses before the drug’s exclusivity does?
GLP-1 Class as a Current Valuation Case Study
The GLP-1 receptor agonist class — semaglutide (Novo Nordisk), tirzepatide (Eli Lilly), retatrutide (Eli Lilly, GIP/GLP-1/glucagon triagonist) — represents the highest-stakes current example of all eight valuation factors interacting simultaneously.
Semaglutide’s core CoM patents begin expiring in the late 2020s for the diabetes indication. Novo Nordisk has built a secondary portfolio covering the specific formulation characteristics of Ozempic (once-weekly subcutaneous injection) and Wegovy (higher dose for obesity), the device delivery systems, and the oral formulation (Rybelsus). The obesity indication (Wegovy approval 2021) generates a separate method-of-use patent filing with a later expiration date. The commercial market is enormous — estimates for peak global GLP-1 revenues exceed $100B annually by 2030. The litigation outlook is already active: generic manufacturers have filed ANDAs and initiated Paragraph IV challenges against semaglutide’s listed patents.
Eli Lilly’s tirzepatide (Mounjaro for diabetes, Zepbound for obesity) is structurally distinct from semaglutide — dual GIP/GLP-1 agonism versus single GLP-1 agonism — and protected by separate CoM patents. The competitive dynamics within the class illustrate the TAM/differentiation tradeoff: tirzepatide shows modestly superior weight loss efficacy versus semaglutide in head-to-head data, which supports premium pricing claims but does not eliminate semaglutide’s market position.
The GLP-1 class also illustrates the forecasting problem: consensus estimates for peak sales have been revised upward repeatedly and dramatically, with each revision representing a valuation step-change for the underlying IP portfolios.
Key Takeaways: Technology and Legal Landscape
The post-Amgen enablement standard, the precision medicine CDx co-patent structure, and the technology-specific dynamics of new drug classes (GLP-1, ADCs, cell therapy) all require the valuation framework to be actively maintained rather than applied from a static template. Legal precedents that narrow patent scope reduce the value of broad genus claims while simultaneously increasing the value of dense, specific secondary portfolios. Technology disruptions create new IP architectures — CDx coupling, platform-dependent assets, manufacturing-dependent exclusivity — that require bespoke analysis rather than analogical reasoning from prior drug classes.
Synthesis: Applying the Eight-Factor Framework
Building the Integrated Model
No single factor operates in isolation. The integrated valuation combines all eight into a single probability-weighted, discounted cash flow structure:
The IP architecture (Factor 1) defines the effective commercial life — not the nominal patent term, but the realistic period of protected revenues after accounting for secondary portfolio coverage, PTE/SPC eligibility, and the settlement-controlled generic entry calendar from Paragraph IV litigation (Factor 6).
The commercial horizon analysis (Factor 2) defines peak revenues and the shape of the revenue curve from launch to LOE. Clinical stage and regulatory pathway (Factor 3) determine the probability that the revenue curve is ever realized. The competitive landscape (Factor 4) determines how much of that revenue is retained against competitive pressure during the exclusivity period.
The financial model (Factor 5) translates these into rNPV using therapeutic area-specific success probabilities, validated cost projections, and a WACC-calibrated discount rate. The biologic vs. small molecule distinction (Factor 7) determines the LOE erosion curve applied to post-exclusivity revenues. Legal and technology factors (Factor 8) apply forward-looking discounts to claims vulnerable to Amgen enablement challenges or CDx IP complications.
The output is not a single number but a distribution of values across scenarios — base case, bear case, and bull case — reflecting the genuine uncertainty in drug development. A Phase II oncology asset with a $3B peak sales forecast and a 40% probability of Phase III success does not have a value of $1.2B (the simple product). It has a distribution of values: zero with 60% probability, and a range of outcomes conditional on Phase III success that reflects pricing, competition, LOE erosion, and litigation outcomes. The rNPV model’s job is to render that distribution into a defensible expected value for deal-making purposes.
Key Takeaways: Full Framework
A drug patent’s value is the sum of legally defensible exclusivity, multiplied by commercially addressable revenue, discounted by development risk, adjusted for competitive erosion, litigation costs, and post-LOE revenue trajectory. Each factor is quantifiable with the right data. The analysts and IP teams who get this right — using therapeutic area-specific probabilities, realistic commercial models, rigorous competitive analysis, and post-Amgen-adjusted IP assessments — will consistently price assets more accurately in licensing negotiations, acquisitions, and portfolio management decisions than those who rely on simplified models and industry averages.
Frequently Asked Questions
What does a negative-value drug patent look like in practice?
A patent can represent a net liability when its associated costs exceed its probability-weighted future income. Global patent maintenance fees (annuities) across 30+ jurisdictions can run $500,000 to $1.5M per year for a mature portfolio. For a patent protecting a drug in a small, declining market, or one facing a near-certain invalidation challenge, the rNPV of future revenues may fall below the capitalized cost of maintaining the portfolio. Companies routinely abandon patents in low-priority markets for exactly this reason. The strategic question is whether abandonment forecloses any future value — licensing, cross-licensing, or defensive use — that justifies the maintenance cost.
How does divided infringement affect companion diagnostic patent enforcement?
Divided infringement occurs when separate parties each perform different steps of a patented method, and no single party performs all of them. In a CDx context: the laboratory performs the genetic analysis, the physician orders the test and interprets the result, and the drug manufacturer’s label recommends testing. Under U.S. law, direct infringement requires a single entity to perform all claimed steps. Inducement liability can reach the manufacturer if they actively instruct the infringing use (typically through the prescribing label), but collecting damages against dozens of individual physicians is practically impossible. CDx patent strategies must be structured around the tangible kit, the specific assay reagents, or the proprietary analytical software — not around the diagnostic correlation itself — to maintain practical enforceability.
How are trade secrets and patent protection typically combined for biologic manufacturing?
The manufacturing process for a monoclonal antibody — cell line development, fermentation parameters, protein folding conditions, downstream purification train — is simultaneously patentable and protectable as trade secret. The typical strategy patents the broad manufacturing concept (cell culture methods, general purification approaches) while keeping the operationally specific parameters as trade secrets. A biosimilar manufacturer must independently develop a compliant manufacturing process; they cannot access the innovator’s confidential CMC data. This creates a functional barrier that persists even after the manufacturing process patents expire. The trade secret component of biologic IP is not captured in any patent database and is therefore systematically undervalued in quantitative patent portfolio analyses.
How should Paragraph IV litigation history affect a prospective patent valuation?
Prior litigation outcomes on closely related patents — same compound, same company, same patent family — are the most predictive data available for estimating the litigation risk of a current portfolio. If a company has defended its patent thicket successfully in prior Paragraph IV challenges, that history suggests both portfolio quality and litigation competence. If prior challenges resulted in invalidations or unfavorable settlements allowing early generic entry, those outcomes should increase the litigation risk discount applied to current valuations. Claim construction decisions and invalidity findings in prior cases also create estoppel and collateral estoppel issues that can directly affect the defensibility of related claims in current patents.
What is the practical impact of the IRA’s drug pricing provisions on patent valuation models?
The Inflation Reduction Act’s Medicare drug price negotiation provisions — which began with the first 10 drugs selected for negotiation in 2023 and expand annually — directly reduce the revenue ceiling for affected drugs. The IRA’s structure gives CMS the authority to negotiate prices for drugs that have been approved for 7+ years (small molecules) or 11+ years (biologics) without generic or biosimilar competition. This effectively compresses the high-revenue tail that patent thickets and settlement-controlled entry dates were designed to protect. For any asset whose projected revenue period extends past these thresholds, the IRA pricing reduction should be modeled as a discrete step-down in the revenue forecast, not simply absorbed into a general pricing risk discount. The practical effect: the value of late-stage patent exclusivity (years 8-12 for small molecules, years 12-15 for biologics) has decreased relative to pre-IRA models.
This analysis synthesizes data from peer-reviewed literature, FDA regulatory databases, ANDA litigation filings, and published industry analyses. Specific drug and litigation data referenced throughout reflects publicly available information. Nothing in this document constitutes legal or financial advice.