The generic pharmaceutical industry generated $445 billion in U.S. system savings in 2023 alone, according to the Association for Accessible Medicines (AAM)/IQVIA Institute analysis. The European figure, while calculated on a different basis, exceeded EUR 100 billion annually as far back as 2014. Those numbers have grown since.
What is obscured by those headline figures is the structural paradox at the center of both markets. The United States pays more for prescription drugs than any OECD country, by a factor of 2.78 on a weighted average basis per a 2022 HHS/ASPE analysis, yet its unbranded generic prices are 33% cheaper than the OECD median. Europe has lower brand prices through government-negotiated ceilings, yet a structurally lower rate of generic uptake, and a supply chain that is now visibly fracturing under the weight of its own cost-containment success.
Neither system has solved the core problem. The U.S. offsets stratospheric brand costs with hyper-competitive generic markets and ~90% generic prescription volume. Europe imposes moderate prices on everything but has built a procurement architecture that is pushing generic manufacturers out of the market and creating drug shortages across the continent.
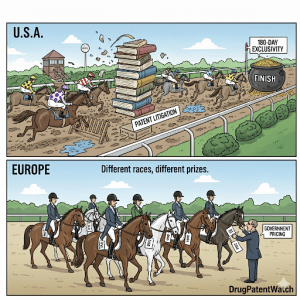
For pharma IP teams, the divergence runs even deeper. In the United States, patent strategy is commercial strategy. A Paragraph IV (PIV) certification filing, a 30-month stay, and 180-day marketing exclusivity are not legal technicalities; they are the primary financial architecture of a generic launch. In Europe, the legal framework is less litigious, but pricing and reimbursement (P&R) decisions at 27 separate national levels create a different kind of complexity, one that requires country-specific health technology assessment (HTA) dossiers, tender logistics, and a thorough understanding of each government’s willingness to pay.
This pillar page dissects both systems in detail sufficient for IP strategy, portfolio R&D decisions, and institutional investment analysis. The goal is not to declare a winner between the two models. The goal is to give practitioners the technical depth to build strategy in either market, or both simultaneously.
The Regulatory Bedrock: Hatch-Waxman vs. the EU Multi-Track System
The Hatch-Waxman Act: Anatomy of the American Generic System
The Drug Price Competition and Patent Term Restoration Act of 1984, known as Hatch-Waxman after its Senate and House sponsors, is the structural foundation of the U.S. generic market. Its core bargain: abbreviated regulatory review for generic drugs, in exchange for a formal process that gives brand manufacturers advance notice of patent challenges and the right to litigate before generics reach market.
That bargain has held for four decades. Generic prescriptions went from under 20% of U.S. dispensed volume in 1984 to approximately 91% today. The legislation successfully created the world’s most competitive off-patent small-molecule market. It also created the world’s most litigious pharmaceutical patent system.
The ANDA Pathway and the Bioequivalence Standard
The Abbreviated New Drug Application (ANDA) is the regulatory instrument that makes generic competition possible without duplicating clinical trials. An ANDA applicant must demonstrate that its product is bioequivalent to the Reference Listed Drug (RLD). Bioequivalence is defined in pharmacokinetic terms: the 90% confidence interval for the ratio of key pharmacokinetic parameters (typically AUC and Cmax) between the test and reference products must fall within 80-125%. The generic must match the RLD’s active ingredient, strength, dosage form, and route of administration.
The FDA maintains the Orange Book (formally, ‘Approved Drug Products with Therapeutic Equivalence Evaluations’) as the authoritative registry of RLDs and their associated patents. Innovator companies are required to list patents they believe cover the approved drug product, including drug substance patents, drug product patents, and method-of-use patents. This listing obligation is the mechanism by which the entire PIV certification and pre-launch litigation system operates.
When an ANDA applicant certifies under Paragraph IV that it believes an Orange Book-listed patent is invalid, unenforceable, or not infringed by its product, that filing constitutes an artificial act of patent infringement under 35 U.S.C. Section 271(e)(2). The brand manufacturer has 45 days from receiving PIV notice to sue. If it does, the FDA is automatically barred from granting final approval for up to 30 months, regardless of the merits of the case. This statutory 30-month stay is the primary tool by which innovator companies delay generic entry after the initial patent expiry.
The stay is automatic, not judicially assessed. A brand company can trigger it by suing even on patents that courts eventually invalidate or find non-infringed. This is not an abuse of the system from a legal standpoint; it is exactly what the statute permits. From a strategic standpoint, a 30-month stay on a drug generating $2 billion in annual U.S. revenue is worth approximately $5 billion in protected sales. That calculus explains why PIV litigation is now the rule rather than the exception for high-value generics.
180-Day Marketing Exclusivity: The Grand Prize and Its Strategic Distortions
The first filer of a substantially complete ANDA with a PIV certification earns 180 days of marketing exclusivity. During this period, the FDA cannot approve any other ANDA for the same drug. The first generic therefore operates in a duopoly (or triopoly if an authorized generic is present) for six months before the full competitive field enters.
The financial magnitude of this exclusivity can be large. For a drug with $3 billion in annual U.S. brand sales, the first generic can realistically capture 50-70% of prescription volume during the exclusivity window while pricing at 70-80% of the brand price, generating gross revenues that can exceed $500 million in six months before margins on that revenue begin compressing rapidly.
The flip side is equally important: once the exclusivity period ends and additional generic filers receive FDA approval, price compression is steep. Historical FDA data on new generic markets shows that a single generic entrant reduces the average manufacturer price by around 6% versus the brand. Two entrants push the price to 52% of brand price. Six or more entrants routinely drive prices to 5-15% of the original brand price. The entire margin window for a first-to-file generic narrows from a six-month exclusivity period to an even shorter period of genuinely elevated pricing before competitors erode it.
The 180-day prize has also generated two strategic side effects that analysts must model carefully. First, it created the ‘patent challenge race,’ in which multiple generic companies race to file substantially complete ANDAs simultaneously, leading to complex ‘shared exclusivity’ situations where the FDA can designate multiple first filers. Second, it created the authorized generic. Brand manufacturers routinely launch their own authorized generic immediately upon first-generic entry, splitting the exclusivity-period market and reducing the first filer’s effective revenue by 30-50% compared to a scenario without an authorized generic. A Health Affairs analysis found that approximately 70% of authorized generics in eligibility-period markets launched before or during the exclusivity window.
Key Takeaways: Hatch-Waxman
The Hatch-Waxman Act made the U.S. the world’s most competitive small-molecule generic market by prescription volume, but it did so by embedding legal risk and commercial complexity into the market entry process. The 30-month stay creates guaranteed revenue protection for brands regardless of patent merit. The 180-day exclusivity creates concentrated, time-limited profit windows for first-filers that compress rapidly. Authorized generics systematically reduce those windows. Any generic launch strategy that does not account for all four of these variables simultaneously will produce materially wrong revenue projections.
The European Multi-Track Authorization System
The European Union does not have a single generic drug approval pathway. It has four, each suited to different commercial situations. Understanding which pathway to use, and how to sequence them, is the first strategic decision in any European generic launch plan.
The Centralized Procedure
The Centralized Procedure (CP) is administered by the European Medicines Agency (EMA) and produces a single marketing authorization valid across all 27 EU member states plus Iceland, Liechtenstein, and Norway. For biosimilars, the CP is mandatory; all biosimilar authorizations in the EU go through the EMA. For chemical generics, the CP is available if the reference product was itself centrally authorized. The total review timeline is approximately 210 days, making it the most efficient route for companies seeking broad pan-European market access from a single dossier. The tradeoff is that a centralized authorization has no reimbursement attached to it; pricing and reimbursement decisions still happen nationally.
The Decentralized Procedure
The Decentralized Procedure (DCP) is the most commonly used pathway for generic drug launches across multiple EU countries simultaneously. The applicant designates one country as the Reference Member State (RMS), which prepares the assessment report, and submits identical dossiers to all chosen Concerned Member States (CMS) at the same time. If all CMSs agree with the RMS assessment, each issues a national marketing authorization. The DCP is attractive for generic launches because it allows a company to target a customized set of countries rather than all 27, and the RMS choice can be strategic. Countries with known expertise in the relevant drug class or faster review timelines are common RMS selections.
The Mutual Recognition Procedure
The Mutual Recognition Procedure (MRP) applies when a product already holds a national marketing authorization in one member state. The country of original approval acts as the RMS, and additional countries are added as CMSs that recognize the prior assessment. This is often the second step after an initial national launch: enter one market via the National Procedure, then expand via MRP.
The National Procedure
The National Procedure applies to products intended for a single member state’s market. It is the simplest route but reaches the smallest patient population. It is commonly used as a staging step before MRP expansion or for markets where the drug’s commercial viability is limited to one country.
The ‘8+2+1’ Exclusivity Formula
Generic companies in Europe cannot reference an innovator’s clinical data until data exclusivity expires. The standard period is eight years of data exclusivity (during which the generic cannot reference the originator’s dossier) followed by two years of market exclusivity (during which a generic can be authorized but cannot be sold). A third year of market exclusivity can be added if the innovator obtains approval for a new therapeutic indication with significant clinical benefit. This ‘8+2+1’ formula is the European equivalent of the Hatch-Waxman data exclusivity clock, though it is structurally different: it is a regulatory exclusivity, not a patent-based right, and it runs from the date of first centralized authorization, not from the patent grant date.
The Critical Decoupling: Approval Is Not Access
The single most important operational distinction between European and American market access is that in Europe, a marketing authorization confers no commercial rights until each national authority agrees on price and reimbursement. A drug with a valid EMA marketing authorization can sit on the shelf for 18-24 months while a manufacturer negotiates with the French CEPS, the German GKV-Spitzenverband, the UK NICE, and their counterparts across the remaining member states.
This decoupling means a ‘European launch’ is not an event; it is a multi-year process. Companies with experience in EU market access build country-specific launch sequencing models that account for HTA body review timelines, formulary inclusion procedures, and the fact that certain member states use other countries’ approved prices as reference points in their own negotiations (External Reference Pricing). Launching at a low price in Portugal, for example, can suppress the price ceiling achievable in Germany via ERP basket methodology.
Key Takeaways: European Authorization
The European multi-track system gives generic manufacturers flexibility in pathway selection and country targeting that the U.S. ANDA system does not. That flexibility comes with cost: 27 separate pricing and reimbursement negotiations, ERP basket dynamics that penalize early-launch low-price deals, and no automatic substitution mechanism comparable to U.S. formulary tiers. The regulatory clock in Europe measures authorization; the commercial clock measures reimbursement. Generic companies that conflate the two consistently underestimate European launch timelines by 12-18 months.
Regulatory Comparison Table
Feature
United States
European Union
Primary Approval Body
FDA
EMA and/or National Competent Authorities
Key Pathway
ANDA
Centralized, DCP, MRP, or National
Patent Interface
Orange Book listings, PIV certification, 30-month stay
No direct equivalent; country-level tender wins provide temporal advantage
Pricing Authority
Private market with PBM/GPO intermediaries
National government bodies (mandatory for reimbursement)
Post-Approval Launch
Generally immediate (pending patent litigation resolution)
Requires separate national P&R negotiation per country
Strategic Core Competency
Patent intelligence, ANDA timing, litigation
HTA dossier preparation, sequential country launch, ERP basket management
The Patent Lifecycle and Evergreening: A Technology Roadmap
‘Evergreening’ is the industry term for a set of IP strategies that extend commercial exclusivity on a pharmaceutical product beyond the expiration of the original compound patent. It is not a single tactic; it is a layered system of secondary patents, regulatory designations, and commercial maneuvers that, when executed competently, can add 5-15 years of effective market exclusivity to a molecule.
Generic IP teams spend significant resources analyzing and challenging evergreening patents. Innovator IP teams spend equivalent resources constructing them. Understanding the full technology roadmap is essential for both sides.
Stage 1: The Core Compound Patent
Every pharmaceutical product’s IP foundation is the composition-of-matter (CoM) patent covering the active pharmaceutical ingredient (API). This is the single most valuable patent in the portfolio. CoM patents are broad, difficult to design around, and, when valid, provide near-absolute market exclusivity. In the U.S., these patents typically expire 20 years from the filing date, though patent term extension (PTE) can restore up to 5 years of patent life lost during FDA review. In Europe, a Supplementary Protection Certificate (SPC) provides similar protection, extending exclusivity by up to 5 years, capped at 15 years of total market exclusivity.
The CoM patent is the primary target of Paragraph IV litigation in the U.S. and the primary basis for data exclusivity calculations in Europe. For a drug launching in the late 1990s, this patent typically expired in the 2010s, and the decades of high-margin exclusivity before expiry funded the development of the secondary patent layers described below.
Stage 2: Formulation and Salt Form Patents
Once a CoM patent is filed and commercial development begins, innovator companies systematically patent specific formulations (extended-release tablets, nanoparticle suspensions, specific polymorphic forms, specific salt forms) that may offer clinical or manufacturing advantages. These secondary patents can extend exclusivity by 3-8 years beyond the CoM expiry. AstraZeneca’s conversion of omeprazole (Prilosec) to esomeprazole (Nexium), a single-enantiomer switch protecting the R-enantiomer, is the archetype. Nexium launched in 2001 as omeprazole’s CoM patent was expiring, generating over $5 billion in peak annual sales while the original molecule became a generic commodity.
For generic companies, these patents are the first line of challengers after the CoM patent falls. Salt form patents can often be designed around by choosing a different pharmaceutically acceptable salt of the same API. Polymorph patents are more complex; demonstrating that a specific crystalline form is unavoidable during manufacturing (i.e., that producing any crystalline form of the API will inevitably produce the patented polymorph) is a common invalidity argument but requires substantial physical chemistry expertise to execute.
Stage 3: Method-of-Use Patents
Method-of-use (MOU) patents cover the patented therapeutic use of a drug, not the drug itself. They are the ‘skinny label’ problem in generic drug development. When an ANDA applicant seeks approval only for a non-patented indication (a ‘carve-out’), it receives approval with a label that omits the patented indication. This ‘skinny label’ strategy allows market entry while technically respecting the MOU patent.
The legal exposure here is significant and currently unsettled in U.S. courts. Brand manufacturers have argued that a generic’s skinny-label product is subject to induced infringement liability if pharmacists routinely substitute it for the brand even for the patented indication, because the prescribing patterns are indistinguishable. The GlaxoSmithKline v. Teva case on carvedilol generated years of litigation over precisely this theory. For IP teams, the risk profile of a skinny label launch for a drug with MOU patents requires careful legal assessment that goes beyond the standard freedom-to-operate analysis.
Stage 4: Pediatric Exclusivity and Orphan Drug Designation
These are regulatory, not patent-based, mechanisms that extend commercial exclusivity. Pediatric exclusivity under the Best Pharmaceuticals for Children Act adds 6 months to the end of any qualifying patent or exclusivity period when a sponsor conducts FDA-requested pediatric studies. This applies even to the 30-month stay and even to drugs already approved for adult use. Orphan drug designation provides 7 years of marketing exclusivity for drugs treating rare diseases (affecting fewer than 200,000 Americans). Both mechanisms interact with generic timing in predictable ways, and Orange Book patent listing data generally reflects their application. In Europe, orphan medicinal product designation provides 10 years of market exclusivity (with a 2-year pediatric extension possible).
Stage 5: Delivery System and Device Patents
For drugs requiring specific delivery mechanisms (autoinjectors, metered-dose inhalers, transdermal patches, prefilled syringes), device patents can extend effective market exclusivity long after the API patent expires. AbbVie’s adalimumab (Humira) portfolio illustrates this at extreme scale, discussed in the IP valuation section below. The autoinjector device and specific injection-site formulation patents added years of practical exclusivity by making biosimilar interchangeability demonstrations technically more complex.
In Europe, device patents are enforced via national courts and do not interact with the EMA’s biosimilar authorization process directly. But a biosimilar with a different delivery device than the originator faces prescriber inertia and formulary access challenges, even if the EMA has granted full interchangeability from a scientific standpoint.
Stage 6: New Indication Approvals and Label Expansion
Filing for and receiving approval for a new indication re-starts certain exclusivity clocks. In the U.S., a new chemical entity (NCE) exclusivity period of 5 years does not apply to new indications, but new clinical investigations required for the new indication can generate 3-year exclusivity. In Europe, a new indication approval can unlock the additional 1-year market exclusivity under the ‘8+2+1’ formula, making indication expansion a direct IP-lifecycle management tool.
Evergreening Technology Roadmap Summary
Stage
Patent/Exclusivity Type
Typical Extension
Primary Challenge Strategy
1
Composition-of-matter (CoM)
20 years from filing (base)
PIV/invalidity litigation; IPR petitions
2
PTE / SPC
Up to 5 additional years
Confirm accurate calculation; challenge scope
3
Salt/polymorph form
3-8 years beyond CoM
Design-around; inherency arguments
4
Formulation (ER, nanoparticle)
3-7 years
Bioequivalence with different excipient matrix
5
Method-of-use
Variable
Skinny label carve-out; invalidity for obviousness
6
Pediatric exclusivity
+6 months on any eligible exclusivity
Comply; no challenge available
7
Delivery device/autoinjector
Variable
Design-around device; different delivery platform
8
New indication
+1-3 years (jurisdiction-dependent)
Monitor NDA/sNDA filings
Investment Strategy: Evergreening
Investors evaluating innovator pharmaceutical companies should model each late-stage pipeline drug’s effective commercial exclusivity period by mapping all seven evergreening stages, not just the lead compound patent. The difference between a drug with a robust secondary patent estate and one without can be 7-10 additional years of near-exclusive revenue. Conversely, for generic-focused companies, a target drug’s secondary patent landscape is as important as the CoM expiry date. A Teva or Sandoz entering a market against a dense secondary patent portfolio faces structurally higher legal costs and longer time-to-revenue than entering against a single-patent drug. IP density, measured by the number of Orange Book-listed patents per drug and the date distribution of their expiries, should be a standard metric in any generic pipeline analysis.
IP Valuation as a Core Asset: Drug-Level Analysis
IP portfolios in pharma are not intangible abstractions. They are the primary driver of revenue duration and predictability. This section analyzes the IP value architecture for several drugs central to U.S. and European generic market development. Each case illustrates a different dimension of how IP structure determines market dynamics and competitive timing.
Atorvastatin (Lipitor): The $13 Billion Compound Patent Cliff
Pfizer’s atorvastatin (Lipitor) was the world’s best-selling drug for multiple years, generating peak annual U.S. revenues exceeding $7.9 billion. Its core IP structure was a composition-of-matter patent covering the atorvastatin calcium compound, expiring in March 2010, extended by PTE to November 2011. Pfizer also held process patents and an Orange Book-listed crystalline form patent.
Ranbaxy (now Sun Pharma subsidiary) was the first ANDA filer with a PIV certification, triggering years of patent litigation that ended in a global settlement in 2008. The settlement allowed Ranbaxy to launch in the U.S. on November 30, 2011, the day after the extended patent expired. Pfizer launched an authorized generic through Watson Pharmaceuticals (now Teva) simultaneously, capturing roughly half of the first-generic exclusivity period’s market economics.
Post-exclusivity price erosion was rapid and deep. Within 18 months of full generic market opening in May 2012, atorvastatin prices at the manufacturer level had dropped to 5-10% of brand price, following the standard multi-entrant curve. Generic atorvastatin now trades at fractions of a cent per tablet in competitive tender markets.
The IP valuation lesson from Lipitor: the absence of a robust secondary patent estate, beyond the CoM and its PTE, meant that the ‘cliff’ was almost vertical. No extended-release formulation patent, no device patent, no meaningful method-of-use patent covering primary cardiovascular indications. When the core patent fell, revenue collapsed within 24 months from over $7.9 billion annually to near zero for the brand. The commercial value of all of Pfizer’s Lipitor IP estate was almost entirely concentrated in the single CoM/PTE combination. That is a structurally fragile IP architecture for a post-launch brand-defense perspective.
Adalimumab (Humira): The Patent Thicket at Industrial Scale
AbbVie’s adalimumab (Humira) illustrates the opposite architecture. The compound patent for adalimumab expired in 2016. What followed was not a patent cliff but a thicket: AbbVie assembled over 250 patents related to adalimumab, covering the manufacturing process, specific formulations (including the low-citrate formulation for injection-site pain), delivery devices, dosing regimens, and methods of use across multiple autoimmune indications.
In the United States, AbbVie used this portfolio to negotiate settlements with all potential biosimilar competitors, delaying any biosimilar entry until January 2023, more than six years after the core patent expiry. The financial value of those settlements has been estimated by industry analysts at over $10 billion in preserved revenue. The IP estate around Humira, particularly the 2016-2023 exclusivity-extending secondary patents, was worth more in NPV terms than almost any other single pharmaceutical patent estate in history.
The European experience was sharply different. EU biosimilar entry began in October 2018, following EMA approval of multiple adalimumab biosimilars. European healthcare systems, particularly in Germany and the UK via tender and Drug Tariff mechanisms, rapidly shifted utilization to biosimilars. By 2022, biosimilar adalimumab held over 90% of volume in Germany and over 70% in the UK, with prices 70-80% below Humira’s original list price. The European IP thicket proved weaker against direct government procurement incentives than against the U.S. PBM rebate architecture, which initially rewarded AbbVie for maintaining the high-list-price originator on formularies.
IP valuation implication: the Humira case demonstrates that secondary patent estates have jurisdiction-specific value. In the U.S., where commercial entry requires private-party litigation, a dense patent thicket created enormous settlement leverage. In Europe, where procurement is public and payers can mandate biosimilar use regardless of patent disputes handled separately, the same patent estate bought much less time. A fair-market IP valuation of Humira’s secondary patent portfolio must discount the European contribution to roughly 20-30% of the U.S. contribution per equivalent market size.
Simvastatin (Zocor): The Generic Penetration Benchmark
Merck’s simvastatin (Zocor) is a cleaner case study in pricing dynamics across European markets because its patent expiry pre-dates many of the current complexities. Post-expiry price data across Europe showed astonishing variation: UK ex-manufacturer prices per dose reached EUR 0.02, Germany EUR 0.08, France EUR 0.19, Italy EUR 0.11, and Switzerland EUR 0.48. That is a 2,300% spread across countries for the same off-patent molecule, all priced in the same currency, all subject to some form of government oversight.
The IP valuation context here is less about the drug itself and more about what this price range tells investors about the European generic market’s structure. Countries with aggressive tender systems (UK via Drug Tariff, Germany via Ausschreibungen) compress prices to near-manufacturing cost. Countries using administrative reference pricing (France, Spain) set floors that are higher but more stable. Switzerland, with its cross-referencing methodology weighted toward high-price basket countries, maintained the highest price in the continent. These structural pricing differences mean that a simvastatin generic’s royalty or licensing valuation is market-specific. A license that covers the EU as a monolithic territory is commercially meaningless; the value must be disaggregated by country.
Investment Strategy: IP Valuation at the Drug Level
Generic pipeline assessments should include a structured IP valuation methodology covering at minimum the following seven variables for each target drug: the primary compound patent expiry date with any PTE or SPC extension applied; the number and expiry distribution of Orange Book-listed secondary patents; the litigation history on each patent and available outcome data from comparable cases; the presence of NCE or other regulatory exclusivities that are not patent-based; the regulatory pathway complexity (standard ANDA vs. 505(b)(2) vs. biosimilar BLA); the market architecture in target geographies (tender-based, reference-price-based, or PBM-controlled); and the authorized generic risk probability. Discounting a potential first-to-file exclusivity period by 50% to account for authorized generic entry is a reasonable conservative assumption for most large-molecule and specialty small-molecule categories.
Who Sets the Price: PBMs, GPOs, and European Government Controls
The U.S. Architecture: Private Intermediary Power
The U.S. prescription drug market is not a free market in any operational sense. It is a market dominated by three integrated pharmacy benefit manager (PBM) entities, each affiliated with a major health insurer, whose collective formulary decisions govern drug access for approximately 270 million Americans.
CVS Caremark, affiliated with Aetna, Express Scripts (Evernorth, a Cigna subsidiary), and OptumRx (a UnitedHealth Group subsidiary) together control approximately 80% of U.S. PBM market share. They earn revenue through administrative fees from health plan clients, rebates negotiated from brand-name manufacturers, and spread pricing on generic drug claims. Spread pricing is the practice of charging a health plan one price for a generic claim while reimbursing the dispensing pharmacy a lower price and retaining the difference. A 2018 Ohio Medicaid audit found that the state’s managed care PBMs retained an average spread of 31.4% on generic claims. The FTC’s 2024 report on PBM practices found that the three major PBMs generated approximately $1.4 billion from spread pricing on 51 specialty generic drugs over roughly five years, and that they marked up some specialty generic prices by over 1,000% while steering prescriptions to affiliated specialty pharmacies.
For generic manufacturers, PBM market power creates a specific type of commercial risk: formulary exclusion. If a PBM decides not to include a generic on its preferred formulary tier or, more dramatically, excludes it in favor of a competing manufacturer’s version, the commercial impact can be immediate and severe. The MAC (Maximum Allowable Cost) list is the primary PBM tool for reimbursement rate-setting on generics. MAC prices are set by PBMs largely without public transparency and can be updated in real-time, sometimes dropping to prices below generic manufacturers’ production costs. This is the mechanism behind recurring drug shortage cycles: manufacturers exit uneconomic markets, supply concentrates among fewer producers, and supply chain fragility increases.
Group Purchasing Organizations (GPOs) exercise parallel power in the institutional segment. Hospital and healthcare system purchasing is aggregated through GPOs, which contract with manufacturers for net price discounts (not rebates) in exchange for volume commitments. GPO administrative fees of 1.75-2.0% are paid by the vendor. The hospital generic drug market is accordingly more transparent in net pricing than the retail PBM segment, but equally subject to race-to-the-bottom price dynamics when multiple manufacturers compete for GPO contracts. Low-margin hospital generics, including many sterile injectables, are the product category most frequently cited in FDA drug shortage reports. There is a direct causal line from GPO price pressure on sterile injectable generics to the shortage events that cause hospital-level patient safety concerns.
The European Architecture: Government as Primary Price Setter
European governments use a structured toolkit to set or cap drug prices across multiple dimensions. The mechanisms vary by country but share the common feature of government entities as the primary counterparty in pricing negotiations.
External Reference Pricing
External Reference Pricing (ERP) sets a drug’s national price by referencing the prices approved in a ‘basket’ of other countries. At least 25 of 29 surveyed European countries use ERP for at least some drug categories. The basket composition and the calculation methodology (lowest price in basket, average, or weighted average) vary significantly. Countries that reference a basket of lowest-price markets systematically import price pressure from cost-containment leaders. Countries with basket compositions weighted toward higher-price markets (typically smaller or newer EU member states) face less downward pressure but may be subject to parallel trade, where wholesalers purchase product in low-price markets and re-export it to high-price markets, eroding the manufacturer’s pricing architecture across borders.
ERP creates a pricing sequence problem for launches. A manufacturer that launches at a low price in a first-wave country risks that price becoming the reference anchor for subsequent markets via ERP. Sophisticated European launch sequencing accounts for which markets reference which basket countries and in what priority order, then constructs a launch sequence that puts high-value markets first or uses managed access agreements to delay official list price establishment in reference-heavy markets.
Internal Reference Pricing
Internal Reference Pricing (IRP), used by at least 22 European countries, groups therapeutically similar drugs into clusters and sets a single maximum reimbursement level for the cluster. If a patient chooses a drug priced above that level, the excess is paid out-of-pocket. This system directly pressures manufacturers to price at or below the reference level to avoid patient cost-sharing that drives prescribers toward cheaper alternatives. IRP effectively establishes an administrative price ceiling that compresses the range of achievable prices within a therapeutic category.
For generic drugs, IRP typically means that the reimbursement ceiling is set at some fraction of the originator’s price (often 20-60% depending on the country and drug category). All generics are reimbursed up to this ceiling, and price competition to win market share tends to occur within a narrow band near or slightly below it, rather than the steep downward spiral seen in U.S. multi-entrant markets.
German Ausschreibungen: Tender System Deep Dive
Germany’s statutory health insurance (Sickness Fund, or GKV) system operates the EU’s most studied tender mechanism, the Ausschreibungen, enabled by the GKV Modernization Act of 2003 and expanded since 2007. Approximately 70 million Germans receive coverage through the GKV’s 97 Sickness Funds, which collectively conduct competitive tenders for generic drug supply contracts typically covering 1-2 year periods.
Tenders are conducted by active ingredient, and contracts are typically ‘winner-take-most’ or ‘winner-take-all’ within the Sickness Fund’s enrolled population. The winning manufacturer supplies the contracted active ingredient to pharmacies within the fund’s network, and pharmacists are required to dispense the contracted product regardless of the prescriber’s brand preference (with narrow clinical exceptions). The scale is significant: a single AOK (Allgemeine Ortskrankenkasse, the largest GKV fund group) tender can cover patient populations of 20-30 million people.
The commercial consequences for manufacturers are structurally predictable. Winning a major GKV tender provides virtually guaranteed volume for the contract period, making the bid a high-stakes pricing decision. Losing a tender means near-complete market exclusion for the contract duration. This binary outcome forces extreme price competition. German generic tender prices for commoditized molecules like simvastatin, omeprazole, or metformin now routinely reach EUR 0.01-0.03 per tablet at the ex-manufacturer level. Margins at these prices are functionally zero or negative when manufacturing costs, logistics, and regulatory maintenance are included for European-manufactured product.
The unintended result has been supply chain concentration. Only manufacturers with ultra-low production costs, primarily those operating in India and China, can win German tenders profitably over multiple contract cycles. European domestic manufacturing of generic APIs has declined sharply since the tender system’s expansion. The German Institute for Infectious Diseases (RKI) and the Association of German Pharmacists have documented recurring shortages of antibiotics, cardiovascular generics, and CNS drugs directly traceable to single-supplier tender concentration. This is not a hypothetical policy risk; it is an operational reality that the EU’s revised pharmaceutical strategy is specifically designed to address.
French Tarif Forfaitaire de Responsabilite
France’s reference pricing mechanism for generics, the Tarif Forfaitaire de Responsabilite (TFR), sets a reimbursement ceiling for groups containing an originator and all its generic versions. When a generic enters the French market, it does so at a price 60% below the originator’s official price; simultaneously, the originator’s reimbursed price is cut by 20%. The TFR is then set at a price level that captures the generic’s launch price as the reference ceiling for the group.
This structure creates a compressed, stable price range. Unlike the German tender system, France does not produce winner-take-all dynamics. Multiple generics can achieve reimbursement and co-exist in the market, but the TFR ceiling caps the price level for all of them. Generic market share in France remains materially lower than in Germany or the UK, hovering at 30-40% of prescriptions by volume, reflecting weaker mandatory substitution incentives and persistent physician brand loyalty in some therapeutic categories.
UK Drug Tariff and Market Competition
The UK takes a distinct approach. For generic drugs, the National Health Service relies on market competition to set prices. Pharmacists are reimbursed at the Drug Tariff price but are free to purchase generics from any wholesaler or manufacturer at a lower market price and retain the margin. This creates strong commercial incentives for pharmacists to source the cheapest available product, which in turn drives intense manufacturer-level price competition.
The UK generic market is consequently one of the lowest-priced in Europe by ex-manufacturer price, comparable to Germany in most categories. The Competition and Markets Authority (CMA) has conducted multiple investigations into suspected anti-competitive behavior in the UK generic market, including several that resulted in significant fines for price-fixing among parallel importers and smaller generic manufacturers. The market’s competitive structure is effective at driving low prices but vulnerable to manipulation in categories with few active suppliers.
Key Takeaways: Pricing Architecture
PBMs are the most powerful commercial intermediaries in pharmaceutical history. Their formulary decisions, MAC list updates, and spread pricing practices have more immediate impact on a generic drug’s commercial trajectory in the U.S. than FDA approval. In Europe, government procurement mechanisms replace PBMs as the primary price-setting force, but the degree of price control, the sophistication of the mechanism, and the resulting market structure vary dramatically across the 27 member states. Understanding this variation at the country level is not optional for European launch planning; it is the core analytical requirement.
Quantitative Scorecard: Prices, Volumes, and Spending Across Markets
The Brand-Generic Price Paradox
The 2022 HHS/ASPE analysis of 33 OECD countries established the core quantitative finding: U.S. overall prescription drug prices are 2.78 times the OECD median. That aggregate masks an internal split of extraordinary magnitude. U.S. brand-name drug prices are 4.22 times the OECD median. U.S. unbranded generic prices are 67 cents for every dollar spent in the comparison countries.
This is not a coincidence. The two sides of this price distribution are mechanically related. The U.S. system was designed to allow brands to launch at uncapped prices, and the resulting high baseline creates two downstream effects: it funds the patent litigation that eventually opens the generic market, and it creates the massive revenue spread that generic companies fight over during PIV challenges and exclusivity periods. The generic price floor in the U.S. is set not by government mandate but by the competitive floor among multiple manufacturers plus GPO/PBM pressure. The brand price ceiling in the U.S. is limited only by what the market tolerates before formulary exclusion becomes a commercial constraint.
Europe’s compressed price range is the result of government ceilings on brands and price floors on generics set by ERP, IRP, and TFR mechanisms. Neither side of the market reaches the extremes seen in the U.S. European policymakers prioritize stability over the volatile feast-or-famine pricing cycles seen in the American generic market.
Multi-Entrant Price Dynamics: The U.S. Compression Curve
The following table is derived from HHS ASPE analyses of new generic market entries, covering Medicare Part D data from 2007-2022:
Number of Generic Entrants
Average Price as % of Pre-Generic Brand Price
1 (first generic)
~94% (6% reduction)
2
~52%
3-5
~25-35%
6+
~5-15%
10+
~3-8%
This curve is the core quantitative input for generic launch financial modeling. The revenue model for a first-filer during 180-day exclusivity assumes a duopoly at approximately 50-60% of brand price. The model for a later entrant in a market with 6+ competitors assumes pricing at 5-15% of brand price with thin margins. Any company projecting mid-to-late generic entry into a fully competitive market must either have a manufacturing cost advantage that justifies operating at these prices or a supply reliability argument for securing GPO contracts from competitors facing supply disruptions.
Volume Penetration: The 90% vs. 70% Gap
U.S. generic prescription volume share is approximately 90-91% of total dispensed prescriptions. Germany and the UK maintain shares exceeding 80%. France, Italy, and several Southern and Eastern European markets remain below 40%, with Italy at approximately 20-25% and Switzerland at a remarkably low level for a high-income country.
The structural drivers of low generic penetration in Southern Europe are consistent: branded generic products (off-patent drugs still marketed under a trade name and perceived as superior by prescribers and patients), weak or absent mandatory substitution rules at the pharmacy level, financial structures that do not reward pharmacists for dispensing the cheapest alternative, and prescriber behavior shaped by brand marketing investment that continued well past patent expiry. Spain has made measurable progress, exceeding 40% generic volume share, driven by reference pricing reforms and mandatory substitution in public outpatient settings.
The volume gap has direct implications for generic revenue projections by geography. A drug achieving 85% generic volume penetration in the U.S. within 24 months of launch will take 5-7 years to reach 30% penetration in France, if it gets there at all. The product-market fit for a generic in Southern Europe requires marketing investment and relationship management with healthcare providers that is not necessary in markets with structural substitution mandates.
Value Share vs. Volume Share: The Cost Structure of Modern Healthcare
The most operationally important statistic in generic drug market analysis is the gap between volume share and value share. In the U.S., generics comprise 90% of prescription volume but only about 13% of total prescription drug spending. Brand drugs, at 10% of prescriptions, account for approximately 87% of spending. In Europe, generics account for 70% of volume but only 19% of spending value.
This 77-percentage-point spread between U.S. generic volume share and value share, compared to a 51-point spread in Europe, quantifies the price disparity between brands and generics in each market. The practical implications: overall pharmaceutical spending per capita in the U.S. vastly exceeds any European country not because generics are priced too high (they are priced lower than Europe for equivalent molecules) but because brand drugs carry prices that dwarf anything seen in government-negotiated European markets.
For institutional investors, this spending structure means that the ‘generic drug savings’ narrative in the U.S. is best understood as a partial offset of a brand-pricing model with no peer-country parallel. The $445 billion in 2023 U.S. generic and biosimilar savings, cited by AAM/IQVIA, is real, but it is calculated against a brand price baseline that is itself 4.22 times the OECD median. Savings measured against a European brand price benchmark would be proportionally much smaller.
Illustrative Per-Dose Generic Price Comparison (Selected European Markets)
Based on Wouters et al., 2017 data, updated with available national agency public pricing databases. Intended for order-of-magnitude comparisons; specific tender and contract prices may be materially lower.
Drug
UK (EUR)
Germany (EUR)
France (EUR)
Spain (EUR)
Italy (EUR)
Switzerland (EUR)
Amlodipine 5 mg
0.01
0.01
0.14
0.04
0.09
0.27
Atorvastatin 40 mg
0.03
0.07
0.27
0.29
0.13
0.61
Metformin 500 mg
0.02
0.02
0.06
0.02
0.03
0.09
Omeprazole 20 mg
0.03
0.12
0.20
0.06
0.21
0.91
Simvastatin 40 mg
0.02
0.08
0.19
0.04
0.11
0.48
The spread within Europe for these commoditized generics is extraordinary. Omeprazole costs 30 times more per dose in Switzerland than in the UK. Amlodipine costs 27 times more in France than in the UK or Germany. These differences are not explained by formulation variation; they are explained by pricing mechanism. Markets with strong tender competition (UK, Germany) have compressed to near-cost pricing. Markets with administrative reference pricing at a higher floor (France, Switzerland) maintain price stability at the cost of less aggressive cost containment.
Key Takeaways: Quantitative Scorecard
Both the U.S. and European generic markets deliver enormous cost savings in absolute terms. The U.S. system concentrates savings at the generic level while allowing brand prices to reach multiples of OECD peers, producing the lowest-cost generics alongside the highest-cost overall pharmaceutical spending. Europe’s mechanisms moderate both sides of the price distribution, resulting in lower brand prices and moderately higher generic prices than the U.S., with more variable generic volume penetration by country. The per-dose price ranges within Europe, varying by 10-30x for identical molecules across member states, are the most practically important data for generic manufacturers determining market prioritization.
Biosimilar Technology Roadmap and the Regulatory Divergence
Biologics, drugs derived from living cell systems rather than chemical synthesis, now represent the majority of new drug approvals by value. The top-selling drugs in the world are biologics: adalimumab, pembrolizumab, nivolumab, ustekinumab, trastuzumab, ranibizumab. Their patent expiries create the most commercially significant off-patent opportunities of the coming decade.
A biosimilar is not a generic in the chemical sense. It is a biological medicine that is ‘highly similar’ to an already-approved reference biologic in terms of safety, purity, and potency, with no clinically meaningful differences in safety and effectiveness. Demonstrating that similarity requires a fundamentally different analytical and clinical program than small-molecule bioequivalence.
The Scientific Basis: Why Biosimilars Are Not Chemical Generics
Biologic drugs are produced using living cells (bacterial, yeast, mammalian), and the manufacturing process itself is part of the product definition. Small changes in cell culture conditions, purification steps, or formulation can alter the drug’s glycosylation pattern, aggregation state, or immunogenicity profile. Regulatory agencies require biosimilar developers to conduct a stepwise ‘totality of evidence’ comparison that includes analytical characterization (structural and functional), non-clinical studies (pharmacokinetics, pharmacodynamics, toxicology in some cases), and clinical studies (PK/PD bridging studies, and in some cases, clinical efficacy/safety trials in at least one sensitive indication).
The development cost for a biosimilar ranges from $100 million to over $250 million, compared to $1-5 million for a typical small-molecule ANDA. Development timelines are 7-12 years from initial cell banking through regulatory approval. This cost and timeline structure means that biosimilar development is a capital-intensive, long-horizon project not accessible to most small generic manufacturers. The market is structurally concentrated among companies with the bioreactor capacity, analytical expertise, and regulatory track record to execute complex biologic characterization programs.
EU Regulatory Pathway: The EMA Biosimilar Framework
The EMA established the world’s first formal biosimilar approval pathway in 2004, and the first biosimilar (Omnitrope, a biosimilar somatropin) was approved in 2006. The EU framework requires a ‘comparability exercise’ across three domains: quality (analytical and functional characterization), non-clinical (in vitro and in vivo pharmacology), and clinical (PK/PD studies plus safety and immunogenicity data). The EMA’s biosimilar guidelines, maintained by the Committee for Medicinal Products for Human Use (CHMP), are the global reference for biosimilar scientific standards.
As of early 2026, the EU has approved biosimilars across 22 reference biologic molecules, including multiple products competing against infliximab, adalimumab, trastuzumab, bevacizumab, rituximab, etanercept, and insulin glargine. The EU biosimilar market is the most mature in the world. Penetration in Germany and Norway for high-volume biologics exceeds 80% by volume in publicly tendered market segments. The EMA’s framework explicitly does not grant automatic interchangeability status (the ability for pharmacists to substitute a biosimilar for the reference without physician intervention), leaving that decision to individual member state regulators. In practice, most EU member states permit substitution in naive patients and increasingly in switching patients, supported by the growing body of real-world evidence from transition programs.
FDA Pathway: The BPCIA and the Interchangeability Standard
The U.S. biosimilar regulatory pathway was established by the Biologics Price Competition and Innovation Act (BPCIA) of 2010, six years after the EMA’s framework. The FDA’s biosimilar approval standard mirrors the EMA’s ‘totality of evidence’ approach, but the U.S. system adds a distinct category: ‘interchangeable biosimilars,’ which can be substituted for the reference product by a pharmacist without physician intervention, equivalent to the generic substitution that occurs routinely for small-molecule drugs.
Achieving interchangeable status requires, in addition to the standard biosimilar demonstration, a clinical ‘switching study’ showing that alternating between the biosimilar and the reference product does not produce adverse immune responses or reduced efficacy. The FDA’s first interchangeable biosimilar designation was granted to Semglee (insulin glargine-yfgn, Mylan/Viatris) in July 2021. Cyltezo (adalimumab-adbm, Boehringer Ingelheim) received interchangeable designation in 2023.
Despite the regulatory pathway being in place since 2010, U.S. biosimilar market penetration has lagged Europe by years. The adalimumab case is the most illustrative. Multiple adalimumab biosimilars received FDA approval starting in 2016, yet none launched in the U.S. until January 2023, owing to AbbVie’s patent settlement strategy detailed in the IP valuation section. When the biosimilars launched, uptake was initially slow. PBM formulary structures continued favoring the high-rebate originator Humira in many health plan formularies through 2023 and into 2024. The FTC has cited this pattern as a specific anti-competitive concern in its PBM investigations.
Patent Thickets: The Biosimilar-Specific Challenge
Small-molecule generics face a patent thicket problem, but it is manageable through established PIV litigation strategies. Biologics face a structurally more severe version of the same problem. The BPCIA’s ‘patent dance’ process (an elaborate pre-litigation information exchange between the reference product sponsor and the biosimilar applicant, defined in 42 U.S.C. Section 262) creates a procedural mechanism that reference product sponsors can use to delay litigation commencement and, by extension, delay market entry. Critically, unlike Hatch-Waxman’s automatic 30-month stay, the BPCIA does not provide a statutory stay, but the patent dance creates procedural delays with similar practical effect.
AbbVie’s Humira patent estate (250+ patents), Amgen’s and J&J’s portfolios for etanercept and infliximab respectively, and Genentech/Roche’s portfolio around trastuzumab and bevacizumab are the canonical examples of biologic patent thickets. The density of process patents, formulation patents, and device patents around each of these molecules created litigation timelines long enough to justify the commercial calculus of settling rather than fighting, accepting delayed entry over indefinite litigation.
In Europe, the same patents exist but they do not interact with the EMA marketing authorization process. Biosimilar companies must navigate national patent courts in each EU jurisdiction, but they are doing so after EMA approval has already been granted and in legal systems that typically move faster to judgment than U.S. district courts. The practical result is that European biosimilar entry has been less patent-delayed and more adoption-constrained, while U.S. biosimilar entry has been more patent-delayed and, once launched, still faces the PBM rebate wall.
Phase 3 efficacy/safety study (if required for sensitive indication)
Years 6-10
Clinical similarity confirmation
9
Immunogenicity study (for interchangeability designation in U.S.)
Years 7-10
Switching study data
10
Regulatory submission and review
Years 9-12
Marketing authorization
11
Patent dance / patent litigation resolution
Years 9-14
Launch clearance
12
Commercial launch and market access negotiations
Years 12-15
Market penetration
Total development investment: $100-250 million. Total timeline: 7-12 years to approval, 9-15 years to commercial launch when patent resolution is required.
Investment Strategy: Biosimilars
The biosimilar market opportunity in the U.S. and EU is driven by the biologic patent cliff: approximately $100 billion in annual global biologic revenues will face biosimilar competition by 2030. Investors evaluating biosimilar-focused companies should weight four variables: the stage and cost of the development pipeline, the IP clearance status for each reference product in key markets, the company’s commercial infrastructure for PBM negotiations and tender participation, and the company’s manufacturing scale and quality track record (FDA 483 observations and EMA inspectional findings are public and predictive). Companies without a track record of winning GKV tenders or PBM formulary positions for prior biosimilars should be treated as higher-risk commercialization candidates regardless of their regulatory development competence.
Strategic Playbooks: Launching Generics in Two Distinct Arenas
The U.S. Playbook
A successful U.S. generic launch in a Hatch-Waxman context follows a structured sequence that begins years before the target drug’s primary patent expiration. The sequence begins with comprehensive patent intelligence. Every patent listed in the Orange Book for the reference drug must be analyzed: date, scope, prosecution history, and any prior litigation outcomes in the same or related ANDA cases. Secondary patents covering salts, polymorphs, metabolites, and delivery systems receive separate assessment for strength, design-around feasibility, and potential invalidity arguments. The Orange Book is the starting document, but it is not comprehensive; SPC filings, patent term extension certificates, and non-Orange-Book-listed process patents require separate monitoring.
Based on this analysis, the company determines whether to pursue a Paragraph IV certification strategy (challenge one or more listed patents), a Paragraph III strategy (wait for expiry), or a 505(b)(2) application (for modified versions of approved drugs). The PIV decision involves quantifying the expected litigation cost (typically $2-10 million per defendant per case, with multi-patent cases easily exceeding $20 million), the probability of winning invalidity or non-infringement arguments based on prior art and claim construction analysis, the 30-month stay exposure, and the commercial reward if the challenge succeeds (180-day exclusivity plus sustained post-exclusivity volume). This decision should be modeled as a risk-adjusted NPV calculation with explicit probability-weighted scenarios for win, loss, and settlement outcomes.
Concurrent with legal strategy, the commercial team must begin engaging major PBMs at least 12-18 months before anticipated launch. PBM formulary committee cycles operate on annual schedules in many cases. A drug that is not on the formulary committee’s evaluation calendar for the next cycle may miss the window for formulary inclusion entirely, costing a launch cycle (12 months of delayed or sub-optimal uptake). Early commercial engagement also allows the manufacturer to assess MAC list positioning for the target molecule and anticipate whether the anticipated launch price will be above or below the PBM’s current MAC for the class, a critical commercial model input.
Authorized generic risk must be quantified as a scenario in the financial model. Brand manufacturers with the manufacturing capability or a willing partner will typically launch an authorized generic simultaneously with first-filer exclusivity to recapture volume. This is not a surprise when it happens; it is a predictable defensive strategy. The analysis should include who the brand manufacturer’s likely partner would be (they frequently use existing contract manufacturing relationships), and whether that partner is also an ANDA filer.
The European Playbook
European generic launches require a fundamentally different operational architecture. The regulatory pathway selection (CP, DCP, MRP, or National) is the first decision, and it determines the timing and sequencing of everything downstream.
For a drug with broad European market potential across 10+ countries, the DCP is usually the preferred pathway, with a carefully selected RMS. The RMS selection should account for that agency’s review speed and expertise in the drug class, the agency’s track record of efficiently handling CMS objections, and whether the country is a high-priority commercial market (combining RMS status with a priority commercial market reduces the delay between approval and revenue generation in the first market).
After authorization, the critical analytical task is building a country-level launch sequencing model. This model must account for the ERP basket structure: which countries reference which others, how the basket price is calculated (lowest price, average, or weighted average), and what launch price in the first market will be used as a reference anchor in subsequent markets. For a drug intended to launch in Germany, the UK, France, and Italy, the interplay between these countries’ ERP baskets can mean that a low launch price in France reduces the ceiling in markets that reference France. Proper ERP basket analysis can be worth tens of millions of euros in cumulative revenue over the product lifecycle.
The German Ausschreibungen tender requires dedicated preparation. A tender bid strategy must balance price against the risk of not winning (market exclusion for the contract period) against the risk of winning at an unprofitable price (inability to supply profitably with attendant supply chain penalties). Companies without manufacturing cost structures competitive with Indian and Chinese API producers must make a strategic decision about whether to pursue primary tender contracts or to compete for secondary supplier positions in multi-winner tenders, which the revised EU procurement guidance is beginning to encourage.
For France and Italy, the market access team must prepare full HTA dossiers for the Transparency Commission (France) and AIFA (Italy). For generic drugs, these dossiers are typically less burdensome than for new innovative medicines, but the formulary inclusion process, clinical guidelines alignment, and pharmacist incentive structures in each country require country-specific planning and local medical affairs support.
Case Study Deep Dive: Generic Atorvastatin in the U.S. and Europe
The generic atorvastatin (Lipitor) launch in 2011-2012 remains the most studied example of divergent market dynamics between the U.S. and Europe in the modern patent-cliff era.
In the United States, the launch was determined entirely by litigation settlement. Ranbaxy filed its PIV certification years before patent expiry and endured extended global litigation with Pfizer on multiple atorvastatin patents. The 2008 global settlement defined the terms precisely: Ranbaxy could launch its U.S. generic atorvastatin product on November 30, 2011, with 180-day first-filer marketing exclusivity. Pfizer’s authorized generic, partnered with Watson (Teva), launched simultaneously. The result was a classic exclusivity-period duopoly at approximately 60-70% of brand price, followed by rapid multi-competitor price compression when additional ANDAs were approved in June 2012. Within 12 months, the U.S. atorvastatin generic market had compressed to approximately 8-12% of original brand price. The estimated lost revenue to Pfizer from the full generic transition was over $7 billion in annualized U.S. revenue.
In Europe, the launch structure was entirely different. Settlement terms with Pfizer allowed launches in several European markets ahead of formal patent expiry. Ranbaxy launched first in Italy, the Netherlands, and Sweden in early March 2012, approximately two months before the patents formally expired in May 2012. Other generic manufacturers (Mylan, Actavis, others) followed with launches in France, Germany, Belgium, Ireland, and additional markets from May onward. There was no single ‘launch day’ for European generic atorvastatin. Each country had its own patent expiry analysis, its own HTA process, and its own formulary or tender inclusion timeline. The staggered nature of the European launch meant that market share buildup was slower and more fragmented than in the U.S., where the FDA’s 180-day exclusivity date created a single competitive event.
The aggregate commercial dynamics confirmed the structural differences quantified elsewhere: U.S. generic atorvastatin reached over 80% prescription market share within six months of full market opening. French generic atorvastatin reached approximately 30-35% market share over 18 months, constrained by reference pricing structure and branded prescribing inertia.
Policy in Motion: The Inflation Reduction Act and EU Pharmaceutical Strategy
The Inflation Reduction Act: Structural Implications for Generic Markets
The Inflation Reduction Act (IRA), signed in August 2022, contains the first statutory authority for the U.S. government to negotiate directly with drug manufacturers on prices for a defined set of Medicare Part D and Part B drugs. The first 10 drugs subject to negotiation were announced in August 2023, and the negotiated prices took effect January 1, 2026.
The IRA’s direct effect is on brand-name drugs that have no approved generic or biosimilar competitor and have been on the U.S. market for at least 9 years (small molecules) or 13 years (biologics). The negotiation applies only to the Medicare program; commercial market prices are not directly constrained. The initial selected drugs (including Eliquis/apixaban, Jardiance/empagliflozin, Xarelto/rivaroxaban, Januvia/sitagliptin, Farxiga/dapagliflozin, Entresto/sacubitril-valsartan, Enbrel/etanercept, Imbruvica/ibrutinib, Stelara/ustekinumab, Fiasp and NovoLog insulin) are precisely the drugs that generic and biosimilar manufacturers have been targeting or have already filed for.
The IRA’s indirect effect on generic markets is less discussed but potentially more consequential for long-term industry structure. The patent cliff creates revenue opportunity for generic manufacturers because brand drugs maintain high prices until patent expiry, and the generic enters at a large discount to that high baseline. If the IRA’s Medicare negotiation reduces the brand price before patent expiry, the generic’s discount to a now-lower ceiling produces lower absolute generic revenues for the same percentage discount. For first-to-file PIV challengers targeting high-value Medicare drugs, this reduction in expected revenue from a successful challenge reduces the NPV of the PIV filing decision.
Analysts at Lumanity, IQVIA, and multiple investment banks have modeled this effect. The consensus estimate is that the IRA will modestly reduce the number of PIV challenges filed against drugs in the negotiation-eligible category, because the expected 180-day exclusivity windfall is smaller when the brand price ceiling has already been negotiated down by 20-60%. The magnitude of this disincentive effect depends on how aggressively the government negotiates (maximum negotiation caps in the IRA range from 25-60% discounts to non-federal average manufacturer price), and on when in the drug lifecycle the negotiation occurs relative to the anticipated patent expiry.
The second IRA effect on generics is through the ‘inflation rebate’ provisions. If a brand manufacturer raises its Medicare drug price faster than the rate of inflation, it must pay back the excess to CMS. This provision does not apply to generics, but it does constrain the brand price escalation that historically has sustained the large price differentials that make generics financially attractive. Effectively, the IRA brakes the brand price escalation machine that has been running in the U.S. since the early 1990s.
The EU Pharmaceutical Strategy: Supply Security Over Pure Cost Minimization
The European Commission’s revised pharmaceutical legislation package, under development since 2022 and with key provisions expected to be finalized through 2024-2026, represents the most significant structural reform to EU pharmaceutical policy since the original Directive 2001/83/EC. It was motivated explicitly by the COVID-19 pandemic’s exposure of European supply chain dependencies on API and finished dose manufacturers in China and India, compounded by the structural fragility created by winner-take-all tender pricing.
The key provisions directly relevant to generic market structure include the following. First, the baseline data exclusivity period may be shortened from 8 years to 6 years, but innovators can earn back up to 4 additional years by launching in all EU member states within two years of approval (preventing the commercial non-availability of approved medicines in smaller EU markets), meeting unmet medical needs, and conducting comparative clinical studies. The net effect is a 6-to-10-year range of data exclusivity, variable by commercial behavior, compared to the current fixed 8+2+1. Generic manufacturers support shorter baseline exclusivity (faster market entry opportunity). Innovators oppose it (shorter base period regardless of behavior, earlier generic entry risk). The final text will substantially affect the timing of generic entry for drugs approved after implementation.
Second, the strategy explicitly encourages multi-winner tenders in the German and similar Ausschreibungen systems, recommending that procurement authorities require at least two or three contracted suppliers per tendered molecule to reduce single-supplier dependency risk. This is a direct policy response to the supply shortage problem described earlier and will, if implemented, somewhat reduce the extreme price pressure of pure winner-take-all tenders.
Third, the strategy introduces ‘Strategic Stock’ obligations for manufacturers of critical medicines, requiring them to maintain defined inventory buffers for drugs on a ‘critical shortage list.’ This increases working capital requirements for generic manufacturers but reduces the supply disruption risk that has repeatedly affected patient care across Europe.
The combined effect of these provisions, if implemented as proposed, will create a European generic market that is somewhat more hospitable to domestic and EU-based manufacturers, somewhat less dominated by pure-price competition, and somewhat slower in bringing generics to market (if the data exclusivity extension provisions for innovation performance are widely utilized). The supply chain security objective will likely raise the floor price for critical generic medicines in tender markets by 10-20% over time, as multi-winner procurement structures with supply security criteria moderately reduce the most extreme downward price pressure.
Investment Strategy for Institutional Analysts
This section synthesizes the preceding technical analysis into frameworks applicable to institutional investors evaluating generic pharmaceutical companies, innovator companies managing patent cliffs, and multi-sector healthcare portfolios.
Evaluating Generic Pharmaceutical Companies
The primary financial driver for a generic pharmaceutical company is the pipeline of potential PIV first-filer opportunities or, in Europe, pipeline of drugs with near-term exclusivity expiries in high-penetration markets. Analysts should model the pipeline on a risk-adjusted, drug-by-drug basis, not at the company level.
For each pipeline drug, build a decision tree that includes the probability of first-filer exclusivity (dependent on how many other companies are known to have filed competing ANDAs with PIV certifications), the expected 30-month stay duration and litigation outcome probabilities, the authorized generic risk (estimated at 70% probability for drugs with annual brand revenues exceeding $500 million), the 180-day exclusivity period revenue estimate (typically 40-60% of brand price, 50-70% of brand volume, discounted by authorized generic competition), and the post-exclusivity period revenue assuming 6+ competitors at 5-15% of brand price. Aggregate the risk-adjusted expected revenue across the pipeline to arrive at a realistic revenue forecast rather than a best-case-scenario model.
Company-level risk factors to adjust for include manufacturing quality history (FDA warning letters, consent decrees, and import alerts are severe negative signals), geographic concentration (overreliance on U.S. PIV revenue versus diversified EU tender and market access capability), and balance sheet capacity to sustain multi-year PIV litigation on multiple simultaneous cases without financially compromising manufacturing investment.
For innovator companies, the patent cliff analysis should disaggregate IP estate quality by molecule. The key metric is ‘effective commercial exclusivity duration,’ which is the time from first approval to the date when generic competition captures 80% of prescription volume. This metric is more predictive of revenue duration than the nominal patent expiry date because it accounts for secondary patent estates, PIV litigation history, and authorized generic deployment.
Molecules with a single-patent structure (compound patent only, no meaningful secondary estate) face rapid cliff dynamics: 80% generic prescription penetration typically within 12-18 months of first generic launch. Molecules with multi-layer secondary patent estates and active PIV litigation programs can delay that penetration point by 5-10 years relative to the compound patent expiry. The financial present value of that delay is the core IP asset valuation calculation.
Analysts evaluating innovator companies approaching patent cliffs should model ‘cliff scenarios’ for each drug facing exclusivity loss in the next 10 years: rapid cliff (no secondary patent protection, high PIV challenge probability), managed cliff (secondary estate providing 3-5 years of litigation-based delay), and extended exclusivity (dense secondary estate plus potential 505(b)(2) lifecycle management providing 7+ years of additional protection). Apply probability weights to each scenario based on Orange Book listing analysis, litigation history, and management disclosures. The probability-weighted expected revenue loss from patent cliffs is the correct metric for evaluating innovation replenishment requirements.
Portfolio Construction Considerations
Generic and innovator pharmaceutical equities are not simply two sides of the same coin; they often have inversely correlated drivers. A strong generic company performs best when multiple large-molecule patent cliffs produce first-filer PIV opportunities (high cliff frequency, large prize). An innovator company performs best when its secondary patent estate is strong (low cliff steepness, extended revenue duration). The correlation between these performance drivers depends on the drug category: small-molecule specialty drugs (neurology, oncology, cardiovascular) versus commoditized generics (statins, ACE inhibitors, proton pump inhibitors) have very different risk profiles.
Biosimilar-focused companies occupy a distinct space: development-stage biology company risk (complex manufacturing, regulatory uncertainty) combined with generic company commercial characteristics (price compression post-market entry, PBM negotiation exposure). The capital intensity of biosimilar development makes small-cap biosimilar-only companies structurally higher-risk than large-cap generic manufacturers with biosimilar programs embedded in diversified pipelines.
Key Takeaways by Segment
Regulatory Framework
The Hatch-Waxman Act created the world’s most competitive small-molecule generic market by prescription volume, at the cost of making patent litigation an unavoidable component of generic launch strategy. The 30-month stay, PIV certification process, and 180-day exclusivity prize together define the commercial landscape for first-mover generics in the U.S. The EU’s multi-track authorization system gives manufacturers regulatory flexibility but decouples scientific approval from commercial access, requiring a country-by-country pricing and reimbursement strategy that takes 2-4 years to fully execute across major markets.
Patent Lifecycle and Evergreening
Secondary patent estates built on formulation, salt form, method-of-use, pediatric exclusivity, device patents, and new indication approvals routinely extend effective commercial exclusivity 5-15 years beyond the compound patent expiry. Generic companies must analyze the full eight-stage evergreening architecture for each target drug, not just the Orange Book’s primary patent. IP density (Orange Book listing count, expiry distribution) is a quantifiable proxy for the litigation exposure a PIV challenger will face.
IP Valuation
The adalimumab/Humira case established that a dense secondary patent estate has jurisdiction-specific value. U.S. patent thickets create settlement leverage that can generate $10+ billion in protected revenue versus a European patent estate that buys 2-3 additional years at best against public procurement-driven biosimilar uptake. Drug-level IP valuation should disaggregate U.S. and EU exclusivity separately, using market-size-adjusted NPV methodologies that account for the probability and timing of both litigation outcomes and government price interventions.
Pricing Architecture
PBMs control approximately 80% of the U.S. commercial prescription market. Their formulary decisions, MAC list management, and spread pricing practices on generics have more day-to-day commercial impact than FDA approval status. In Europe, government HTA bodies and procurement agencies control the equivalent decisions. Understanding the specific preferences and process timelines of CVS Caremark, Express Scripts, and OptumRx in the U.S., and of CEPS, IQWiG, NICE, and AIFA in Europe, is operational knowledge that belongs on the commercial and medical affairs teams, not only in regulatory departments.
Quantitative Market Dynamics
U.S. brand drug prices average 4.22 times the OECD median; U.S. unbranded generic prices average 33% below the OECD median. Generic drugs represent 91% of U.S. prescription volume but 13% of prescription drug spending. The multi-entrant price compression curve for U.S. generics (from 94% of brand price with one entrant to 5-15% with six-plus entrants) is the core quantitative model for generic revenue projections. European generic prices vary by 10-30 times across member states for identical commoditized molecules, driven by the difference between tender-based and reference-price-based procurement mechanisms.
Biosimilars
Europe leads in biosimilar market development by 6+ years, driven by the EMA’s early regulatory framework, public procurement incentives, and absence of PBM rebate walls protecting originators. The U.S. biosimilar market has been structurally impeded by patent thickets (250+ patents around individual biologics), the BPCIA ‘patent dance’ procedural delays, and PBM formulary structures that maintain high-rebate originators over lower-cost biosimilars. The adalimumab market will be the defining test of whether U.S. market structure can close the biosimilar adoption gap with Europe or whether structural reform (including ongoing FTC investigations into PBM practices) is required first.
Policy Evolution
The Inflation Reduction Act’s Medicare price negotiation provisions will reduce the ‘patent cliff’ magnitude for selected high-value drugs by lowering the brand price ceiling against which generic discounts are applied, modestly reducing PIV challenge incentives for the specific drug categories targeted. The EU Pharmaceutical Strategy’s proposal to shorten the data exclusivity baseline while adding performance-linked extensions creates uncertainty in generic pipeline timing across Europe that will take several years to resolve. Both sets of changes move their respective markets toward each other’s model, not enough to converge the systems but enough to require regular re-assessment of launch timing strategies built on pre-IRA, pre-Strategy assumptions.
FAQ
What does a Paragraph IV certification actually do?
Filing an ANDA with a Paragraph IV certification is a statutory declaration that one or more Orange Book-listed patents covering the reference drug are invalid, unenforceable, or will not be infringed by the generic product. Under 35 U.S.C. Section 271(e)(2), the act of filing the ANDA with a PIV certification constitutes patent infringement as a matter of law, even though no generic drug has been sold yet. This ‘artificial act of infringement’ gives the brand manufacturer standing to sue for patent infringement immediately. If suit is filed within 45 days of the brand receiving PIV notice, FDA approval of the ANDA is automatically stayed for up to 30 months. The PIV filer gains 180-day marketing exclusivity if its application is ‘substantially complete’ and it is the first to file.
What is biosimilar interchangeability and why does it matter for market access?
In U.S. regulatory terminology, ‘biosimilar interchangeability’ refers to an FDA designation (under 42 U.S.C. Section 262(k)(4)) that permits pharmacists to substitute a biosimilar for the reference product without prescriber intervention, equivalent to generic substitution for small-molecule drugs. Achieving interchangeability requires a switching study demonstrating that patients alternating between the biosimilar and the reference product experience no additional safety or efficacy risk. Without interchangeability, U.S. biosimilar dispensing requires a new prescription explicitly written for the biosimilar, a significant commercial impediment. In Europe, the concept of biosimilar interchangeability as a formal regulatory designation does not exist; substitution decisions are made at the member state level and are increasingly permitted for both naive and switching patients based on the growing body of real-world evidence from transition programs.
How should generic companies model the authorized generic risk for a first-filer PIV launch?
Historical data indicates that approximately 70% of first-filer exclusivity periods for large brand drugs (annual U.S. revenues exceeding $500 million) face an authorized generic from the brand manufacturer or its partner. The financial impact of an authorized generic during the 180-day window is typically a 30-50% reduction in the first filer’s revenue versus a no-authorized-generic scenario, because the market splits between the first-filer and the authorized generic rather than the first-filer capturing near-total generic volume. Conservative models should assume authorized generic presence for any drug with brand revenues above $250 million. The brand manufacturer’s manufacturing capabilities and existing CMO relationships are observable data points for estimating authorized generic probability.
Why do generic penetration rates differ so dramatically within Europe?
Generic penetration by prescription volume ranges from over 83% in the UK to approximately 20-25% in Italy. The drivers are structural: mandatory substitution rules (whether pharmacists are required to dispense the lowest-cost available generic or merely permitted to), financial incentives for pharmacists (the UK’s Drug Tariff system lets pharmacists profit from purchasing below the reimbursement price; France’s system does not create equivalent margin), physician prescribing culture (branded generic prescribing is more common in Southern and Eastern Europe), and reference pricing structure (IRP with a high ceiling reduces price signaling below the ceiling, moderating the urgency for prescribers or patients to request generic substitution). Countries that combine mandatory substitution with pharmacist profit incentives achieve the highest penetration rates.
What is the most material near-term risk to U.S. generic supply chains?
API concentration in China and India is the primary structural vulnerability. The FDA estimates that approximately 80% of API used in U.S. generic finished dose products originates from these two countries. Geopolitical risk, quality enforcement actions (FDA import alerts, warning letters to Indian and Chinese facilities), currency fluctuations, and tariff policy (proposed pharmaceutical sector tariffs as of early 2026 would materially increase COGS for generic manufacturers relying on imported APIs) all translate directly into supply disruption risk. The drugs most vulnerable are those where one or two API manufacturers globally supply the majority of the market. Sterile injectables, antibiotics, and selected cardiovascular and CNS generics have the most concentrated supply structures and the most persistent shortage histories.
Patent status, regulatory timelines, pricing data, and policy developments require ongoing monitoring. Data cited from HHS/ASPE, AAM/IQVIA, FDA, EMA, and academic analyses reflects the most current publicly available figures at time of writing.