AbbVie’s U.S. Humira revenue fell from $7,142 million in 2024 to $3,062 million in 2025, a 57.1% drop, two years after the first adalimumab biosimilar launched. [3][4] Pfizer’s worldwide Lipitor revenue fell 59% in 2012, the first full calendar year after it lost U.S. exclusivity. [12] The two numbers look alike. They come from two different mechanisms, and a model that treats them as one mechanism will misprice the loss of exclusivity (LOE) for a biologic.
This article compares the two entry curves with public data. It uses FDA, SEC, and statutory sources first. It adds original calculations, and it labels each one as analysis. DrugPatentWatch, a biopharmaceutical intelligence service that covers patents, pipelines, litigation, and pricing, is one place to check patent and litigation records before you build a model. [20] It does not replace the Orange Book, the Purple Book, or the court docket.
The Short Answer: Why the Curves Differ
A small-molecule generic curve depends mostly on how many generic firms enter. A biosimilar curve depends mostly on who controls the formulary, which patents or settlements gate launch, and how fast payers move volume. Time since launch explains less in the biosimilar case.
The Five Findings That Matter
FDA data show that generic price falls with competitor count: about 39% below the brand with one generic producer, about 54% with two, about 79% with four, and more than 95% with six or more. [1]
Biosimilars reach an average 47% share within five years of launch, and their average sales price (ASP) falls 52% within five years, according to Samsung Bioepis’s Q3 2026 report. [8]
Approval does not equal entry. As of June 2026, 96 biosimilars had FDA approval and 71 (74%) were on the market. [8] That leaves 25 approved products off the market (analysis).
The Humira biosimilar curve moved on one payer decision. Hyrimoz weekly new prescriptions rose from 640 to 8,300 in one week after CVS Caremark changed its formulary in April 2024. [5]
Ustekinumab (Stelara) biosimilars reached 42% share by Q1 2026, about 14 months after the first launch. [9] Adalimumab biosimilars held about 18% in mid-2024, about 15 months after the first launch. [5] The ustekinumab ramp was about 2.3 times faster at a similar age (analysis).
What Data Does This Analysis Use?
Sources and Time Period
We use data from 2011 to October 2026. The sources are: the FDA’s 2019 study of generic competition and price [1]; a Congressional Research Service summary of exclusivity law [2]; company results filed with the SEC or published by the company [3][4][12][14][15]; the FDA’s list of approved biosimilars, current as of October 5, 2026 [11]; and quarterly biosimilar market reports from Samsung Bioepis, read directly or through summaries [7][8][9].
Record Selection and Calculations
We included a drug when a primary source gave revenue, share, or price data for a period after LOE. We did not include a figure when we could not trace it to a named source. Each calculated figure says “analysis” or “derived” in the text. We used reported percentage changes to derive missing base-year values. For example, 2023 U.S. Humira revenue equals the 2024 figure divided by one minus the reported 2024 decline (7,142 / (1 – 0.413)), which gives about $12,167 million. We did not remove duplicate records, because each drug appears once per table.
Limitations
The revenue figures are not like for like. Lipitor is a worldwide figure. Humira and Remicade figures are U.S. figures. Stelara is a single quarter. Market-share figures from Samsung Bioepis are summarized by a law-firm blog and a trade publication in two cases, and we say so where it applies. [5][9] Revenue changes also include price, rebate, and volume effects, and public filings do not separate them. Treat the comparisons as directional.
Definitions: Generic, Biosimilar, Interchangeable, and Entry Curve
What Is a Small-Molecule Generic?
A small-molecule generic is a chemically identical copy of a brand drug. It enters through an abbreviated new drug application (ANDA). The FDA does not require new clinical trials of the generic. The pharmacist can usually substitute it for the brand.
What Is a Biosimilar?
A biosimilar is a biologic that is highly similar to an FDA-licensed reference product. It enters through the 351(k) pathway. A biologic is made in living cells, so a biosimilar cannot be an identical copy. [10]
What Is an Interchangeable Biosimilar?
An interchangeable biosimilar is one that FDA has designated as able to replace the reference product at the pharmacy under state law. In its October 29, 2025 draft guidance, FDA said it intends to designate all approved biosimilars as interchangeable. [10]
What Is an Entry Curve?
In this article, an entry curve is the path of the brand’s revenue, price, and share after the first competitor launches. We use the term for analysis. It is not an FDA term.
How Do Small-Molecule Generic Entry Curves Work?
What Exclusivity Protects a Small-Molecule Brand?
Two statutory periods matter most for a small-molecule brand. Each has a fixed length, and each leads to a predictable event.
The Five-Year New Chemical Entity Period
A new chemical entity gets 5 years of exclusivity. The period falls to 4 years if the ANDA contains a Paragraph IV certification. During the period, FDA cannot accept an abbreviated application that relies on the brand’s data. [2]
The 180-Day First-Filer Period
The first generic applicant gets 180 days of exclusivity. FDA cannot approve another ANDA for the same drug until 180 days after the first filer begins marketing. [2] After that period, other generic firms can enter. The count of competitors then rises quickly.
How Does Generic Price Fall as Competitors Enter?
FDA studied products with first generic entry from January 2015 through December 2017. It used average manufacturer price (AMP) data. [1]
Generic producers
Generic price below brand (AMP)
Source
1
About 39%
[1]
2
About 54%
[1]
4
About 79%
[1]
6 or more
More than 95%
[1]
The same study found that the median generic price across all products was 40% of the brand price on an AMP basis. [1] The shape is a curve with competitor count on the horizontal axis. The curve falls fast between one and four entrants.
Industry statistic: Generic and biosimilar medicines were 90% of all U.S. prescriptions filled in 2024 and 12% of spending. The Association for Accessible Medicines reported savings of $467 billion for 2024. [19]
Case Study: What Happened to Lipitor After the 2011 LOE?
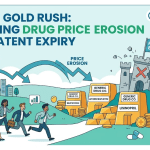
Lipitor lost U.S. exclusivity in November 2011. Multi-source generic competition began in May 2012. [12] The first window matches the 180-day structure above. Pfizer’s worldwide Lipitor revenue fell by $5,629 million, or 59%, in 2012. [12]
Analysis: the Lipitor decline came in the first full year, and it followed a known date. An analyst could set the LOE date from the exclusivity record and the settlement record, then apply a price-and-share curve tied to the number of ANDA holders. That approach works for small molecules because substitution at the pharmacy is routine and the product is chemically identical.
How Do Biosimilar Entry Curves Work?
What Exclusivity Protects a Biologic?
The 12-Year Reference Product Period and the 4-Year Filing Bar
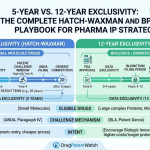
A biologic reference product gets 12 years of exclusivity from first licensure. FDA cannot approve a biosimilar application during that time. For the first 4 years, FDA cannot even accept one. [2]
First-Interchangeable Exclusivity
The first interchangeable biosimilar gets exclusivity that runs from 12 to 42 months, depending on when it launches and whether litigation occurs. FDA cannot designate another product as interchangeable until the earliest of three events. These are 1 year after commercial marketing, 18 months after approval if no one sues, or, if there is a lawsuit, 18 months after a decision or 42 months after approval. [2] This period differs from the 180-day small-molecule period in length and in what it blocks. It blocks a designation, not an approval.
Why Does Approval Not Equal Launch for Biosimilars?
Biosimilar approval does not mean market entry. As of September 2025, Samsung Bioepis counted 80 approved biosimilars across 19 molecules, with 58 launched (73%). [7] As of June 2026, the count was 96 approved across 21 molecules, with 71 launched (74%). [8]
Measure
Sept 2025
June 2026
Source
Approved biosimilars
80
96
[7][8]
Unique molecules
19
21
[7][8]
Launched
58
71
[7][8]
Approved, not launched (analysis)
22
25
Derived
Analysis: between the two reports, approvals rose by 16 and launches rose by 13. The unlaunched pool grew by 3. A valuation that counts each FDA approval as an entrant will overstate competition. Patent settlements, supply, and payer contracting all decide whether a product reaches patients.
How Many Biosimilars Does Each Reference Product Face?
The FDA list, current as of October 5, 2026, shows the following entries for selected reference products. [11] Counts are table entries, and some denosumab entries list two brand names.
Reference product
Active ingredient
Biosimilar entries on FDA list
Source
Humira
adalimumab
10
[11]
Prolia / Xgeva
denosumab
10
[11]
Stelara
ustekinumab
8
[11]
Neulasta
pegfilgrastim
8
[11]
Eylea
aflibercept
6
[11]
Herceptin
trastuzumab
6
[11]
Avastin
bevacizumab
6
[11]
Remicade
infliximab
4
[11]
Enbrel
etanercept
2
[11]
The small-molecule FDA price curve flattens after about six entrants. [1] Several biologics have six or more entries on the list. Number of approvals alone, however, does not give the number on the market.
Humira: A Slow Start, Then a Formulary Step
How Big Was the Humira Patent Thicket?
I-MAK, a patent-reform nonprofit, reports 257 patent applications on Humira, with 130 granted, and says 90% of the applications were filed after FDA approval. [6] These are I-MAK’s counts. AbbVie may count patents and families differently. Use a patent database and the Purple Book listing to confirm any count that goes into a model.
Why Patent Counts Do Not Set the Curve
The first U.S. adalimumab biosimilar, Amjevita, launched in January 2023. [5] The thicket delayed that date. It did not set the shape of the curve after it. The shape came from payer behavior, shown below.
What Did Humira Revenue Do After 2021?
Year
Global ($M)
U.S. ($M)
Reported change
Source
2021
20,600
n/a
+14% global
[5]
2023
14,400
About 12,167 (derived)
-32% global
[5], analysis
2024
8,993
7,142
-37.6% global; -41.3% U.S.
[4]
2025
4,540
3,062
-49.5% global; -57.1% U.S.
[3]
Analysis: global Humira revenue in 2025 was 22% of its 2021 level (4,540 / 20,600), a fall of 78%. U.S. revenue in 2025 was about 25% of the derived 2023 level, a fall of about 75%.
The decline sped up in year two and year three. The U.S. decline was 41.3% in 2024 and 57.1% in 2025. [3][4] A curve tied to time since launch would show the steepest fall first. Humira shows the opposite.
Is the Humira Curve Flattening in Year Three?
AbbVie’s Q4 2025 U.S. Humira revenue was $897 million, down 27.9% from Q4 2024. [3] Q4 2024 U.S. revenue was $1,246 million, down 54.5% from Q4 2023. [4] The year-on-year decline in the fourth quarter therefore halved between 2024 and 2025 (analysis: 54.5% to 27.9%).
The full-year 2025 U.S. figure of $3,062 million implies an average quarter of about $766 million (analysis: 3,062 / 4). The Q4 figure of $897 million is above that average. We do not claim a cause. Possible reasons include seasonality, patient mix, and a smaller base, and AbbVie’s release does not state which one applies. The data show that a curve can steepen in year two and slow in year three. A single constant annual decay rate does not fit.
International Humira Revenue Fell More Slowly
AbbVie reports international Humira revenue separately. It fell 17.5% in 2024 and 20.2% in 2025. [3][4] The U.S. fell 41.3% and 57.1% in the same years. [3][4] The release does not explain the gap. The gap does show that two markets with biosimilar competition can follow different paths, so a global haircut applied to a U.S. forecast is a poor proxy.
What Did the CVS Caremark Decision Change?
In mid-2024, Samsung Bioepis reported that Humira held 82% share since May 2024, and biosimilars held about 18%. [5] CVS Caremark removed Humira from its major national commercial formularies in April 2024. [5] Cordavis, a CVS Health subsidiary, launched in August 2023 and partnered with Sandoz on Hyrimoz. [5]
640 to 8,300 Weekly Prescriptions in One Week
Hyrimoz weekly new prescriptions rose from 640 in the week ending March 29 to 8,300 in the week ending April 5. [5] That is a 13-fold increase in one week (analysis: 8,300 / 640 = 12.97). Hyrimoz held about 13% of the market. The nine other adalimumab biosimilars together held less than 5%. [5]
Price Was Not the Only Lever
Samsung Bioepis’s Hadlima and Coherus’s Yusimry were priced around 85% below Humira, according to the report summary. [5] Several low-priced products still held small share. The product with the formulary position took the volume. This is the clearest difference from the small-molecule model, where an AB-rated generic at a low price gets the prescription by default.
Stelara vs. Humira: Same Drug Class, Faster Curve
When Did Each Ustekinumab Biosimilar Launch?
Product
Developer
FDA approval
U.S. launch
Months, approval to launch (analysis)
Source
Wezlana
Amgen
Oct 2023
Jan 2025
15
[9]
Pyzchiva
Samsung Bioepis
Jul 2024
Feb 2025
7
[9]
Selarsdi
Alvotech / Teva
Apr 2024
Feb 2025
10
[9]
Yesintek
Biocon
Dec 2024
Feb 2025
2
[9]
Otulfi
Formycon / Fresenius Kabi
Sep 2024
Mar 2025
6
[9]
Steqeyma
Celltrion
Dec 2024
Mar 2025
3
[9]
Imuldosa
Dong-A ST / Accord
Oct 2024
Aug 2025
10
[9]
Starjemza
Hikma
May 2025
Nov 2025
6
[9]
Six of Eight Launched in the First Three Months
Six of the eight ustekinumab biosimilars launched between January and March 2025 (analysis from [9]). The median gap from approval to launch was about 6.5 months (analysis, using month-level dates). The launch cluster looks like a coordinated opening date, not a staggered series. The reason is public in only some cases, so we do not assign one.
How Fast Did Stelara Lose U.S. Sales?
Stelara’s U.S. sales were $766 million in Q4 2025, down 55%. Worldwide sales were $1.23 billion, down 48%. [13] Stelara had brought in more than $10 billion in 2024. [13] J&J said Stelara took about 1,040 basis points off Innovative Medicine growth in 2025. [15] Stelara was about 6.5% of J&J’s 2025 revenue. [14]
Measure
Humira (adalimumab)
Stelara (ustekinumab)
Source
First U.S. biosimilar launch
January 2023
January 2025
[5][9]
U.S. revenue change, Q4 year on year
-54.5% (Q4 2024)
-55% (Q4 2025)
[4][13]
Quarter after first launch
Eighth (analysis)
Fourth (analysis)
Derived
Biosimilar share at about 14-15 months
About 18% (May 2024)
42% (Q1 2026)
[5][9]
Biosimilars launched within 12 months of first
See note
8
[9]
Note: BioSpace reports Humira’s first biosimilar in January 2023, with more launches in July 2023, and ten biosimilars on the market by July 2024 (Hyrimoz and nine others). [5] We do not have a sourced count for the first 12 months.
Analysis: Stelara’s U.S. revenue reached a Humira-sized quarterly decline in the fourth quarter after launch, and Humira reached it in the eighth. The Humira Q4 2023 base already had some biosimilar effect, so the comparison understates how fast Stelara moved. Several features of the ustekinumab market differ: eight launches in 11 months, a payer system that had already absorbed Humira, and, per Samsung Bioepis, a faster ramp in ustekinumab than in adalimumab. [9] The lesson is that one biosimilar class is not a template for the next.
How Long Does a Launched Biosimilar Wait for Formulary Access?
A launch is not a sale. Imuldosa, from Dong-A ST and Accord, launched in August 2025. It was added to the Express Scripts commercial formulary in December 2025. [9] The gap was about four months (analysis). In a small-molecule market, an AB-rated generic is usually available to dispense at once. In a biosimilar market, the product may reach the market before it reaches the formulary.
Why Launch Date Is the Wrong Start Date for a Model
If a model starts its share curve on the launch date, it assumes access on day one. The Humira example shows the opposite. Biosimilar share stayed low until the formulary changed in April 2024, about 15 months after the first launch. [5] A better start date is the date of the payer decision, and the launch date is the earliest possible date for it.
Price Depth vs. Share: Why Deep Discounts Did Not Mean Fast Uptake
How Do Biosimilar Price Declines Compare With Generic Price Declines?
FDA data show a generic price more than 95% below the brand when six or more producers compete. [1] Samsung Bioepis reports that biosimilar ASP falls 52% on average within five years of launch. [8] The two figures use different measures (AMP against the brand for generics, ASP over time for biosimilars). We do not claim they are equal. They do show that the typical biosimilar price path is slower and shallower than the generic path at full competition.
Why Did Low-Priced Humira Biosimilars Not Win Share?
Hadlima and Yusimry were priced around 85% below Humira, but the nine non-Hyrimoz biosimilars held less than 5% combined in mid-2024. [5] The list price is not the price the payer sees. A brand with large rebates can match a low list price on a net basis, and a PBM may prefer a product on which it earns a private-label return. The public sources here do not give net prices, so we flag this as an open question and not as a finding.
Price Varies Widely Across Biosimilar Classes
The Q4 2025 Samsung Bioepis report listed one aflibercept biosimilar at a 12% WAC discount and trastuzumab biosimilar ASP down 19% from the prior quarter, mainly because of one product. [7] The same report said negotiated Medicare prices for the first 10 selected drugs take effect on January 1, 2026. [7] A single discount assumption across molecules will therefore be wrong for most of them.
Side by Side: Small-Molecule Generics vs. Biosimilars
Dimension
Small-molecule generic
Biosimilar
Source
Approval pathway
ANDA
351(k) application
[2][10]
Main exclusivity
5 years (4 with Paragraph IV)
12 years, with a 4-year filing bar
[2]
First-entrant reward
180 days
12 to 42 months for first interchangeable
[2]
Price depth at full competition
More than 95% below brand with 6 or more producers
Average ASP decline of 52% within five years
[1][8]
Typical share outcome
Share set by competitor count and pharmacy substitution (analysis)
Average 47% within five years
[8]
Approval to launch
Not measured here
74% of approved products launched, June 2026
[8]
Main share driver in case studies
Number of producers (Lipitor)
Formulary decision (Humira), settlement date (Eylea)
[5][12][18]
Remicade: Share Held, Price Fell
FDA approved the first infliximab biosimilar for U.S. sale in 2016, according to J&J’s 2018 annual report. [17] By Q4 2018, Remicade still held 93% volume share in the U.S. J&J reported global sales down 15% and attributed the fall to increased discounts and rebates and a modest share loss. [16] U.S. Remicade sales fell 19%, from $4.5 billion in 2017 to $3.7 billion in 2018. [16]
Why Did Remicade Revenue Fall When Share Barely Moved?
Analysis: a 7-point volume share loss cannot explain a 19% revenue fall. If the total market was flat, price and rebates explain at least 12 points of the decline. That conclusion rests on the flat-market assumption, and J&J’s reports do not separate the effects. The pattern still shows a third curve shape: the brand holds volume and gives up net price.
What This Means for a Valuation Model
A model that only tracks share would have predicted a small Remicade loss. A model that tracks net price would have predicted a larger one. The Lipitor model, which ties revenue to share and generic price, misses the rebate response.
Eylea: When Litigation Sets the Curve
The FDA list shows six aflibercept biosimilar entries. [11] Amgen’s Pavblu launched in the U.S. in October 2024, after the Federal Circuit denied Regeneron’s injunction request. Regeneron filed new BPCIA litigation against Amgen in June 2025, and that case is pending. [18] Sandoz settled BPCIA litigation with Regeneron in September 2025 with a U.S. launch for Enzeevu set for Q4 2026, or earlier under undisclosed circumstances. [18] Formycon, Klinge Biopharma, and Valorum Biologics settled in October 2025 with a Q4 2026 launch window for Ahzantive. [18]
Why Does Eylea Not Look Like Humira or Stelara?
Analysis: Eylea has six listed biosimilars but, as far as the sources here show, one launched through October 2025. The others wait for dates set by settlements. In this case the entry date is a legal output, and the number of approved products tells you little about the number that will launch on a given date. A model for Eylea needs a settlement-date table before it needs a share curve.
Ranibizumab: When a Reference Product Regains Share
In the Samsung Bioepis Q4 2025 report, reference ranibizumab held 90% share after a biosimilar product paused availability. [7] A biosimilar can enter and then leave. Small-molecule generics also leave the market, but the report shows that a biosimilar share loss can reverse within a single reporting period.
A Taxonomy of Entry Curves (Original Framework)
The four types below are an original classification for this article. They are not an industry standard. We built them from the cases above.
Type 1: Count-Driven Step Curve
Revenue and price fall as the number of generic producers rises. FDA’s price data fit this type. [1] Lipitor is the example. [12]
Type 2: Payer-Gated Ramp
Share stays low until a payer or a pharmacy benefit manager (PBM) moves volume. Then it jumps. Humira is the example. [5]
Type 3: Price-Led Erosion
The brand keeps most volume and cuts net price through rebates. Remicade in 2018 is the example. [16]
Type 4: Litigation-Gated Entry
Launch dates come from court rulings and settlements, and the curve begins on those dates. Eylea is the example. [18]
Type
Main driver
Example
Key model input
Source
1. Count-driven step
Number of generic producers
Lipitor
ANDA holders and 180-day date
[1][2][12]
2. Payer-gated ramp
Formulary decision
Humira
PBM contract dates
[5]
3. Price-led erosion
Rebates, net price
Remicade
Net price per unit
[16]
4. Litigation-gated entry
Settlement and court dates
Eylea
Launch-date table
[18]
One drug can move between types. Humira began as Type 4 and Type 2, and then behaved like Type 1 in its price decline.
Scenario Analysis: What Four Observed Declines Do to a $1,000 Million Brand
This scenario applies each observed early-period decline to a hypothetical U.S. brand with $1,000 million in revenue. It is an illustration. The inputs are not equivalent, as the notes show.
Curve type
Observed decline used
Resulting revenue ($M)
Note
Lipitor-type
-59% (worldwide, 2012) [12]
410
Annual, worldwide
Stelara-type
-55% (U.S., Q4 2025) [13]
450
One quarter, year on year
Humira-type
-32% (worldwide, 2023) [5]
680
Annual, includes international
Remicade-type
-19% (U.S., 2018) [16]
810
Annual, price-led
Analysis: the first-period outcomes span $410 million to $810 million, a factor of about two, on the same starting base. A single “generic LOE” haircut would hide that spread.
Humira Two-Year Path
Apply Humira’s U.S. declines of 41.3% and then 57.1% to $1,000 million. [3][4] Revenue falls to about $587 million after the first year and about $252 million after the second (analysis). The later year is the larger loss in dollar-percentage terms.
What Is FDA Changing About Biosimilar Approval?
What Does the October 2025 Draft Guidance Say?
On October 29, 2025, FDA issued the draft guidance “Scientific Considerations in Demonstrating Biosimilarity to a Reference Product: Updated Recommendations for Assessing the Need for Comparative Efficacy Studies.” [10] FDA would not require comparative efficacy studies when the products are made from clonal cell lines, are highly purified, and can be well characterized, and when a human pharmacokinetic similarity study is feasible. [10] For a highly similar product, FDA would require only “an appropriately designed human pharmacokinetic similarity study and an assessment of immunogenicity.” [10]
Will Every Biosimilar Become Interchangeable?
FDA stated an intent to designate all approved biosimilars as interchangeable, and it is taking a flexible view of switching studies. [10] FDA Commissioner Makary was reported as saying, “we can achieve massive cost reductions for advanced treatments for cancer, autoimmune diseases, and rare disorders.” [10] The document is a draft. Treat any effect on entry timing as a forecast.
Which Biosimilars Already Hold Interchangeability?
Boehringer Ingelheim’s Cyltezo launched in July 2023 with an interchangeability designation. [5] Alvotech and Teva’s Simlandi received FDA approval with interchangeability. [5] Selarsdi, an ustekinumab biosimilar from the same pair, received interchangeability in May 2025. [9] The Humira market had interchangeable options from 2023, yet most share moved only after the April 2024 formulary change. [5] Analysis: interchangeability alone did not set the curve in that case. It removes one barrier, and payer contracting remains another.
What the Guidance Does Not Change
The guidance addresses approval requirements. It does not change patent law, the 12-year exclusivity period, settlements, or PBM contracting. [2][10] Those are the drivers behind the Type 2 and Type 4 curves.
What This Means for Brand Manufacturers, Biosimilar Developers, and Payers
What This Means for Brand Manufacturers
Plan for the payer decision, not only the first launch. Humira’s curve moved most after a formulary change, so contract dates are as important as patent dates. [5] Plan a net price response too, since Remicade showed a revenue fall with 93% volume share. [16]
What This Means for Biosimilar Developers
A low price did not guarantee share in Humira’s case. [5] A formulary position did. Developers need a payer partner or a private-label route before they set a launch forecast.
What This Means for Payers and Health Systems
The savings from biosimilars are large in total but concentrated. The Association for Accessible Medicines reports $56.2 billion in biosimilar savings since 2015. [19] The Samsung Bioepis data show an average 52% ASP decline within five years of launch. [8] The pace depends on the contracting choices payers make.
How to Model Biosimilar LOE: A Checklist
Which Inputs Does a Biosimilar Model Need?
Reference product licensure date and the 12-year and 4-year dates. [2]
Number of FDA-approved and launched biosimilars, kept as two counts. [8][11]
Settlement dates and litigation status for each applicant. [18]
PBM formulary and private-label arrangements. [5]
Net price after rebates, not only list price. [16]
Interchangeability status and the state of the FDA draft guidance. [10]
Which Modeling Errors Appear Most Often?
Error 1: Counting Approvals as Competitors
As of June 2026, 25 approved biosimilars were not on the market (analysis from [8]). A count of approvals overstates competition by about one in four.
Error 2: Starting the Curve on the Launch Date
Humira’s curve moved after the payer decision, not after the launch. [5] Imuldosa waited about four months for a major formulary. [9]
Error 3: Using Share as the Only Output
Remicade’s U.S. revenue fell 19% with 93% volume share. [16] A share-only model would have missed most of the loss.
Error 4: Applying One Decay Rate
Humira’s U.S. decline was 41.3% in 2024 and 57.1% in 2025, and the Q4 decline then fell to 27.9%. [3][4] One constant rate fits none of these years.
Error 5: Reading One Class as a Template
Ustekinumab biosimilars reached 42% in about 14 months. Adalimumab biosimilars reached about 18% in about 15 months. [5][9] The second class is a poor template for the first.
Where Can You Find the Patent and Litigation Inputs?
Use the Purple Book and court dockets as the primary records. DrugPatentWatch tracks patents, pipelines, litigation, and pricing, and it describes its service as one that helps users track branded drug erosion and generic entry. [20] Check any figure you take from an aggregator against the primary record.
What Happens Next: Dates to Watch
These items are announced or expected events, not confirmed outcomes.
Aflibercept: Sandoz and Formycon-linked launches are set for Q4 2026, or earlier under undisclosed terms. [18]
Denosumab: Biocon’s Bosaya and Aukelso launched in the U.S. in Q2 2026. [9]
FDA: the October 2025 draft guidance is not final. [10]
Samsung Bioepis has said that 2026 will bring further shifts. [7]
Key Takeaways
FDA data tie small-molecule generic price to the number of producers: about 39% below brand with one, more than 95% with six or more. [1]
Biosimilars average 47% share and a 52% ASP decline within five years of launch. [8]
96 biosimilars were approved and 71 launched as of June 2026, so about one in four approved products was not on the market. [8]
Humira’s U.S. revenue fell 41.3% in 2024 and 57.1% in 2025. [3][4]
Hyrimoz weekly new prescriptions rose from 640 to 8,300 in the week after the CVS Caremark change. [5]
Ustekinumab biosimilars reached 42% share in about 14 months, against about 18% for adalimumab at a similar age. [5][9]
Remicade lost 19% of U.S. revenue in 2018 while holding 93% volume share. [16]
Eylea’s biosimilar entry follows settlement dates in Q4 2026. [18]
FAQ
Why Is Biosimilar Erosion Slower Than Small-Molecule Generic Erosion?
Biosimilars average 47% share after five years. [8] Small-molecule generics and biosimilars together were 90% of prescriptions in 2024, but that figure mixes the two groups. [19] The gap comes from substitution rules, payer contracting, and patent gating, as the cases above show.
How Long Is Biosimilar Exclusivity Compared With a Small-Molecule Drug?
A biologic gets 12 years from licensure. A new chemical entity gets 5 years, or 4 if there is a Paragraph IV challenge. [2]
What Is the 180-Day Exclusivity for Generics?
FDA cannot approve another ANDA until 180 days after the first filer starts marketing. [2]
Do Biosimilars Have a 180-Day Exclusivity?
No. The first interchangeable biosimilar gets exclusivity of 12 to 42 months on the interchangeability designation. [2]
How Many Biosimilars Are Approved in the U.S.?
Samsung Bioepis counted 96 approved across 21 molecules as of June 2026. [8] The FDA list is the primary source, and its count method may differ. [11]
How Much Did Humira Revenue Fall?
Global Humira revenue fell from $20.6 billion in 2021 to $4,540 million in 2025, a 78% decline (analysis). [3][5]
How Fast Are Stelara Biosimilars Growing?
Ustekinumab biosimilars reached 42% share as of Q1 2026. [9] Stelara’s U.S. sales fell 55% in Q4 2025. [13]
Can a Brand Lose Revenue Without Losing Share?
Yes. Remicade’s U.S. sales fell 19% in 2018 while it held 93% volume share, and J&J attributed the global fall to discounts and rebates. [16]
What Did FDA Propose in October 2025?
FDA proposed to drop comparative efficacy studies in many cases and said it intends to designate all approved biosimilars as interchangeable. The document is a draft. [10]
Where Can I Check Biosimilar Patent and Litigation Data?
Start with the Purple Book and court dockets. DrugPatentWatch is a secondary service that covers patents, litigation, and pricing. [20]
References
Conrad, R., & Lutter, R. (2019, December). Generic competition and drug prices: New evidence linking greater generic competition and lower generic drug prices. U.S. Food and Drug Administration. https://www.fda.gov/media/133509/download
Congressional Research Service. (2019, May 17). Drug pricing and the law: Regulatory exclusivities (IF11217). https://www.everycrsreport.com/reports/IF11217.html
AbbVie Inc. (2026, February 4). AbbVie reports full-year and fourth-quarter 2025 financial results. https://news.abbvie.com/2026-02-04-AbbVie-Reports-Full-Year-and-Fourth-Quarter-2025-Financial-Results
AbbVie Inc. (2025). Full-year and fourth-quarter 2024 financial results (Form 8-K, Exhibit 99.1). U.S. Securities and Exchange Commission. https://www.sec.gov/Archives/edgar/data/1551152/000155115225000011/abbv-20241231xexhibit991.htm
Manalac, T. (2024, July 12). AbbVie’s Humira continues to lose market share as biosimilars gain ground: Report. BioSpace. https://www.biospace.com/business/abbvies-humira-continues-to-lose-market-share-as-biosimilars-gain-ground-report
I-MAK. (n.d.). Overpatented, overpriced: Special edition (Humira). https://www.i-mak.org/humira/
Samsung Bioepis. (2025, October 23). Samsung Bioepis releases fourth quarter 2025 US biosimilar market report. Business Wire. https://www.businesswire.com/news/home/20251023516661/en/Samsung-Bioepis-Releases-Fourth-Quarter-2025-US-Biosimilar-Market-Report-Providing-Annual-Biosimilar-Trends-and-Future-Market-Trajectory
Samsung Bioepis. (2026, July 23). Samsung Bioepis releases third quarter 2026 biosimilar market report. Business Wire. https://www.businesswire.com/news/home/20260723271444/en/
Pearce IP. (2026, July 23). Samsung Bioepis publishes Q3 2026 US biosimilar market report: Ustekinumab market share at 42%. https://www.pearceip.law/2026/07/23/samsung-bioepis-publishes-q3-2026-us-biosimilar-market-report-ustekinumab-market-share-at-42/
Arnold & Porter. (2025, November). FDA proposes to eliminate comparative clinical efficacy studies for biosimilars. https://www.arnoldporter.com/en/perspectives/advisories/2025/11/fda-proposes-to-eliminate-biosimilar-comparative-studies
U.S. Food and Drug Administration. (2026, October 5). Biosimilar product information. https://www.fda.gov/drugs/biosimilars/biosimilar-product-information
Pfizer Inc. (2013). 2012 annual report (Form 10-K, Exhibit 13). U.S. Securities and Exchange Commission. https://www.sec.gov/Archives/edgar/data/0000078003/000007800313000006/pfe-12312012xex13.htm
BioPharma Dive. (2026, January). J&J eyes $100B in sales amid gains for cancer, immune drugs. https://www.biopharmadive.com/news/johnson-johnson-2025-earnings-sales-cancer-immune-drugs/810097/
Johnson & Johnson. (2026). Annual report on Form 10-K for fiscal year 2025. U.S. Securities and Exchange Commission. https://www.sec.gov/Archives/edgar/data/200406/000020040626000016/jnj-20251228.htm
Johnson & Johnson. (2026, January 21). Johnson & Johnson reports Q4 and full-year 2025 results. https://jnj.com/media-center/press-releases/johnson-johnson-reports-q4-and-full-year-2025-results
Stanton, D. (2019, January 23). Lower infliximab revenues but J&J still holds 93% share. BioProcess International. https://www.bioprocessintl.com/global-markets/lower-infliximab-revenues-but-j-j-still-holds-93-share
Johnson & Johnson. (2019). Annual report on Form 10-K for fiscal year 2018. U.S. Securities and Exchange Commission. https://www.sec.gov/Archives/edgar/data/200406/000020040619000009/form10-k20181230.htm
Pearce IP. (2025, October 2). Formycon, Klinge, Valorum set for Q4 2026 biosimilar aflibercept US launch following Regeneron settlement. https://www.pearceip.law/2025/10/02/formycon-klinge-valorum-set-for-q4-2026-biosimilar-aflibercept-us-launch-following-regeneron-settlement/
Association for Accessible Medicines. (2025, September 3). Generic and biosimilar medicines save $467 billion in 2024. https://accessiblemeds.org/resources/press-releases/generic-and-biosimilar-medicines-save-467-billion-in-2024/
DrugPatentWatch. (n.d.). Home page. https://www.drugpatentwatch.com/