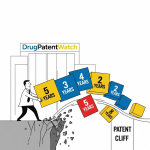
Bristol Myers Squibb reported $12,821 million in worldwide Revlimid revenue for 2021 [1]. It reported $2,951 million for 2025 [3]. That is a 77% decline (analysis, calculated from the two reported figures). The decline did not arrive in one step. Year over year, Revlimid revenue fell 22.2% in 2022, 38.9% in 2023, 5.3% in 2024 and 48.9% in 2025 (analysis, calculated from reported revenue [1][2][3]). A forecast with one generic-entry date cannot produce that sequence.
This article tests the single-event assumption against six real products: Revlimid, Humira, Lipitor, Entresto, Eliquis and Xarelto. It then runs one worked DCF scenario to show how large the error becomes when an analyst puts the cliff in the wrong year. The scenario uses stated, illustrative assumptions. It is not a valuation of any company.
The Short Answer: Why a Single Entry Date Gives the Wrong Value
A DCF that models generic entry as one event assumes that brand revenue drops to a low floor in one year. Real entry is staged by challenger, by strength, by country and by contract term. The revenue path that results has several slopes, and the slopes depend on dates that settlements and court rulings set one challenger at a time.
In the worked scenario below, the same $10,000 million revenue base produces a four-year post-entry cash-flow value of $1,389 million under a year-1 cliff, $10,896 million under a year-4 cliff, and $6,620 million under a path shaped like the reported Revlimid decline. The choice of cliff date moves the answer by a factor of almost eight. Moving the discount rate from 6% to 10% changes the same values by less than 8% (analysis, assumptions and calculations in the scenario section).
The Findings That Matter
The findings below are the numbers this article relies on. Each one has a source or is marked as calculated analysis.
Finding 1: Revlimid revenue fell in four unequal steps
Revlimid worldwide revenue was $12,821 million in 2021 and $9,978 million in 2022 [1]. It was $6,097 million in 2023 [2]. It was $5,773 million in 2024 and $2,951 million in 2025 [3]. The year-over-year changes are -22.2%, -38.9%, -5.3% and -48.9% (analysis).
Finding 2: Revlimid generic entry took 1,426 days from first license to no volume limit
Teva launched generic Revlimid on March 7, 2022 under a limited-volume deal [6]. BMS states that licensed generics sell without volume limitation beginning January 31, 2026 [4]. The span between the two dates is 1,426 days, or 3.9 years (analysis).
Finding 3: Humira US net revenue fell 34.7% and then 41.3%
AbbVie reported US Humira net revenue of $12,160 million for 2023, down 34.7% [7]. It reported $7,142 million for 2024, down 41.3% [8]. The first biosimilar launched in January 2023 and seven more launched over the July 4 weekend of 2023 [9].
Finding 4: Lipitor had a six-month gap between first generic and multi-source competition
Ranbaxy held a license to sell generic Lipitor from November 30, 2011, with 180 days of US marketing exclusivity [13]. Pfizer states that multi-source generic competition began in May 2012 [12]. Lipitor revenue fell $5,629 million, or 59%, in 2012 [12].
Finding 5: Entresto went from flat to down 45% in one quarter
Novartis reported Entresto sales down 1% in the third quarter of 2025 [16] and down 45% in the fourth quarter, to about $1.2 billion [15]. The first US generics launched on July 22 and July 24, 2025 [14].
Finding 6: Eliquis has different earliest-entry dates in different regions
BMS lists an estimated minimum market exclusivity date of 2028 for Eliquis in the United States and 2026 in Japan [5]. The US date of April 1, 2028 came from the Federal Circuit ruling of September 2021 [17]. The 2028 US date sits 6.6 years after the September 2021 ruling and two years after the Japan date (analysis).
Finding 7: FDA data show prices fall further with each added generic producer
In an FDA sample of 181 products, the median generic price (average manufacturer price basis) was 39% below the pre-entry brand price with one generic producer, 54% below with two, and 79% below with four [20].
Methodology and Definitions
What data does this article use?
Revenue figures come from company filings and company earnings releases for Bristol Myers Squibb, AbbVie, Pfizer and Novartis. Entry dates come from company filings, company press releases and the Optum RxNews new-generics notices. Price-competition figures come from an FDA report. Statutory mechanics come from FDA documents on 180-day exclusivity and the 30-month stay.
How were the calculations done?
Year-over-year changes divide one reported annual figure by the prior reported figure. Day counts use calendar dates. Where a figure is calculated, the text says “analysis.” The worked scenario is a transparent model, and a reader can reproduce it with the assumptions in the scenario tables. The 2022 US Humira figure of about $18,622 million is calculated by dividing the reported 2023 figure of $12,160 million by one minus the reported 34.7% decline (analysis). A secondary source also states that 2022 US Humira sales exceeded $18.6 billion [9].
What are the limits of the analysis?
Annual revenue changes include effects other than generic entry, such as price changes, rebate changes, demand shifts and competing branded drugs. This article does not assign each revenue change to one cause. The filings it cites state the licensing terms, and the revenue numbers are what the companies reported. The worked scenario uses assumed margins and discount rates. It shows the direction and rough size of a modeling error, not the value of any product.
Definitions used in this article
Single-event model: a forecast in which brand revenue steps down to a low floor once, at one date.
Staggered model: a forecast in which revenue falls in several steps tied to separate entry dates, strengths, regions or volume limits.
Loss of exclusivity (LOE): the date after which a brand faces generic or biosimilar competition.
First applicant: an ANDA filer eligible for 180-day exclusivity under the statute [21].
What Is a Single-Event Generic Entry Model?
A single-event model has one input for generic entry: a date. Before the date, the model carries brand revenue at its forecast level. After the date, it applies one erosion curve, often a large first-year drop followed by smaller drops. The model then discounts the resulting cash flows.
Where does the single date usually come from?
The date often comes from a patent list or from the earliest known settlement date. Sometimes it comes from a company statement. Each source answers a narrower question than the model asks. A patent expiry answers when a patent ends. A settlement date answers when one challenger may launch. The model needs to know when the brand’s revenue falls and by how much.
Why does the single-date shortcut survive?
It is simple. One date fits in one spreadsheet cell, and one erosion curve fits in one row. It also reflects the way many first-generation forecasts were written, when many small-molecule brands faced a short run of entrants. The shortcut becomes a problem when the contract and litigation structure around a product produces several dates.
Why Does Generic Entry Arrive in Stages?
Generic entry arrives in stages because the rules and the contracts that govern it assign different dates and quantities to different challengers. Five mechanisms matter most.
How does 180-day exclusivity create a two-stage market?
FDA describes the 180-day marketing protection as commonly known as 180-day exclusivity [21]. FDA states that exclusivity begins to run, independent of approval, with commercial marketing of the drug product [21]. A statute-based letter to a sponsor states that commercial marketing by any first applicant begins the running of the 180-day period [22]. FDA also states that applicants who submit on the same first day all qualify as first applicants [21].
What this means for the model
The first 180 days can have one or a few generic sellers. After that period, other approved filers can enter. The Lipitor case shows the result. Ranbaxy had 180 days of exclusivity from November 30, 2011 [13]. If the period started at launch, the 180-day point falls on May 28, 2012 (analysis). Pfizer reports that multi-source competition began in May 2012 [12]. The two dates line up.
How do the 30-month stay and litigation outcomes sort filers by date?
FDA states that approval of an ANDA generally stays for 30 months from receipt of the patent notice [22]. Courts then decide patent disputes at different times for different filers. A filer that wins early can launch early. A filer that loses waits for the patent or for a settlement date. The brand therefore faces a calendar of entry dates, not one date.
What this means for the model
Each filer has its own approval status, its own court schedule and its own risk of loss. A single date compresses all of that into one assumption. A staggered model lists each filer and assigns a probability and a date to each.
How do settlements assign dates, quantities and conditions?
Settlements turn litigation outcomes into contract terms. In the Revlimid case, BMS states that Natco received a volume-limited license to sell generic lenalidomide in the United States from March 2022, and that Natco and other generic companies received licenses without volume limitation from January 31, 2026 [4]. Optum RxNews reported that Teva could make only a mid-single-digit percentage of monthly Revlimid volume at first, with its permitted share rising to 33% of volume by March 2025 [6].
What this means for the model
A volume cap is a revenue input. A model that sets generic entry to “on” at the first license date overstates early loss. A model that sets entry to “on” at the unrestricted date overstates early revenue.
How does entry by strength and presentation split one brand into several products?
Lupin launched generic rivaroxaban 2.5 mg tablets on March 7, 2025. Its release names Janssen’s Xarelto 2.5 mg tablets as the reference product, with estimated annual US sales of $446 million (IQVIA MAT January 2025) [18]. The Optum RxNews notice states that brand Xarelto also comes in 10 mg, 15 mg and 20 mg tablets and an oral suspension, and it gives no generic entry date for those forms [19]. The sources reviewed for this article do not give generic dates for the other strengths.
What this means for the model
Revenue is a sum over strengths and presentations. A generic launch in one strength does not move the other strengths. A model that applies generic erosion to total brand revenue at the first strength launch overstates the loss. The $446 million figure covers only the 2.5 mg reference product [18].
How does geography split the date?
BMS lists Eliquis with an estimated minimum market exclusivity date of 2028 in the United States and 2026 in Japan [5]. Pfizer reported that Lipitor faced multi-source generic competition in Europe, Japan and Australia in 2011 and 2012 [12]. A global DCF with one LOE year applies the wrong date to at least some regions.
What Does the Price Curve Look Like as Competitors Arrive?
The price curve falls as producers are added. This is the economic reason a staggered entry schedule matters: each new entrant changes the price level, not only the unit share.
In an FDA sample of 181 products with first generic entry from January 2015 through December 2017, the median generic price on an average-manufacturer-price basis was 39% below the pre-entry brand price with one generic producer, 54% below with two, and 79% below with four. (Conrad & Lutter, FDA, December 2019) [20]
FDA price-competition figures by number of generic producers
The FDA sample covers only drugs sold to retail pharmacies [20]. The report calculates these figures from median generic-to-brand price ratios. Specialty drugs and biologics can follow different curves.
What do authorized generics add?
The FTC reported in 2011 that an authorized generic during the 180-day period is associated with retail prices that are four to eight percent lower and wholesale prices that are 7 to 14 percent lower [23]. The same report found that an authorized generic reduces the first-filing generic’s revenue by 40 to 52 percent during exclusivity [23]. For a brand owner, an authorized generic is another entry event with its own date and its own revenue effect. Treat it as a separate line in the schedule.
Case Study: Revlimid and the Negotiated Staircase
Revlimid (lenalidomide) is the clearest recent example of a contract-built entry schedule. The settlements set start dates, volume limits and a final unrestricted date years apart.
What did the Revlimid settlements set?
The BMS 10-K for fiscal 2022 states that Natco received a volume-limited license beginning March 2022 and that Natco and other generics received licenses without volume limitation from January 31, 2026 [4]. The 10-K for fiscal 2025 states: “As of January 31, 2026, the licenses are no longer volume-limited” [5]. Teva launched on March 7, 2022 [6].
What does the reported revenue show?
Year
Revlimid worldwide revenue ($ million)
Change vs. prior year (analysis)
Index (2021 = 100, analysis)
Source
2021
12,821
n/a
100.0
[1]
2022
9,978
-22.2%
77.8
[1]
2023
6,097
-38.9%
47.6
[2]
2024
5,773
-5.3%
45.0
[3]
2025
2,951
-48.9%
23.0
[3]
US revenue followed a similar pattern where the filings report it: $8,359 million in 2022 and $5,266 million in 2023, a 37% decline [2]. In 2025, US Revlimid revenue was $2,535 million, against $4,999 million in 2024 (down 49%) [3].
Why the 2024 figure matters
A cliff model that placed the entry in 2022 would have forecast a steep drop in 2022 and low revenue afterward. The reported series shows the opposite shape for three years: slow loss in 2022, a larger loss in 2023, a pause in 2024, and a second large loss in 2025. The full-year 2025 decline of 49% came in the year before the final unrestricted date, and the fourth-quarter 2025 worldwide decline was 55% [3].
What the series does not prove
The series does not prove that volume limits alone caused each step. Pricing, demand and other products in the multiple myeloma market also change revenue. It does show that no single date explains the path.
Case Study: Humira, Eight Biosimilars and a Decline That Doubled Down
Humira (adalimumab) shows a staggered pattern driven by two launch dates and by payer decisions after launch.
How did the Humira biosimilar launches line up?
Amgen’s Amjevita launched in January 2023. Seven more biosimilars launched over the July 4 weekend of 2023, including Cyltezo, Hadlima, Hulio, Hyrimoz, Idacio, Yuflyma and Yusimry [9]. The gap between the first launch and the July wave was about five months (analysis). List prices varied by product. Several products launched at about 85% below Humira’s list price, and others launched about 5% below [9].
What did AbbVie forecast, and what did it report?
AbbVie guided to a 37% US Humira sales decline for 2023, according to a February 2023 report [10]. AbbVie then reported US Humira net revenue of $12,160 million for 2023, down 34.7% [7]. The forecast and the outcome differ by 2.3 percentage points (analysis). US revenue fell 45.3% in the fourth quarter of 2023 alone, to $2,740 million [7]. In 2024, it fell a further 41.3%, to $7,142 million [8].
Humira US net revenue, 2022 to 2024
Year
US Humira net revenue ($ million)
Change vs. prior year
Source
2022
about 18,622 (calculated)
n/a
Analysis from [7]; consistent with [9]
2023
12,160
-34.7% (reported)
[7]
2024
7,142
-41.3% (reported)
[8]
Why net revenue fell faster than share
Samsung Bioepis data reported in July 2024 put Humira at about 82% share, with all biosimilars at about 18%. The report credited CVS Caremark’s April 2024 removal of Humira from major commercial formularies for much of the biosimilar gain [11]. The article does not state the basis of the share figure. US net revenue fell 41.3% in 2024 [8]. A forecast built from unit share alone would miss the net-price effect that sits between the two numbers (analysis).
Case Study: Lipitor and the Six-Month Gap
Lipitor (atorvastatin) shows a two-stage pattern in a small-molecule market.
What did the Pfizer-Ranbaxy settlement set?
Pfizer and Ranbaxy announced a settlement on June 18, 2008. Ranbaxy’s license to sell generic atorvastatin in the United States took effect November 30, 2011, and Ranbaxy kept 180 days of marketing exclusivity as first challenger [13]. The settlement covered Ranbaxy only. It did not cover challenges by other generic makers [13].
What did Pfizer report for 2012?
Pfizer reports that Lipitor lost US exclusivity in November 2011 and that multi-source generic competition in the United States began in May 2012 [12]. Lipitor revenue fell $5,629 million, or 59%, in 2012 compared with 2011 [12]. The same filing states that Lipitor also faced multi-source competition in Europe, Japan and Australia [12].
What this means for the model
The first stage lasted about six months. The second stage began when the exclusivity period ended. A model with one date, placed at November 2011 or May 2012, misplaces about half a year of the US revenue path.
Case Study: Entresto, Two Launches, One Flat Quarter and One Large Drop
Entresto (sacubitril/valsartan) shows that a cliff can be the right shape when entry is fast and wide. The same case also shows that quarterly timing matters.
When did Entresto generics launch?
Optum RxNews reported that Novadoz, the product of MSN, launched generic Entresto on July 22, 2025 and that Torrent launched two days later [14].
What did Novartis report?
Entresto sales fell 1% in the third quarter of 2025 against the third quarter of 2024 [16]. In the fourth quarter, global Entresto sales were about $1.2 billion, down 45% [15]. The Q4 report attributes the decline to US generic entry in the third quarter [15].
What this means for the model
Launch in late July did not show up as lost revenue in the third quarter. It showed up in the fourth. A model that places the cliff in the launch quarter misdates the loss by one quarter. For an annual DCF, the effect falls across two fiscal periods when entry occurs mid-year. This case is the best support for a fast curve in this article. Even here, the revenue path took two quarters to show the full effect.
Case Study: Eliquis, a Date That Settlements Set and Appeals Could Move
Eliquis (apixaban) shows how a single date can look firm and still carry conditions.
What date did the court and the settlements set?
On September 3, 2021, Pfizer reported that the Federal Circuit affirmed the district court’s finding that patents US 6,967,208 and US 9,326,945 were valid and infringed. The release states: “the earliest that generic manufacturers are permitted to launch their apixaban products is April 1, 2028” [17].
What do the BMS filings still say?
The BMS 10-K for fiscal 2025 states: “the generic companies with whom BMS settled are permitted to launch in 2028, subject to additional challenges” [5]. The same filing lists Eliquis with an estimated minimum market exclusivity of 2028 in the United States and 2026 in Japan [5].
What this means for the model
An analyst should treat April 1, 2028 as an earliest date for named settled filers, not as a certain revenue event. The model needs a probability that a challenger outside the settlement group enters earlier, and a separate Japan date. Use the primary filing language as the source for each assumption.
Case Study: Xarelto and the Strength-Level Split
Xarelto (rivaroxaban) shows that “generic entry” can mean one strength out of several.
What launched in March 2025?
Lupin launched rivaroxaban 2.5 mg tablets on March 7, 2025 [18]. Optum RxNews noted that Taro received FDA approval for a 2.5 mg generic on March 3, 2025, with launch pending [19]. The Lupin release cites estimated annual US sales of $446 million for the 2.5 mg reference product [18].
What do the sources not tell us?
The Optum notice lists brand Xarelto as also sold in 10 mg, 15 mg and 20 mg tablets and as an oral suspension, and gives no generic dates for them [19]. A staggered model needs those dates as separate inputs. Where they are unknown, the model should carry them as scenario ranges and mark them as unconfirmed.
Worked Scenario: A Cliff Model Against a Staircase Model
This scenario is original analysis. It uses assumed numbers and shows how the choice of entry shape changes a DCF. It is not a forecast for any product.
What assumptions does the scenario use?
Input
Value
Basis
Pre-entry annual brand revenue
$10,000 million
Assumed, round number
Free cash flow as a share of revenue
40%
Assumed, constant
Discount rate
8% (also tested at 6% and 10%)
Assumed
Window
Four years after first generic entry
Assumed
Discounting
End of each year
Assumed
Cliff erosion path
Retain 20%, 10%, 5%, 5% of pre-entry revenue in years 1 to 4
Assumed; this is a modeling assumption, not an industry statistic
Revlimid-shaped path
Retain 77.8%, 47.6%, 45.0%, 23.0%
Reported revenue index from [1][2][3], 2022 to 2025
Humira-shaped path
Retain 65.3%, 38.4% in years 1 and 2; 23.0% and 13.8% in years 3 and 4
Years 1 and 2 from reported US revenue [7][8] with 2022 calculated; years 3 and 4 assume a 40% annual decline
What are the results?
Model
Four-year present value of free cash flow ($ million)
Compared with Revlimid-shaped path
Cliff in year 1 (single date at first entry)
1,389
-79.0%
Cliff in year 3 (single date at a midpoint)
8,062
+21.8%
Cliff in year 4 (single date at full entry)
10,896
+64.6%
Revlimid-shaped path
6,620
Baseline
Humira-shaped path
4,870
-26.4%
The year-3 and year-4 cliffs retain full revenue until the cliff year and then apply the 20% retention step. The cumulative revenue retained over four years is 40% of one year’s revenue under the year-1 cliff and about 193% under the Revlimid-shaped path (analysis).
How sensitive is the result to the discount rate?
Discount rate
Year-1 cliff PV ($ million)
Revlimid-shaped PV ($ million)
Staircase value above cliff value
6%
1,437
6,871
+378%
8%
1,389
6,620
+376%
10%
1,345
6,384
+375%
The discount rate changes the ratio by about three percentage points across a four-point range. The shape and timing of the revenue path drive the result.
Error direction one: the cliff placed too early
A year-1 cliff understates value by 79% in this scenario. This is the error of using the first license date, the earliest Paragraph IV launch or the first settlement date as the single event.
Error direction two: the cliff placed too late
A year-4 cliff overstates value by 64.6%. This is the error of using the unrestricted date, the last patent expiry or the end of the final settlement term as the single event.
What does the scenario not show?
The scenario does not show that a staggered model always gives a higher value than a cliff model. When many filers launch in the same week and payers switch at once, the true path can look like a cliff, as the Entresto fourth quarter shows [15]. The scenario shows that the value of an assumption about shape is large, and that the choice of date is a major source of error.
A Taxonomy of Entry Shapes
The framework below is an original classification for modeling. It is not an established industry taxonomy. It groups the cases in this article by the shape of the entry schedule.
Entry shape
Defining feature
Case in this article
What the model must carry
Two-stage exclusivity
One or few sellers for 180 days, then open entry
Lipitor [12][13]
Exclusivity end date; first-stage and second-stage curves
Dated wave
One early entrant, then a group launches on a shared date
Humira [9]
Wave dates; payer-switch timing; net price
Volume-capped ramp
Licensed entry with rising quantity limits, then no limit
Revlimid [4][6]
Annual volume share; unrestricted date
Presentation split
Generic entry in one strength or form first
Xarelto [18][19]
Revenue by strength; separate dates
Fast multi-entrant launch
Two generics within two days; revenue effect spread over two quarters
Entresto [14][15][16]
Quarterly phasing; return and rebate adjustments
Regional split
Different earliest dates by country
Eliquis [5]; Lipitor [12]
Revenue by region; date by region
A product can show more than one shape. Revlimid combines a volume-capped ramp with a final unrestricted date. Humira combines a dated wave with later payer decisions.
How to Build a Staggered Entry Schedule in a Forecast Model
A staggered schedule replaces one date cell with a short table. The steps below keep the table small enough to maintain.
Step 1: List each challenger with a date and a source
Write one row per filer or licensee. Record the earliest launch date, the source document and the status. Use the court record, the settlement terms in an SEC filing or a company press release as the source. A secondary database can show where to look, and it does not replace those documents.
Step 2: Split revenue by strength and presentation
Assign brand revenue to each strength and form. Apply entry to the products that face a generic in that form. The Xarelto 2.5 mg example shows why [18][19].
Step 3: Split revenue by region
Assign revenue by country group and give each group its own date. The Eliquis table shows a two-year spread between the US and Japan [5].
Step 4: Attach a probability to each date
Mark each date as confirmed, settlement-based or contested. Weight contested dates. The Eliquis language “subject to additional challenges” is a direct prompt to do this [5].
Step 5: Convert entrants into price and share
Use the FDA price-by-competitor curve as a starting point for small-molecule retail drugs [20]. Add authorized generic entry as a separate line [23]. For biologics, model net price and payer switching, because Humira’s net revenue fell faster than the share data suggest [8][11].
What to review each quarter
Check each date against new court orders, settlement disclosures and company filings. Replace assumed dates with confirmed dates as they appear.
Where does DrugPatentWatch fit?
DrugPatentWatch describes its coverage as patent data across 134 countries, a litigation tracker with complaints and court documents, tracking of drugs with expiring patents, and FDA Orange Book and ANDA filing data [24]. An analyst can use that kind of database to build the challenger list in Step 1 and to see which patents and cases to check. The analyst should then confirm each date in the court record, the settlement language or the company filing, because those documents set the dates the model uses.
What This Means for Brand Manufacturers, Investors, Generic Makers and Deal Teams
What this means for brand finance teams
Brand finance teams own the LOE assumption in the long-range plan. A staggered schedule lets them show the board a revenue path with named dates and volume terms. It also shows which settlements and rulings can move the path.
What this means for investors and analysts
Analysts who set one LOE year will misprice products in either direction. The Revlimid and Humira series show multi-year declines. A model that checks each year’s reported decline against the schedule will find mismatches early.
What this means for generic and biosimilar manufacturers
A generic maker’s own entry date, volume terms and the date of the next entrant set its revenue. The FTC found that an authorized generic can cut the first filer’s revenue by 40 to 52 percent during exclusivity [23]. The FDA price data show that each added producer lowers price [20].
What this means for business development and licensing teams
Deal teams that value a product with a single LOE date will set the wrong price. A product with a volume-capped ramp and a final unrestricted date supports a different valuation than a product with one early cliff. The scenario above shows a difference of several multiples across the choice of date.
Where Staggered Models Still Fail
Rebates and returns move revenue without moving volume
Novartis noted that US performance was hurt by revenue deduction adjustments in the fourth quarter of 2025 [15]. A schedule of entry dates does not capture these accounting effects. Model gross-to-net separately.
Settlement terms are often partial
The Pfizer-Ranbaxy settlement covered Ranbaxy only [13]. Other filers had their own cases. The Eliquis settlements apply to named filers [5]. A schedule built from one settlement can leave out other entrants.
Non-generic competition can change the base
The filings cited here do not separate generic effects from other causes in the revenue changes. When a competing branded drug or a new formulation takes share, the generic erosion curve double-counts the loss. Keep a separate line for branded competition.
Key Takeaways
Revlimid worldwide revenue fell 22.2%, 38.9%, 5.3% and 48.9% in the four years after the first generic launch, from $12,821 million in 2021 to $2,951 million in 2025 [1][2][3].
The span from Revlimid’s first generic launch (March 7, 2022) to unrestricted licensed entry (January 31, 2026) is 1,426 days (analysis from [4][6]).
Humira US net revenue fell 34.7% in 2023 and 41.3% in 2024 after eight biosimilars launched across two dates [7][8][9].
Lipitor had about six months between first generic entry and multi-source competition, and its 2012 revenue fell 59% [12][13].
Entresto sales were down 1% in the quarter of launch and 45% in the next quarter [15][16].
Eliquis has a 2028 US date for settled filers, subject to additional challenges, and a 2026 Japan date [5][17].
In FDA data, median generic price was 39% below the brand price with one producer and 79% below with four [20].
In the worked scenario, the choice of cliff date changed four-year present value from $1,389 million to $10,896 million, while moving the discount rate across a four-point range changed the staircase-to-cliff ratio by about three percentage points (analysis).
FAQ
How many generic producers does it take to cut the price by half?
In FDA’s sample, two producers brought the median generic price to 54% below the pre-entry brand price on an average-manufacturer-price basis. One producer brought it to 39% below [20]. The sample covers retail-pharmacy products with first generic entry from 2015 to 2017.
When does 180-day exclusivity start?
FDA states that the period begins to run with commercial marketing of the drug product by a first applicant, independent of approval [21][22].
What is the 30-month stay?
FDA states that approval of an ANDA generally stays for 30 months from the date the brand owner receives the patent notice [22].
Why did Revlimid revenue fall only 5% in 2024 and then 49% in 2025?
BMS reported $5,773 million for 2024 and $2,951 million for 2025 [3]. The company’s filings state that the generic licenses were volume-limited until January 31, 2026 [4][5]. The filings reviewed for this article do not assign the 2024 and 2025 changes to specific causes, so an analyst should not do so either.
Should the cliff be placed at first entry or at full entry?
Neither date is reliable. In the scenario, a first-entry cliff understated four-year value by 79% and a full-entry cliff overstated it by 64.6% against the Revlimid-shaped path (analysis). Use a schedule with dates by challenger.
Do authorized generics change the revenue curve?
Yes. The FTC found that an authorized generic during the 180-day period is associated with wholesale prices 7 to 14 percent lower and with 40 to 52 percent lower revenue for the first-filing generic [23]. Treat it as its own line in the schedule.
How should I treat a settlement date that is “subject to additional challenges”?
Treat it as an earliest date for the named filers. BMS uses that language for the 2028 Eliquis date [5]. Add a probability that other challengers enter earlier.
Does a larger number of biosimilars on launch day mean faster erosion?
Not by itself. Eight Humira biosimilars were available by July 2023 [9]. Samsung Bioepis data reported in July 2024 still put Humira at about 82% share [11], while US net revenue fell 34.7% in 2023 and 41.3% in 2024 [7][8]. Payer decisions and net price shaped the path.
Does a staggered model always give a higher value than a cliff model?
No. If entry is fast and payers switch quickly, the staggered path can look like a cliff. Entresto fell 1% in the launch quarter and 45% in the next [15][16]. The staggered model gives a better value only when the evidence supports the stages.
Where can I find the entry dates to build the schedule?
Start with court records, settlement terms in company SEC filings, FDA approvals and company press releases. Patent and litigation databases such as DrugPatentWatch list patents, cases and expiring patents and can point to the documents to check [24]. Confirm each date in the primary document before it enters the model.
References
Bristol Myers Squibb. (2023, February 2). Bristol Myers Squibb reports fourth quarter and full-year financial results for 2022. BioSpace. https://www.biospace.com/bristol-myers-squibb-reports-fourth-quarter-and-full-year-financial-results-for-2022
Bristol Myers Squibb. (2024, February 2). Bristol Myers Squibb reports fourth quarter and full year financial results for 2023. Business Wire. https://www.businesswire.com/news/home/20240202503029/en/Bristol-Myers-Squibb-Reports-Fourth-Quarter-and-Full-Year-Financial-Results-for-2023/
Bristol Myers Squibb. (2026, February 5). Fourth quarter and full year 2025 financial results (Form 8-K, Exhibit 99.1). U.S. Securities and Exchange Commission. https://www.sec.gov/Archives/edgar/data/14272/000001427226000002/a2025q4ex991.htm
Bristol Myers Squibb. (2023). Form 10-K for the fiscal year ended December 31, 2022. U.S. Securities and Exchange Commission. https://www.sec.gov/Archives/edgar/data/14272/000001427223000046/bmy-20221231.htm
Bristol Myers Squibb. (2026). Form 10-K for the fiscal year ended December 31, 2025. U.S. Securities and Exchange Commission. https://www.sec.gov/Archives/edgar/data/14272/000001427226000004/bmy-20251231.htm
AbbVie Inc. (2024, February 2). AbbVie reports full-year and fourth-quarter 2023 financial results (Form 8-K, Exhibit 99.1). U.S. Securities and Exchange Commission. https://www.sec.gov/Archives/edgar/data/1551152/000155115224000007/abbv-20231231xexhibit991.htm
AbbVie Inc. (2025, January 31). AbbVie reports full-year and fourth-quarter 2024 financial results. https://news.abbvie.com/2025-01-31-AbbVie-Reports-Full-Year-and-Fourth-Quarter-2024-Financial-Results
Managed Healthcare Executive. (2023, July 5). 8 Humira biosimilars now available, but formulary questions remain. https://www.managedhealthcareexecutive.com/view/8-humira-biosimilars-now-available-but-formulary-questions-remain
BioProcess International. (2023, February 15). The final hurrah? Humira sales hits $21.2 bn in 2022. https://www.bioprocessintl.com/global-markets/the-final-hurrah-humira-sales-hits-21-2-bn-in-2022
BioSpace. (2024, July 12). AbbVie’s Humira continues to lose market share as biosimilars gain ground: Report. https://www.biospace.com/business/abbvies-humira-continues-to-lose-market-share-as-biosimilars-gain-ground-report
Pfizer Inc. (2013). 2012 Financial Report (Form 10-K, Exhibit 13). U.S. Securities and Exchange Commission. https://www.sec.gov/Archives/edgar/data/0000078003/000007800313000006/pfe-12312012xex13.htm
Pfizer Inc. (2008, June 18). Pfizer Inc. and Ranbaxy Laboratories settle Lipitor patent dispute; generic Lipitor to be launched Nov. 2011. BioSpace. https://www.biospace.com/pfizer-inc-and-ranbaxy-laboratories-settle-lipitor-patent-dispute-generic-lipitor-to-be-launched-nov-2011
Pharmaceutical Technology. (n.d.). Novartis Q3: New drugs step up as generics squeeze Entresto. https://www.pharmaceutical-technology.com/newsletters/novartis-q3-new-drugs-step-up-as-generics-squeeze-entresto
Pfizer Inc. (2021, September 3). Bristol Myers Squibb-Pfizer Alliance pleased with decision by U.S. Court of Appeals for the Federal Circuit. https://www.pfizer.com/news/announcements/bristol-myers-squibb-pfizer-alliance-pleased-decision-us-court-appeals-federal
Lupin Limited. (2025, March 7). Lupin launches rivaroxaban tablets USP, 2.5 mg in the United States. https://www.lupin.com/US/media/lupin-launches-rivaroxaban-tablets-usp-2-5mg-in-the-united-states
Conrad, R., & Lutter, R. (2019, December). Generic competition and drug prices: New evidence linking greater generic competition and lower generic drug prices. U.S. Food and Drug Administration. https://fda.gov/media/133509/download
U.S. Food and Drug Administration, Center for Drug Evaluation and Research. (2003, July). 180-day exclusivity when multiple ANDAs are submitted on the same day. https://www.fda.gov/media/71304/download
U.S. Food and Drug Administration, Office of Generic Drugs. (2009, September 11). Letter regarding 180-day exclusivity for nateglinide tablets (Starlix, NDA 21-204). https://fda.gov/media/77401/download
Federal Trade Commission. (2011, August 31). FTC report examines how authorized generics affect pharmaceutical market. https://www.ftc.gov/news-events/news/press-releases/2011/08/ftc-report-examines-how-authorized-generics-affect-pharmaceutical-market
DrugPatentWatch. (n.d.). DrugPatentWatch: Biopharmaceutical business intelligence. https://www.drugpatentwatch.com/