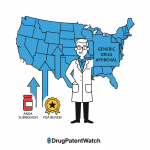
Generic drugs account for 91% of all U.S. prescriptions dispensed while consuming less than 20% of total drug spend. That arithmetic is the entire business case for generic pharmaceutical development — and it is under serious pressure. The simple generics segment is saturated. API supply chains are geopolitically fragile. The Inflation Reduction Act is compressing the brand-name price differentials that historically made generic entry worthwhile. And first-to-file 180-day exclusivity, the golden prize of the Hatch-Waxman era, goes only to the team whose ANDA hits the FDA’s desk first and survives review without a Refuse to Receive letter.
This pillar page is built for the people responsible for winning that race: IP teams running Freedom-to-Operate analyses, portfolio managers allocating R&D spend across a pipeline of ANDA candidates, R&D leads managing formulation and bioequivalence programs for complex generics, and institutional investors modeling generic entry timelines into brand-name asset valuations. The market is projected to reach USD 775.61 billion by 2033. The companies that capture disproportionate value from that growth will be those that have industrialized patent intelligence, cracked complex generic bioequivalence, and built supply chains that don’t collapse when a Chinese API plant fails an FDA inspection.
Here is how they do it.
I. The Generic Development Lifecycle: Where Efficiency Is Won or Lost
A. The ANDA Pathway Is Not Simple — It Is Precisely Demanding
The Abbreviated New Drug Application route eliminates the multi-decade discovery and clinical trial burden of an NDA. What it does not eliminate is complexity. It concentrates complexity into three specific domains: analytical replication of the Reference Listed Drug (RLD), bioequivalence demonstration, and patent clearance. A failure in any of these three domains erases the cost advantage of the abbreviated route entirely.
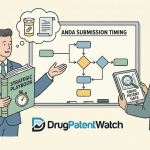
The development sequence runs from market and patent analysis through formulation development, analytical method development and validation, bioequivalence studies, scale-up and technology transfer, ANDA submission, FDA review, and post-market surveillance. On paper, this looks linear. In practice, patent landscape changes mid-development, RLD reformulations trigger Paragraph IV re-evaluations, and FDA product-specific guidances (PSGs) for complex generics evolve during the development window.
The clock that matters most in this sequence is not the FDA review clock, though GDUFA has compressed that substantially. It is the market clock: the gap between patent expiry and first generic approval. Companies that shorten that gap capture the 180-day exclusivity period and the premium pricing that comes with limited competition. Companies that extend it hand that window to a competitor.
B. The 36-Month Benchmark and Where Teams Lose Time
Total development time from initial market assessment to commercial launch runs approximately 36 months for a well-executed ANDA program. The breakdown matters. Formulation and analytical development typically consumes 12 to 18 months. Bioequivalence studies, including the time to design, conduct, analyze, and document them properly, add 6 to 12 months depending on complexity. The FDA review cycle under GDUFA III targets a 10-month first-review window for standard ANDAs, but multiple review cycles stretch this considerably. A single Complete Response Letter (CRL) costs 6 to 12 months.
The implication is straightforward: the 36-month average is not evenly distributed across stages. Regulatory review eats a disproportionate share of elapsed time, and the primary driver of extended regulatory review is submission quality. Teams that submit incomplete CMC packages, inadequate stability data, or unvalidated analytical methods trigger deficiency cycles that compound. The most efficient ANDA programs are built around one objective: single-cycle approval.
Key Takeaways: Lifecycle
The ANDA pathway rewards precision over speed. Early investment in formulation robustness, validated analytical methods, and pre-submission regulatory engagement consistently outperforms the alternative of fast-but-incomplete submissions. Every deficiency cycle is a 6-to-12 month market entry delay. For a drug with USD 500 million in annual brand sales, the cost of that delay — even during a shared 180-day exclusivity period — runs into tens of millions in foregone revenue.
II. The Five Structural Bottlenecks (and What They Actually Cost)
A. Regulatory Submission Quality
The FDA’s Office of Generic Drugs issues Refuse to Receive letters when submissions are substantially deficient, and Complete Response Letters when the review cycle surfaces specific technical problems. RTR rates for certain complex generic categories historically exceed 40% on first submission. The primary causes are CMC deficiencies — inadequate process validation, insufficient stability data, and analytical method failures — followed by bioequivalence design problems and labeling errors.
Each RTR resets the review clock. For a first-to-file applicant holding potential 180-day exclusivity, an RTR letter can mean losing that exclusivity to a competitor whose submission, filed later, was more complete. The financial value of 180-day exclusivity on a major molecule can run to USD 1 billion over six months, depending on the brand’s revenue base. Losing it to a cleaner submission from a competitor is not a regulatory problem. It is a revenue problem.
Pre-ANDA meetings with FDA’s OGD, and controlled correspondences on specific scientific questions, exist precisely to prevent this outcome. Teams that use them systematically reduce their deficiency rates. Teams that treat the submission as the beginning of a regulatory dialogue rather than the conclusion of a development program tend to get it right the first time.
B. Bioequivalence Failure Rates for Complex Generics
Bioequivalence must be demonstrated via single-dose studies in healthy volunteers, with statistical confirmation that the 90% confidence interval of geometric mean test/reference ratios for both AUC and Cmax falls within 80-125%. For immediate-release small molecules with good solubility, this is technically manageable. For modified-release formulations, poorly soluble drugs, narrow therapeutic index (NTI) products, and complex delivery systems, the failure rate escalates sharply.
Complex generics constitute nearly one-third of all branded pharmaceutical products currently in clinical use. Their BE failure rates are substantially higher than simple generics, primarily because generic developers are attempting to replicate an RLD’s performance without access to its proprietary formulation details or process parameters. This ‘invisible equivalence problem’ means that formulation development for complex products requires significantly more mechanistic understanding of drug release kinetics, in vitro-in vivo correlation (IVIVC) modeling, and dissolution methodology.
The FDA’s PSGs for complex generics are explicit about what studies are needed and in what format. Companies that read those PSGs as minimum requirements and design their programs around the underlying science, rather than around a checklist, consistently achieve higher first-cycle approval rates.
C. Paragraph IV Litigation and the 30-Month Stay
A Paragraph IV certification in an ANDA asserts that a listed patent is invalid, unenforceable, or not infringed. It is the legal mechanism that enables generic entry before patent expiry. It is also, in the majority of cases involving major branded products, an invitation to patent litigation.
When a brand manufacturer files suit within 45 days of receiving notice of a Paragraph IV certification, the FDA automatically stays final ANDA approval for up to 30 months. The brand wins this stay whether or not it ultimately wins the litigation. Even a generic company that prevails in court has typically lost 24 to 30 months of market exclusivity from the litigation delay alone. When the 180-day exclusivity clock runs from the first commercial marketing date, a 30-month stay effectively compresses the economic window of that exclusivity period.
Brand manufacturers also deploy lifecycle management tactics designed to complicate this process. Evergreening — the practice of filing secondary patents on new formulations, polymorphs, enantiomers, metabolites, prodrugs, dosing regimens, and methods of use — is standard operating procedure for any major branded product approaching its primary composition-of-matter patent expiry. A mature brand can have dozens of Orange Book-listed patents across multiple types. Each one represents a potential Paragraph IV allegation, a potential lawsuit, and a potential 30-month stay. The generic company that files without comprehensive FTO analysis covering all Orange Book listings is running a legal exposure it has not priced into its development budget.
D. API Supply Chain Concentration
More than 70% of active pharmaceutical ingredients used in U.S. generic drug products originate overseas, with China and India as the dominant sources. This creates a structural vulnerability that intensified visibly during the COVID-19 pandemic and is now re-intensifying as U.S.-China trade tensions generate tariff risk for pharmaceutical inputs. A generic manufacturer whose sole API supplier fails an FDA cGMP inspection faces a complete production halt until either the supplier remediates or an alternative source is qualified.
The process of qualifying an alternative API supplier is not fast. It requires analytical comparability testing, stability data generation on the new material, potentially a Prior Approval Supplement to the FDA, and re-inspection. Timeline: typically 12 to 24 months. For a generic product generating USD 50 million annually, a supply disruption of that length represents severe financial damage, not counting the reputational and customer relationship costs of failing to supply.
E. Price Erosion After Competitive Entry
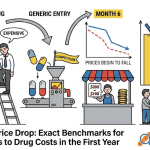
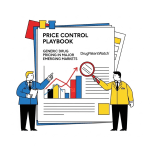
Pricing in the generic market follows a well-documented trajectory. A single generic entrant maintains near-parity with brand pricing. By the time four or more generics are competing for the same molecule, prices have typically fallen 85% from brand levels. With 10 or more competitors after three years, prices drop 70-80% from initial generic pricing. The economics of high-volume, low-price commodity generics are viable only at scale, and they become progressively less viable as buyer consolidation — through wholesale purchasing consortia, PBMs, and GPOs — extracts additional margin.
This price compression is the primary driver of the strategic pivot toward complex generics, biosimilars, and specialty generics. These categories maintain higher prices for longer because their technical barriers limit competitive entry.
Key Takeaways: Bottlenecks
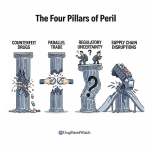
Regulatory deficiency cycles, BE failures in complex products, Paragraph IV litigation stays, API source concentration, and post-entry price erosion are not independent problems. They are interconnected financial risks that compound. A team that addresses them in isolation misses the systemic nature of the efficiency challenge. The highest-performing generic programs treat patent clearance, formulation robustness, regulatory submission quality, and supply chain diversification as a single integrated planning problem, not a series of sequential handoffs.
III. IP Architecture and Valuation: The Core Asset Most Teams Undervalue
A. How Patent Portfolios Determine Entry Timing and Market Value
For a generic drug company, the most valuable single asset in any product program is its patent analysis, not its formulation. The formulation can be optimized. The bioequivalence study can be redesigned. But if the team has filed on a molecule with unresolved Orange Book patent conflicts, or missed a process patent that covers the only commercially viable synthetic route, no amount of R&D investment recovers that position.
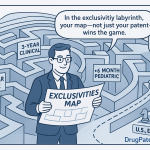
The Orange Book lists three categories of patents: drug substance (composition of matter), drug product (formulation), and method of use. Composition-of-matter patents are typically the primary expiry trigger for generic entry. But formulation patents on controlled-release systems, drug-device combination products, or specific excipient combinations can extend effective market exclusivity by years beyond composition-of-matter expiry. Method-of-use patents can be partially addressed through carve-outs in labeling (section viii statements), but carve-outs are not available for all uses, and the carve-out strategy introduces its own litigation risk.
The IP valuation of a generic ANDA candidate is, in practical terms, a function of four variables: time to unencumbered market entry, probability of successful Paragraph IV challenge, exclusivity period value if first-to-file, and the residual competitive landscape after exclusivity expiry. A sophisticated FTO analysis quantifies each of these.
B. Evergreening Tactics: The Technology Roadmap Brand Companies Use
Understanding the brand manufacturer’s evergreening strategy is not optional background knowledge. It is the core analytical task for any FTO team evaluating an ANDA target. Brand companies execute lifecycle management through a predictable set of patent-filing strategies:
Secondary composition patents cover specific polymorphic forms, hydrates, solvates, or enantiomers that may be used in the commercial formulation even if the base compound is off-patent. These are particularly effective on molecules with complex solid-state chemistry. A generic formulation that uses a different polymorph may avoid the patent but create formulation development complications — or introduce new BE risk if the polymorph affects dissolution.
Formulation patents cover modified-release mechanisms, specific excipient combinations, coating technologies, and particle engineering approaches like nanoparticulation or amorphous solid dispersions. These are increasingly common on molecules where oral bioavailability was a challenge for the originator, because the formulation technology itself is where the clinical performance comes from.
Method-of-use patents claim specific dosing regimens, specific patient populations, combination therapies, or new therapeutic indications. Generic companies can sometimes carve out these uses from their labeling, but the FDA’s position on skinny labels has evolved and the litigation risk on carve-outs has increased since the GSK v. Teva Federal Circuit decision in 2021 raised the bar for what constitutes induced infringement.
Process patents cover synthetic routes and manufacturing processes for the API. These are rarely Orange Book-listed but create Freedom-to-Operate risk in manufacturing. A generic company that manufactures its API using a process that infringes a valid process patent faces liability even if the drug product itself is off-patent.
Drug-device combination product patents cover inhalers, auto-injectors, prefilled syringes, and transdermal delivery systems. These have become among the most strategically significant patent layers for complex generics, because the device IP is often separately maintained from the drug IP and can extend effective exclusivity substantially.
C. IP Valuation Framework for Portfolio Managers
A generic ANDA candidate’s IP value can be modeled using a risk-adjusted net present value (rNPV) approach. The core inputs are as follows.
Peak revenue opportunity is calculated from the brand’s trailing 12-month net sales, adjusted downward for anticipated generic price erosion curves based on the expected number of approved ANDAs. FDA approval timelines, competitive filing intelligence (available via patent database analysis of ANDA notifications), and historical litigation outcomes for similar patent structures inform the probability and timing estimates.
The 180-day exclusivity premium typically represents 60-80% of total generic NPV on high-value molecules, because this is the period of maximum pricing power before multi-competitor erosion sets in. A first-to-file position on a USD 2 billion annual revenue brand, with a 70% probability of successfully challenging the primary formulation patent, generates a risk-adjusted exclusivity value that easily justifies USD 50-100 million in ANDA development investment.
IP risk discounts apply for: unresolved process patents (typically 10-20% discount), method-of-use litigation exposure not addressable by carve-out (15-25%), and drug-device combination patent layering (up to 40% discount on molecules where the device IP is current and robust).
Platform IP — where a generic company owns proprietary formulation technology applicable across multiple ANDA candidates — carries portfolio-level value that single-product NPV models systematically understate. A company with a proprietary controlled-release matrix technology or a validated amorphous solid dispersion platform can genericize molecules that competitors cannot, creating a sustainable competitive advantage that shows up in deal premiums during M&A.
D. Freedom-to-Operate Analysis: The Process That Cannot Be Shortcut
FTO analysis for a generic drug candidate begins with a comprehensive patent landscape covering all Orange Book listings for the RLD, all patents naming the active ingredient in relevant jurisdictions, all process patents covering commercially viable synthetic routes, and all device patents for combination products. This search extends to patent applications, which may issue during the development timeline and create new exposure.
The classification of identified patents follows a risk stratification framework: high-risk patents have claims that read directly on the proposed product or process, medium-risk patents have claims with potential overlap requiring claim construction analysis by patent counsel, and low-risk patents are tangentially related with clear non-infringement arguments available. High-risk patents trigger immediate mitigation analysis: design-around options, invalidity arguments based on prior art or obviousness, and licensing as a last resort.
The timing requirement is strict. FTO analysis must begin at the point where the API and intended dosage form are defined, not at the point of ANDA filing. Late-stage discovery of a high-risk patent has cost companies their entire R&D investment in a development program. Continuous monitoring through a patent watch service is non-negotiable, because new patents can publish and issue on a relevant molecule at any point during a multi-year development program.
Key Takeaways: IP and Valuation
Generic IP strategy is revenue strategy. The 180-day exclusivity window, properly captured on a major molecule, can generate more enterprise value than years of manufacturing margin optimization. The FTO process is the mechanism for determining whether that window is accessible, and at what risk-adjusted cost. Evergreening analysis — mapping the brand’s full secondary patent estate, not just its composition-of-matter expiry — is the analytical work that separates sophisticated generic developers from commodity ANDA filers.
Investment Strategy: IP Valuation
For portfolio managers and institutional investors evaluating generic companies, the key metrics to examine are: (a) the proportion of the ANDA pipeline that includes Paragraph IV certifications and the historical win rate on those challenges, (b) the presence of proprietary formulation or delivery platform IP that enables complex generic development at competitive advantage, (c) the diversity of API sourcing arrangements measured by the percentage of the portfolio with qualified alternate suppliers, and (d) pipeline concentration in high-exclusivity-value molecules versus commodity generics. Companies with concentrated exposure to multi-competitor commodity generics face structural margin compression. Companies with platform IP and a complex generic pipeline trade at justified premiums.
IV. Regulatory Strategy: From ANDA to MAA Without Burning Six Months on Deficiencies
A. Pre-Submission Engagement: The FDA and EMA Tools Most Teams Underuse
The FDA’s OGD offers two formal pre-submission mechanisms that materially affect approval probability and timeline. Pre-ANDA meetings are available for complex generics and products where the regulatory pathway has scientific ambiguities. These meetings allow applicants to get written FDA guidance on study design before committing to the BE program — a direct financial hedge against a BE study that FDA later declines to accept. Controlled correspondences allow ANDA applicants to seek written agency input on specific questions: acceptable reference standard sourcing, acceptable BE waiver criteria for lower strengths, acceptable in vitro dissolution methodology. The responses are binding on FDA reviewers.
The EMA equivalent is the pre-submission meeting, which the agency recommends scheduling 7 months before anticipated application submission for complex cases. The EMA’s pre-submission process also covers procedural questions about which regulatory procedure applies (national, mutual recognition, or centralized) and what fee waivers are available for SMEs.
The Parallel Scientific Advice (PSA) Pilot Program operated jointly by FDA’s OGD and the EMA represents the most efficient simultaneous development option currently available for complex generics with global commercial ambitions. PSA gives applicants concurrent scientific feedback from both agencies during development, identifying divergence early. Where FDA and EMA have different BE study design requirements, or different views on acceptable analytical methods, discovering that divergence in development rather than post-submission saves 18 to 24 months of remediation.
B. GDUFA III and What It Means for Approval Timelines
GDUFA — the Generic Drug User Fee Amendments program — has run through three authorization cycles. GDUFA I (2012) established the basic user fee structure and committed FDA to specific review timelines. GDUFA II focused on reducing the proportion of applications requiring multiple review cycles. GDUFA III, which runs through 2027, concentrates on complex generics, introducing earlier and more frequent applicant-FDA meetings and enhanced guidance development for product-specific requirements.
Since GDUFA’s inception, average generic drug approval times have fallen substantially. The 10-month standard review goal for complete ANDAs is now largely met for straightforward applications. The residual delay problem is concentrated in applications with deficiencies — particularly CMC deficiencies and BE design problems — that trigger complete response letters and second review cycles. GDUFA’s uniform GMP inspection standards for domestic and foreign facilities have also rationalized the inspection cycle, though foreign facility inspections remain a source of approval delay when manufacturing sites have compliance issues.
C. eCTD Submissions, Real-World Evidence, and the Digital Submission Transition
The pharmaceutical regulatory environment has moved decisively toward fully digital submissions. eCTD 4.0 — the current eCTD specification — supports structured submission content with enhanced metadata and cross-referencing capabilities that facilitate electronic review. Companies that have not migrated their document management systems to eCTD 4.0-compliant workflows are introducing operational risk into their submission timelines as regulatory expectations evolve.
Real-World Evidence (RWE) is increasingly accepted as a supplementary data source for lifecycle management submissions, including post-approval changes to ANDA products. For certain bioequivalence waivers — particularly for additional strengths of already-approved products — real-world pharmacokinetic data from electronic health records and observational databases can support the waiver application. This is a cost-efficiency opportunity that most generic companies have not systematically exploited.
AI-assisted regulatory document preparation is moving from experimental to operational at multiple large generic companies. The primary applications are automated cross-referencing of datasets within a submission, flagging inconsistencies between sections, and preliminary identification of data gaps versus regulatory requirements. FDA and EMA have both begun issuing guidance on AI use in regulatory submissions, focusing on validation requirements, transparency obligations, and data integrity standards.
D. EU Pharmaceutical Reform: What the 2025 Council Agreement Changes
The EU pharmaceutical reform package finalized in 2025 introduced changes with direct implications for generic market entry timing. The baseline data exclusivity period for new medicines is moving toward 8 years (from the previous 10), with extensions available for products meeting specific access criteria — including broad EU market launch coverage. The ‘Bolar exemption,’ which enables pre-patent-expiry development activities by generic companies, has been broadened to accelerate post-patent competition.
A new transferable exclusivity voucher (TEV) targets antimicrobial development and has secondary market implications for generic companies that may need to evaluate TEV-holding brand products. Orphan drug exclusivity remains at 10 years, a protection level that limits the generic opportunity for rare disease products.
Key Takeaways: Regulatory Strategy
Single-cycle ANDA approval is the highest-value regulatory outcome achievable. The tools to achieve it are: pre-ANDA meetings for complex products, controlled correspondences for specific scientific questions, PSA for globally strategic molecules, and meticulous CMC package construction. The RTR and CRL avoidance rate among top-performing generic companies correlates directly with their pre-submission regulatory investment. GDUFA fees have made FDA reviews faster and more predictable; the remaining efficiency gap is on the applicant’s side.
V. Complex Generics and Biosimilars: The High-Margin Frontier
A. Why Complex Generics Have Fewer Competitors and Better Economics
The FDA defines complex generics across four axes of complexity: complex active ingredients (peptides, polymeric conjugates, mixtures of active moieties), complex formulations or dosage forms (liposomes, microspheres, ophthalmics, modified-release systems), complex routes of administration or drug-device combinations (inhalers, transdermal systems, implants), and situations where complexity renders the determination of sameness difficult. Products meeting any of these criteria require studies beyond standard bioequivalence to demonstrate therapeutic equivalence.
Nearly one-third of branded pharmaceutical products in active clinical use qualify as complex generics by these criteria. Their average approved ANDA count at any given time is significantly lower than simple generics, because the development barriers deter mass entry. The resulting competitive dynamics allow complex generic manufacturers to maintain substantially higher prices than commodity generics — often 60-80% below brand price rather than the 85-90% erosion seen in multi-competitor commodity markets.
The FDA’s complex generic initiative, running since 2016, has produced product-specific guidances for dozens of complex products and supported the development of advanced analytical methods to assess therapeutic equivalence where standard BE endpoints are insufficient. The PSA pilot with EMA extends this framework to simultaneous global development.
B. Inhaled Drug Products: The Complex Generic Category With the Most Litigation
Inhaled drug products — metered-dose inhalers (MDIs) and dry powder inhalers (DPIs) — represent the most technically and legally contested complex generic category. The primary challenge is that bioequivalence for locally-acting inhaled products cannot be demonstrated solely through systemic pharmacokinetics, because lung deposition patterns and regional distribution within the airway determine therapeutic effect. The FDA requires a ‘weight-of-evidence’ approach combining in vitro aerodynamic particle size distribution testing, pharmacokinetic studies, and pharmacodynamic endpoints for some products.
The device patent estate for major inhaled products is substantial. The Advair Diskus inhaler device, for example, generated years of litigation over device IP that delayed generic entry long after the active ingredient patents had expired. GSK’s device patents covered the Diskus mechanism in sufficient detail that Mylan’s first Advair generic required a distinct device design to avoid infringement — an engineering challenge that added years to the development program. The IP valuation of any inhaled generic must include a full device patent audit as a core analytical component.
C. Biosimilar Development: Interchangeability as the Regulatory Endpoint That Determines Market Access
Biosimilars are complex biological medicines that are highly similar to an already-licensed reference biological medicine (the ‘reference product’). The key regulatory distinction between a biosimilar and an ‘interchangeable’ biosimilar is the interchangeability designation, which permits pharmacists to substitute the biosimilar for the reference product without physician intervention in U.S. states that have enacted substitution laws. Interchangeability requires demonstration that switching between the biosimilar and the reference product multiple times produces no greater safety or efficacy risks than uninterrupted use of the reference product.
The commercial significance of interchangeability is substantial in the U.S. market. Without it, biosimilar uptake requires active physician prescribing or payer step-edit requirements — both of which create friction that slows adoption and limits revenue potential. With it, biosimilar uptake can scale with pharmacy dispensing patterns, which is a faster and more cost-effective commercial pathway.
The biologics patent dance — the 12-step patent dispute resolution mechanism established by the Biologics Price Competition and Innovation Act (BPCIA) — governs the patent litigation timeline for biosimilar applicants. It requires the biosimilar applicant to share its Biologics License Application (BLA) with the reference product sponsor, triggering a negotiation over which patents will be litigated before commercial launch. The mechanism is more complex and less predictable than the Hatch-Waxman Paragraph IV process for small molecules, and it has generated significant litigation over the proper execution of each step.
D. The Biosimilar IP Valuation Case: Humira as the Reference Point
AbbVie’s adalimumab (Humira) represents the most extensively studied case in biosimilar IP strategy. Humira achieved global revenues exceeding USD 20 billion annually at peak, built on a patent estate of more than 250 patents covering the composition of matter, formulations, manufacturing processes, dosing regimens, and specific indications. AbbVie systematically licensed these patents to prospective biosimilar entrants under agreements that delayed U.S. market entry until 2023, while European Humira biosimilars entered from 2018.
The patent lifecycle management executed on Humira generated approximately five additional years of U.S. exclusivity beyond the primary composition-of-matter expiry. At USD 20+ billion in annual revenue, each additional year of exclusivity was worth roughly that amount in brand revenue protected. For biosimilar developers, the inverse calculation applied: each year of delayed entry represented foregone biosimilar revenue that was priced into licensing agreement terms.
The Humida case established that biosimilar IP valuation must account for the entire secondary patent estate, the plausibility of a successful patent challenge on each family, and the brand’s historical willingness and ability to use licensing settlements to sequence market entry on its own terms. Companies evaluating biosimilar program investments that do not conduct this level of patent estate analysis are systematically underestimating development risk and time-to-revenue.
Key Takeaways: Complex Generics and Biosimilars
Complex generics and interchangeable biosimilars offer the highest risk-adjusted margins in generic pharmaceutical development. They also carry the highest development costs and the most extensive patent litigation risk. The economic case for complex generic investment is built on the barrier-to-entry logic: technical difficulty and device or formulation IP that limits the competitive field is the same mechanism that supports pricing. Teams that can solve the technical problem and clear the IP landscape capture markets with few competitors and durable pricing.
Investment Strategy: Complex Generics
Portfolio managers evaluating generic company equity should examine the pipeline split between commodity generics and complex generics or biosimilars. A company with more than 60% of its ANDA pipeline in complex products — defined by FDA complex generic criteria — is building a business with structurally better margin economics than a commodity generics player. The R&D cost per approved ANDA is higher for complex products, but the revenue per approved ANDA is dramatically higher. The relevant multiple is not R&D spend per submission; it is expected NPV per approved product, risk-adjusted for exclusivity probability and competitive landscape.
VI. AI, ML, and Predictive Bioequivalence: What the Data Shows
A. Machine Learning for BE Risk Stratification
Bioequivalence risk assessment is a quantifiable prediction problem. The variables that determine BE study outcomes — drug solubility, permeability, protein binding, particle size, dissolution rate, food effects, first-pass metabolism — are measurable properties that have known relationships to pharmacokinetic behavior. Machine learning models trained on historical BE study outcomes can apply those relationships to new drug candidates and generate probability-weighted risk classifications.
A 2024 study published in a peer-reviewed pharmacokinetics journal demonstrated that random forest models trained on physicochemical and pharmacokinetic properties of drugs with known BE study outcomes achieved 84% accuracy in classifying compounds as high, medium, or low BE risk. This classification accuracy is sufficient to meaningfully inform development resource allocation: high-risk compounds receive more intensive formulation optimization before BE study initiation, reducing study failure rates. Low-risk compounds can advance with a streamlined development approach. The economic impact of this risk stratification — measured in reduced BE study failure costs and faster development timelines — is computable for any company that tracks its historical BE study costs and failure rates.
B. AI-Assisted Formulation Development
Traditional formulation development for generic drugs relies on Design of Experiments (DoE) methodology to explore the space of formulation variables: excipient type and concentration, manufacturing process parameters, granulation method, coating technology. DoE is systematic but exploration-intensive. A full factorial design for a complex controlled-release formulation might require 30 to 50 experimental runs before converging on an optimized formula.
AI formulation models — trained on databases of excipient-API compatibility data, dissolution profiles, and stability outcomes — can propose high-probability formulation candidates from the chemical and physical properties of the API, dramatically reducing the experimental space that needs to be covered. Merck’s published work on AI-assisted formulation development demonstrated that models could predict compatible co-formers for solid dispersions with accuracy sufficient to cut experimental iterations by 60-70% compared to random sampling approaches.
For poorly soluble drugs — which constitute more than 40% of marketed drugs and a higher proportion of new development candidates — AI-assisted selection of amorphous solid dispersion polymer carriers and hot melt extrusion parameters has become a practical efficiency tool. The reduction in formulation development time directly reduces ANDA development costs and accelerates the timeline to BE study readiness.
C. Generative AI for Regulatory Document Assembly
The use of generative AI in regulatory document preparation is advancing rapidly. Current applications include automated compilation of analytical data packages into formatted CTD modules, cross-referencing of stability data against specification commitments, identification of inconsistencies between different sections of a submission, and preliminary comparison of proposed labeling against the reference product labeling and FDA Orange Book requirements.
FDA has issued initial guidance on the use of AI and machine learning in drug development and regulatory submissions, emphasizing validation requirements, documentation of model training and performance, and traceability of AI-generated content. Companies implementing these tools must maintain audit trails that allow regulators to evaluate the AI component of any submission. This is a compliance burden, but it is substantially lower than the cost of manual document review for high-volume ANDA programs.
Key Takeaways: AI and ML
The financial return on AI investment in generic drug development is measurable in two direct metrics: reduction in BE study failure rates through predictive risk stratification, and reduction in formulation development costs through AI-assisted experimental design. Both have been quantified in published research and in disclosed development programs. Companies that have deployed these tools systematically are generating ANDA programs at lower cost and with higher first-cycle approval probability than those relying on traditional empirical approaches.
VII. Continuous Manufacturing, PAT, and the Quality-by-Design Stack
A. Continuous Manufacturing Economics
Traditional batch pharmaceutical manufacturing produces discrete lots of finished product at the end of a multi-stage process with intermediate holds, testing, and release steps between each stage. Batch cycle times for solid oral dosage forms typically run 2 to 4 weeks from dispensing through release. Continuous manufacturing (CM) eliminates batch boundaries by processing material in a continuous flow through all unit operations simultaneously. Commercial continuous manufacturing installations for solid oral products have demonstrated production cycle times of less than 24 hours for equivalent output.
The economic case for CM in generic pharmaceuticals is direct. Variable cost reduction of 40-50% versus batch has been documented at commercial scale, driven by elimination of in-process hold inventory, reduction of material handling steps, lower energy consumption, and reduced labor intensity per unit of output. Capital cost for a continuous manufacturing line is higher than equivalent batch equipment, but the lifecycle cost advantage — particularly for high-volume generic products — is substantial.
FDA has explicitly endorsed continuous manufacturing through its Emerging Technology Program and has issued guidance on CM implementation and regulatory submission requirements. GDUFA III regulatory meetings can include CM-specific technical discussions, supporting companies developing CM-based generic products.
B. Process Analytical Technology as the Real-Time Quality System
Process Analytical Technology (PAT) — the methodology for measuring critical process parameters (CPPs) that govern product quality attributes in real time during manufacturing — is the enabling technology for continuous manufacturing quality control. Without PAT, continuous manufacturing cannot achieve the real-time quality monitoring that justifies its regulatory compliance model.
PAT tools include near-infrared (NIR) spectroscopy for blend uniformity and API concentration measurement, Raman spectroscopy for solid-state form verification, particle size measurement systems embedded in granulation equipment, and inline dissolution testing systems. Each of these tools generates real-time data that, when integrated into process control algorithms, enables automatic process adjustment and out-of-specification detection without stopping the production line.
The regulatory pathway for PAT-enabled real-time release (RTR) testing — where end-product release is based on real-time in-process data rather than final batch testing — is established in FDA guidance and ICH Q8/Q9/Q10 guidelines. RTR-approved products eliminate the standard 2-to-4-week batch release testing cycle, compressing time from manufacture to market and reducing the finished goods inventory required to maintain service levels.
C. Quality by Design: The Formulation and Process Framework
Quality by Design (QbD) is the systematic approach to pharmaceutical development that begins with the Quality Target Product Profile (QTPP) — a prospective definition of the product attributes required for safety and efficacy — and works backward through Critical Quality Attributes (CQAs), Critical Material Attributes (CMAs), Critical Process Parameters (CPPs), and control strategy design to ensure those attributes are consistently achieved in manufacturing.
For generic drugs, the QTPP is substantially defined by the RLD’s labeled specifications and the BE requirement. CQAs for a modified-release tablet might include drug dissolution rate at specified timepoints, assay, related substances, and content uniformity. CMAs for the same product might include API particle size distribution and moisture content of hygroscopic excipients. CPPs might include granulation endpoint, compression force, and coating temperature.
The regulatory benefit of QbD implementation is well-documented: FDA submissions built on QbD methodology generate fewer deficiency queries because the submission demonstrates process understanding rather than just process results. The ICH Q8 pharmaceutical development guideline explicitly rewards QbD-based submissions with enhanced regulatory flexibility — specifically, the ability to make certain process changes within an approved design space without prior FDA approval. This regulatory flexibility has real economic value: manufacturing process optimization post-approval, normally a Prior Approval Supplement that takes 12-18 months, can be executed within the design space without submission delay.
D. Lean Manufacturing in Generic Pharmaceutical Facilities
Lean methodology’s application in pharmaceutical manufacturing targets the same classes of waste that manufacturing engineering has targeted in every other industry: overproduction, waiting, unnecessary transport, excessive processing, inventory, defects, and underutilized employee competencies. The pharmaceutical industry has been slower than automotive or electronics to adopt Lean at scale, partly due to regulatory constraints on process changes and partly due to the batch manufacturing model that builds in inherent wait time between stages.
Documented outcomes from Lean implementations in generic pharmaceutical facilities include changeover time reductions of 20% or more through Single-Minute Exchange of Die (SMED) analysis, waiting time reductions of 24% through workflow sequencing improvements, and defect rate reductions through Poka-yoke (error-proofing) modifications to filling and packaging equipment. These improvements directly reduce cost of goods and improve on-time delivery performance without requiring regulatory submission for process changes within validated ranges.
Key Takeaways: Manufacturing Technology
The QbD/PAT/CM stack is not three separate technology investments. It is one integrated approach to manufacturing quality management. QbD defines what must be controlled. PAT measures it in real time. CM eliminates the batch boundaries that make real-time control logistically complicated. Companies that have deployed all three components together are operating at a manufacturing efficiency level that batch-process, end-product-testing companies cannot match on cost per unit or time to release.
VIII. Portfolio Construction: Identifying Low-Competition Niches Before Your Competitors Do
A. The Analytical Framework for Target Selection
Portfolio management in generic pharmaceuticals has evolved from a patent-expiry calendar exercise into a multi-variable optimization problem. The calendar tells you when a molecule becomes legally available for generic development. It does not tell you whether that development is commercially rational. The commercially rational question requires four additional data points: total brand revenue at expiry, expected generic price erosion based on anticipated number of ANDA filers, development cost and timeline based on product complexity, and regulatory exclusivity probability.
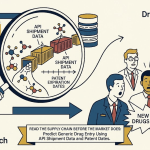
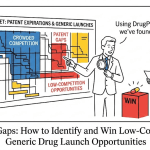
Tools like DrugPatentWatch provide the patent expiry and competitive filing intelligence that anchors this analysis. The FDA’s list of off-patent, off-exclusivity branded products without approved generics identifies the specific subset of molecules where generic entry creates immediate first-mover advantage with no shared exclusivity competition. This list is a systematic source of low-competition opportunity identification that is available to every company but exploited strategically by few.
B. Low-Competition Opportunity Identification: The Criteria
Low-competition generic markets share a set of identifiable characteristics. The molecule has complex formulation or delivery requirements that deter commodity ANDA filers. The brand revenue is in the USD 100-500 million range — large enough to justify complex development investment, small enough that the molecule has not attracted the full field of major generic companies. Existing ANDA filers number two or fewer. The Orange Book patent situation, while requiring a Paragraph IV certification, has identified prior art or obviousness arguments that experienced patent litigation counsel rates above 60% probability of success.
Sterile injectables — particularly specialty oncology injectables, lyophilized products, and suspensions for injection — consistently meet these criteria. Their manufacturing requirements (validated cleanrooms, lyophilization capacity, container-closure integrity testing) deter generic companies without that infrastructure. Their patient populations are small relative to chronic disease generics, reducing the attractiveness to large-volume commodity players. Their pricing is correspondingly durable.
Long-acting injectables (LAIs) — products formulated as microspheres or in situ forming implants for once-monthly or once-quarterly dosing — represent a structurally similar opportunity. LAI generic development requires expertise in polymer chemistry, sterile manufacturing, and specialized BE methodology that goes substantially beyond standard bioequivalence. But the brand revenue base for major LAI products in psychiatry and oncology supports significant development investment, and the competitive field for LAI generics remains sparse.
C. Complex Portfolio Modeling
Portfolio-level optimization for a generic pharmaceutical company requires modeling not just individual product NPVs but the interaction between products in the pipeline. Two ANDA programs competing for the same development team’s formulation resources, the same CDMO’s sterile manufacturing capacity, or the same regulatory team’s submission bandwidth will interfere with each other. Resource contention within the portfolio is a hidden efficiency cost that individual product NPV models do not capture.
Sophisticated portfolio management algorithms — now commercially available from several pharma strategy consultancies and being built in-house at leading generic companies — solve this as a constrained optimization problem. The inputs are individual product NPV distributions, resource requirements by stage, and resource capacity constraints. The output is the portfolio composition that maximizes expected portfolio NPV given the resource constraints. This approach consistently generates portfolio selections that differ from individual product ranking, because it accounts for resource competition and timing interdependencies.
Key Takeaways: Portfolio Construction
The highest-value generic portfolios are not collections of the largest-revenue molecules approaching patent expiry. They are collections of molecules where the combination of technical barrier, IP landscape, regulatory pathway, and competitive field creates durable, high-margin market positions. Building that portfolio requires patent intelligence, competitive filing surveillance, technical capability assessment, and financial modeling working together as an integrated function — not as sequential hand-offs between siloed departments.
Investment Strategy: Portfolio Quality
For analysts, the key portfolio quality signal in a generic company’s disclosures is the first-to-file ANDA count relative to total pipeline size, the proportion of the pipeline in products with complex product designation or complex development history, and the Paragraph IV challenge win rate over the prior 5-year litigation history. Companies with high first-to-file counts, high complex product proportions, and litigation win rates above 65% are building portfolios with structural earning power. Companies with large ANDA counts but low complex product proportions and minimal Paragraph IV activity are building commodity businesses with declining margins.
IX. Supply Chain Architecture for an Era of Tariff Volatility
A. The API Sourcing Vulnerability
The U.S. generic drug supply chain’s dependence on Chinese and Indian API manufacturing is well-documented and has been documented since at least the FDA’s 2011 supply chain risk report. What has changed since then is the severity of the geopolitical context. U.S.-China trade tensions, tariff escalation, and the supply chain disruptions of the COVID-19 pandemic have converted API sourcing concentration from a theoretical risk to a demonstrated operational problem.
An FDA import alert or warning letter at a major Chinese API manufacturer can simultaneously affect dozens of ANDA holders whose products rely on that material. When the Wockhardt and Sun Pharma facility shutdowns between 2013 and 2015 disrupted finished dose manufacturing, the downstream effect on U.S. drug availability was immediate and measurable. The structural issue is that API qualification takes 12-24 months minimum, so the supply chain cannot rapidly respond to a facility disruption by switching sources.
B. Supply Chain Diversification: The Operational Approach
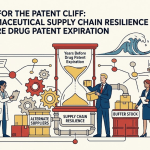
Meaningful supply chain diversification requires pre-qualifying alternative API sources before they are needed, not during a shortage. This means maintaining at least two qualified API suppliers for every critical product in the portfolio — one primary and one alternate — with the alternate source current-GMP-compliant and already referenced in the ANDA (or covered by an approved CBE-30 or PAS supplement).
India represents the primary alternative to Chinese API sourcing for the majority of small molecule generics. Indian API manufacturers have faced their own FDA inspection challenges, but the inspection risk is better distributed across more facilities than the concentrated Chinese risk for specific API chemical classes. The EU’s FAMHP and EMA inspection programs, and the FDA-EMA mutual recognition agreement on GMP inspections, provide some efficiency in the inspection burden for manufacturers seeking dual-market qualification.
The tariff environment as of 2025-2026 requires supply chain teams to model landed cost scenarios across multiple sourcing configurations. A Chinese API that clears FDA inspection but attracts 25-45% tariffs may have higher total cost than a marginally higher-priced Indian or European alternative. This cost modeling needs to be dynamic — updated as trade policy evolves — and integrated into ANDA sourcing decisions before suppliers are locked into the regulatory dossier.
C. DSCSA Compliance and Track-and-Trace Infrastructure
The Drug Supply Chain Security Act (DSCSA) established requirements for electronic serialization and track-and-trace of pharmaceutical products through the U.S. distribution chain. Full interoperable electronic exchange between all trading partners was required by 2024 after multiple deadline extensions. For generic manufacturers, DSCSA compliance is a manufacturing and systems infrastructure requirement — serialization systems, electronic product information exchange, and suspect product investigation processes — that carries ongoing operational cost and adds complexity to distribution partnerships.
Non-compliance risks are direct: products lacking proper serialization cannot be lawfully introduced into the U.S. distribution chain, which means non-compliant products face market withdrawal. The compliance burden is proportionally higher for smaller generic manufacturers without dedicated regulatory affairs infrastructure, which contributes to the consolidation dynamic in the generic manufacturing sector.
Key Takeaways: Supply Chain
Supply chain resilience for generic manufacturers is not a cost optimization exercise. It is a revenue protection exercise. A product that cannot be manufactured due to API sourcing failure generates zero revenue. The cost of maintaining a second qualified API source — the incremental sourcing and qualification cost — is consistently lower than the revenue loss from a supply disruption. Teams that build the business case for supply diversification on cost-savings grounds rather than revenue-protection grounds systematically underinvest in this area.
X. CDMO/CMO Partnership Strategy: Transactional vs. Integrated Models
A. The Outsourcing Spectrum and When to Use Each Model
The spectrum of pharmaceutical outsourcing runs from spot-capacity CMO engagements for commercial manufacturing overflow through CRO partnerships for BE study conduct through full-service CDMO relationships covering development, clinical manufacturing, and commercial scale-up in a single integrated partnership.
The financial logic of each model differs. A transactional CMO engagement minimizes fixed cost commitment and preserves manufacturing flexibility but sacrifices technology transfer efficiency and creates coordination overhead between the development team’s formulation knowledge and the CMO’s manufacturing execution. A fully integrated CDMO relationship adds fixed cost commitment and dependency risk but eliminates the technology transfer gap, accelerates scale-up, and creates single-point accountability for development-to-manufacturing continuity.
For complex generic products where formulation development is deeply intertwined with manufacturing process design — which includes most modified-release, sterile, and inhalation products — the integrated CDMO model consistently generates better development outcomes. The cost premium for full-service CDMOs relative to transactional CMOs is real but typically less than the timeline and quality cost of managing a fragmented supply chain across multiple contract partners.
B. CDMO Selection Criteria for Complex Generics
CDMO selection for a complex generic program requires evaluation across several dimensions that commodity generic programs do not require. Manufacturing platform fit is primary: does the CDMO operate the specific technology required — hot melt extrusion for amorphous solid dispersions, lyophilization capacity for parenteral products, specialized milling for inhalation products? Without the technology, nothing else in the selection criteria matters.
Regulatory track record is the second dimension. A CDMO’s FDA inspection history, including any warning letters, import alerts, or Form 483 observations, directly affects the approval probability and timeline of any ANDA referencing that facility. A CDMO that has had a warning letter lifted within the prior 24 months carries residual inspection risk that may not be disclosed in a sales process. Thorough due diligence on FDA inspection records — which are publicly available through FDA’s FOIA database — is mandatory before committing a complex generic program to a CDMO.
Analytical capability matters specifically for complex generics because the release testing and characterization requirements for these products often exceed what commodity CMOs have validated. An integrated CDMO with in-house pharmaceutical sciences and analytical chemistry capabilities can iterate formulation-to-manufacturing process more efficiently than a handoff model where analytical development sits with the sponsor and manufacturing sits with the CMO.
C. Risk-Sharing Models in CDMO Partnerships
The industry shift toward true CDMO partnerships rather than transactional supply relationships has introduced risk-sharing contract structures that align CDMO financial incentives with program success. Revenue-sharing arrangements, where the CDMO accepts a lower upfront development fee in exchange for a royalty on commercial sales, have become more common for complex programs where the CDMO contributes substantial intellectual input to formulation or process development. Milestone-based payment structures, where CDMO fees are contingent on development and regulatory milestones, similarly align incentives.
These structures require careful term negotiation and clear milestone definition. A development milestone tied to ‘completion of BE study’ rather than ‘successful BE outcome’ creates different risk allocation than a milestone tied to FDA approval. Generic companies entering these arrangements need legal and financial expertise in pharma contract structuring that is distinct from standard procurement negotiation.
Key Takeaways: CDMO Strategy
The highest-value CDMO relationships for complex generic development are those where the CDMO’s platform technology, regulatory track record, and analytical capability are specifically matched to the technical requirements of the product category. A mismatch between product requirements and CDMO capabilities generates timeline delays and quality problems that cost more than the alternative sourcing decision would have. The trend toward integrated partnerships with risk-sharing economics is directionally correct for complex generic programs where development risk and value creation are shared between sponsor and CDMO.
XI. Investment Strategy for Analysts: How Generic Pipeline IP Drives Equity Value
A. The Generic Pipeline Valuation Framework
Generic pharmaceutical company equity value is substantially driven by three sources: the current commercial portfolio’s cash generation, the near-term pipeline’s probability-weighted ANDA approval timeline, and the platform capability’s ability to access high-value complex generic and biosimilar markets that competitors cannot. Analysts who model generic companies as simple multiple-of-earnings vehicles miss the option value embedded in platform IP and complex product pipeline.
The standard sum-of-the-parts valuation for a generic company applies rNPV modeling to each pipeline ANDA candidate, using the probability of first-cycle approval, the time-to-commercial-launch distribution, the expected generic price erosion curve based on anticipated competition, and the exclusivity premium for first-to-file products. These rNPVs are summed and added to a DCF model of the existing commercial portfolio, with a haircut applied for supply chain concentration risk and a premium applied for proprietary platform technology.
B. What Patent Intelligence Data Reveals About Competitive Positioning
Patent intelligence databases provide publicly accessible signals about competitive positioning in generic drug development that are underused in equity analysis. The patent challenge activity of a generic company — specifically, the number of Paragraph IV certifications filed annually and the molecules targeted — reveals the commercial intent and technical capability of the development organization. A company that files Paragraph IV certifications on high-value molecules with legally challengeable patent positions is demonstrating both legal sophistication and commercial ambition.
ANDA filing counts by product type, available through FDA’s ANDA approval database, reveal pipeline complexity distribution. A portfolio analyst who tracks the proportion of a company’s recent ANDA filings that qualify as complex generics versus standard generics has a forward-looking indicator of the company’s margin trajectory that quarterly financial results do not yet reflect.
Litigation outcomes — tracked through court dockets and reported through pharmaceutical IP databases — reveal the legal win rate of a company’s Paragraph IV challenge program. Companies with consistent win rates above 65% on patent validity challenges are extracting disproportionate exclusivity value from their ANDA programs. Those with win rates below 50% are filing aggressive Paragraph IV certifications but losing market entry delays on the 30-month stays without capturing the exclusivity premium.
C. Biosimilar Pipeline as an Indicator of Long-Term Value
A generic company’s biosimilar pipeline position is a multi-year leading indicator of enterprise value that current financial metrics do not capture. Approved interchangeable biosimilars on major reference products — adalimumab, etanercept, ustekinumab, bevacizumab, trastuzumab — generate revenue streams with different characteristics than small molecule generics: longer revenue durability (interchangeability creates pharmacist-level substitution dynamics), lower price erosion per new competitor (market remains less crowded than commodity generics), and higher per-product revenue. A company that has two or more biosimilar approvals with interchangeability designation and a pipeline of six to eight additional biosimilar programs in development is building a business with structurally better 5-to-10-year economics than its current financials show.
D. Supply Chain Risk as an Investment Risk Factor
Supply chain concentration — specifically, the proportion of a generic company’s commercial portfolio dependent on single-source API suppliers in geopolitically concentrated regions — is a material investment risk factor that is rarely modeled explicitly in equity analysis. A generic company with 70% of its commercial API sourced from a single country, no qualified alternate sources, and no disclosed supply chain diversification program is carrying undisclosed operational risk that could manifest as a revenue discontinuity on 12 to 18 months’ notice.
Investor due diligence for generic pharmaceutical companies should specifically include: the API supplier diversity ratio (number of qualified suppliers per commercial product), the proportion of the commercial portfolio with pending or recently resolved FDA inspection actions at manufacturing sites, and the company’s DSCSA compliance status and infrastructure investment.
Key Takeaways: Investment Strategy
Generic pharmaceutical equity value is substantially a function of IP strategy quality, pipeline complexity distribution, regulatory execution competence, and supply chain resilience. The analysts who consistently add value in this sector are those who can read patent landscapes, interpret ANDA filing patterns, evaluate litigation track records, and assess supply chain structure — not just model earnings multiples. The data to do this work is largely publicly available. The analytical framework to use it productively is not common.
XII. Key Takeaways by Segment
For IP Teams: The FTO analysis is not a pre-filing checklist. It is a continuous intelligence function that begins at API definition and runs through patent expiry. Evergreening analysis — covering secondary formulation, process, method-of-use, and device patents — is the difference between a development program that reaches market and one that gets stayed for 30 months. Patent intelligence platforms that integrate Orange Book data, litigation tracking, and competitive ANDA surveillance are essential infrastructure, not optional subscriptions.
For Portfolio Managers: The simple generic commodity market has structurally declining returns. Portfolio construction should target the intersection of high technical barrier, limited competitive ANDA field, legally challengeable patent estate, and adequate brand revenue base. The FDA’s off-patent/off-exclusivity drug list is a systematic first-mover opportunity identifier. Complex generics and interchangeable biosimilars offer both higher margins and more durable competitive positions than commodity products.
For R&D Leads: Single-cycle ANDA approval is the highest-value R&D outcome. Pre-submission regulatory engagement — pre-ANDA meetings, controlled correspondences, PSA for global programs — is the primary lever for achieving it. AI and ML tools for BE risk stratification and formulation optimization are now producing documented efficiency gains. The QbD/PAT/CM manufacturing stack is the platform that sustains those gains at commercial scale.
For Institutional Investors: Generic pharmaceutical equity value is a function of IP strategy, pipeline complexity, regulatory execution, and supply chain resilience — not just earnings multiples. Paragraph IV challenge win rates, complex ANDA pipeline proportions, and biosimilar interchangeability filing status are leading indicators of enterprise value that quarterly financials do not yet show. Supply chain API concentration is a material risk factor that is currently undermodeled in consensus analysis.
For CDMO/CMO Strategists: The shift toward integrated development-and-manufacturing partnerships reflects the technical reality that complex generic formulation and process design cannot be efficiently managed across a hand-off model. Risk-sharing contract structures — revenue participation, milestone-based fees — align CDMO incentives with program success and are commercially viable for both parties when the CDMO contributes genuine platform capability to program development.
The generic drug market is a USD 775 billion opportunity built on the expiration of the most valuable intellectual property in the global economy. Capturing that opportunity efficiently requires treating every component of the development program — patent strategy, regulatory engagement, formulation science, manufacturing technology, and supply chain architecture — as a single integrated value chain, not a series of independent functions. The companies that have built that integrated capability will define the industry’s next decade.