Pfizer killed torcetrapib in 2006 after spending $800 million on a cholesterol drug that raised blood pressure instead of lowering it. AstraZeneca shelved olaparib, then resurrected it, then watched it become a blockbuster PARP inhibitor that generated $2.7 billion in 2022 revenue. Merck licensed pembrolizumab from Schering-Plough for what looked like a middling immunology bet, then rode it to become the world’s best-selling drug.
These are not accidents. They are the product of specific, repeatable decision frameworks that the best pharmaceutical R&D organizations have built, refined, and protected with the same intensity they apply to their compound libraries. The difference between a $10 billion product and a $10 billion write-down often comes down to a handful of portfolio decisions made years before the first Phase III patient is enrolled.
This article is about those decisions: how the best companies make them, what data they use, which mistakes they repeat, and how patent intelligence platforms like DrugPatentWatch have changed the calculus for organizations willing to do the analytical work.
The pharmaceutical R&D portfolio is not a collection of science projects. It is a capital allocation engine. Every molecule in development is competing against every other molecule for budget, headcount, manufacturing capacity, and executive attention. Portfolio strategy is, at its core, the discipline of deciding what to kill, what to accelerate, what to license, and what to protect, usually simultaneously, usually under incomplete information, and always under the pressure of patent clocks that do not stop for anyone.
Part I: The Brutal Economics of Drug Development
The Real Cost of Failure Is Not What You Think
The $2.6 billion figure for average drug development cost, published in the Tufts Center for the Study of Drug Development’s widely cited analysis, includes the cost of failure. That is the number most executives quote in board presentations. It is also the number that obscures where the real money goes.
The more operationally useful figure is the incremental cost of advancing a compound from one phase to the next while carrying the shadow cost of what you could have done instead. When a company keeps a Phase II compound alive for an extra 18 months waiting on biomarker data, the direct spend might be $40 million. The opportunity cost, measured against a compound that was abandoned to make room in the portfolio and later licensed to a competitor, can be multiples of that.
Booz Allen Hamilton estimated in a widely referenced industry study that pharmaceutical companies destroy value primarily not by failing in Phase III, which is expected and priced into the model, but by failing slowly. They advance compounds that should have been killed at Phase II. They run Phase III trials that are underpowered relative to FDA guidance. They launch drugs into markets where they have already been outmaneuvered by a competitor filing for the same indication six months earlier.
The solution is not to spend less on R&D. The pharmaceutical industry’s chronic underinvestment in analytical infrastructure for portfolio decisions is the problem. Companies spend $1 billion on a clinical program and $2 million on the competitive intelligence function that should be guiding it. That ratio is wrong, and the companies that have corrected it produce measurably better portfolio outcomes.
Phase Transition Probabilities: The Numbers Every Portfolio Director Should Know
The Pharmaceutical Research and Manufacturers of America (PhRMA) tracks approval rates by phase, and the historical data is both useful and sobering. Roughly 90 percent of compounds that enter Phase I clinical trials never make it to market. The specific breakdown by therapeutic area matters more than the aggregate, because a 15 percent Phase II-to-Phase III success rate in oncology is structurally different from a 45 percent rate in dermatology, and portfolio strategy must account for that difference in expected value calculations. <blockquote> “From 2011 to 2020, the overall likelihood of approval from Phase I was 7.9%, with oncology programs showing a Phase I to approval rate of just 5.3% compared to 17.2% for hematology.” — Biotechnology Innovation Organization (BIO) Clinical Development Success Rates and Contributing Factors, 2021 </blockquote>
These numbers have strategic implications that most organizations do not operationalize correctly. If you are building an oncology portfolio, your expected value model needs to assign a 94.7 percent failure probability to every Phase I asset. That sounds obvious when stated plainly. In practice, portfolio review meetings are conducted with optimism bias that makes 10-to-1 long shots feel like 3-to-1 favorites.
The discipline of building probabilistic models from actual phase transition data, rather than from investigator enthusiasm or management preference, is one of the clearest separators between pharmaceutical companies that generate consistent returns and those that cycle through write-downs.
The Patent Window Problem
Every compound that enters clinical development is racing against a patent clock. The average drug takes 12 years from discovery to approval. The average patent life is 20 years from filing. By the time most drugs reach market, they have 10 to 12 years of effective patent protection remaining, often less after accounting for the time between patent filing and IND submission.
That window is shrinking in practice, not because patent law has changed significantly, but because development timelines have lengthened, regulatory requirements have intensified, and the competitive landscape forces earlier filing to establish priority. Companies that do not build patent strategy into their R&D portfolio decisions from day one, rather than treating IP as a legal function that handles things at the end of development, systematically waste years of exclusivity that cannot be recovered.
The Hatch-Waxman Act created the patent restoration mechanism that compensates for some of this lost time, allowing up to five years of patent term extension for the regulatory review period. The maximum effective patent life under this provision is 14 years, and achieving even that requires active management of the patent prosecution strategy throughout development, not a filing submitted after approval.
Part II: Building the Portfolio Framework
How Top Companies Structure R&D Portfolio Decisions
The pharmaceutical companies with the most consistent R&D track records over the past two decades share a structural characteristic: they separate the people who generate scientific enthusiasm for compounds from the people who make portfolio resource decisions. Roche has maintained this structural separation more consistently than most large pharmaceutical organizations, and it shows in their clinical success rates, which have historically run above industry average.
The model that works places portfolio governance authority in a body that sits between early discovery and the development organization. This body is not a committee that approves what the scientists want. It is a resource allocation function with explicit authority to kill programs, restructure programs, or redirect budget against the portfolio-level return target rather than against any individual program’s advocate.
The inputs to this function need to combine four distinct types of analysis: technical risk assessment, commercial opportunity modeling, competitive landscape mapping, and patent position analysis. Most pharmaceutical companies do three of these reasonably well. The fourth, competitive landscape and patent position analysis, is where the analytical rigor tends to drop.
This is not because executives do not understand patent strategy. They understand it abstractly. The problem is execution. Building a real-time, program-by-program view of where competitors stand in patent coverage for a given target, mechanism, or indication requires systematic patent surveillance that most companies delegate to legal teams who are already stretched thin on prosecution and litigation.
Platforms like DrugPatentWatch address this gap by aggregating FDA Orange Book data, patent prosecution records, and litigation histories into a searchable format that lets business development and strategy teams run the competitive patent analysis that should inform every significant portfolio decision. When a company is deciding whether to advance a compound into Phase II, the question “where do we stand in the patent landscape relative to the three companies developing the same mechanism?” should have a data-driven answer, not an answer based on what the outside patent counsel remembers from the last time they ran that search.
The Four Portfolio Archetypes
Pharmaceutical companies, regardless of size, tend to organize their R&D portfolios around one of four structural archetypes. Understanding which archetype your organization operates under matters because each creates different decision-making failure modes.
The first archetype is the focused innovator. This organization concentrates capital in a small number of disease areas where it has accumulated scientific, clinical, and commercial capabilities. Vertex Pharmaceuticals is the clearest current example. Its near-total focus on cystic fibrosis and adjacent rare diseases has produced a return profile that outperforms virtually every diversified large pharmaceutical company on a risk-adjusted basis over the past decade. The failure mode for focused innovators is concentration risk: when the platform encounters a scientific setback or a competitive surprise, there is no diversification to absorb the loss.
The second archetype is the diversified platform builder. This organization operates across multiple therapeutic areas and invests heavily in platform technologies (biologics manufacturing, gene therapy delivery systems, RNA therapeutics) that can generate multiple assets across disease areas. Regeneron built its portfolio around its proprietary VelociSuite technology platform, which has generated commercial products across ophthalmology, dermatology, oncology, and rare diseases. The failure mode is capital dilution: resources spread across too many programs produce a portfolio where no individual asset receives the investment needed to optimize its development path.
The third archetype is the business development-led assembler. This organization generates a minority of its clinical pipeline from internal research and acquires or in-licenses the majority from external sources. AbbVie, post-Allergan acquisition, exemplifies this model. The competitive advantage is the ability to deploy capital at the moment of maximum information, after Phase II data, when scientific risk is reduced but before Phase III costs accumulate. The failure mode is overpayment: when multiple assemblers compete for the same external assets, auction dynamics push prices above expected value.
The fourth archetype is the generics-to-specialty converter. This organization has built capabilities in generic or biosimilar development and is attempting to shift up the value chain by applying those capabilities to specialty or rare disease programs. Teva’s strategic repositioning fits this description. The failure mode is capability mismatch: generic development capabilities do not translate directly to the clinical operations, regulatory strategy, and commercial infrastructure needed for specialty products.
Setting Portfolio-Level Return Targets
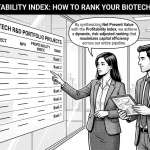
A pharmaceutical R&D portfolio should have an explicit return target, expressed in terms that connect to the company’s cost of capital and risk profile. The most useful metric for this purpose is risk-adjusted net present value (rNPV), which discounts a compound’s projected cash flows by both the time value of money and the probability of reaching each milestone.
The problem with rNPV as commonly applied is that it is calculated at the program level and aggregated, which can obscure portfolio-level correlation risks. A portfolio of eight oncology compounds calculated to have an aggregate rNPV of $4 billion is worth far less than that figure suggests if those eight compounds share a common biological hypothesis that could be invalidated by a single clinical failure.
The portfolio managers who get this right build correlation matrices into their expected value models. They ask not just “what is the probability that this compound succeeds?” but “what is the probability that this compound succeeds given that this other compound fails?” The answer is often very different from the naive calculation, and it changes resource allocation decisions significantly.
Part III: Patent Intelligence as a Competitive Weapon
Why Patent Data Is Underused in Portfolio Decisions
The FDA Orange Book contains comprehensive patent information for all branded small molecule drugs. The Purple Book covers biologics. Patent prosecution databases like the USPTO’s Patent Full-Text and Image Database contain detailed claims data, prosecution history, and continuations. The European Patent Office’s Espacenet covers global filings. All of this data is public.
The analytical problem is volume and structure. The FDA Orange Book lists over 100,000 patent entries. The USPTO database contains tens of millions of patents and patent applications. Extracting competitive intelligence from this volume of data requires either very large legal and analytical teams running manual searches or technology infrastructure designed for the purpose.
DrugPatentWatch aggregates and structures this data specifically for pharmaceutical competitive intelligence applications. It cross-references Orange Book listings with prosecution histories, tracks litigation outcomes that affect market exclusivity timelines, monitors patent term extensions and pediatric exclusivity grants, and surfaces competitive patent filings around specific drug targets or mechanisms. For portfolio decision-makers, this turns a multi-week legal research project into a searchable database query.
The strategic applications are not limited to late-stage lifecycle management, which is where most companies focus their patent analysis. The more valuable applications are in early portfolio decisions: understanding the freedom-to-operate landscape before committing Phase II budget, identifying white space in the patent landscape where new formulations or delivery mechanisms could create differentiated protection, and tracking when competitor patents are set to expire in ways that could open or close market opportunities.
Reading the Patent Landscape for Competitive Position
A useful way to visualize the patent landscape for a given drug target is to map all relevant patents along two axes: scope of claims (how broad or narrow the protection) and time to expiration. Patents with broad claims and long remaining life are the assets that matter most for competitive positioning. Patents with narrow claims expiring within five years represent potential generic entry points that should trigger lifecycle management planning.
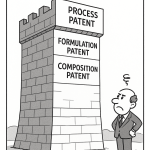
For a company evaluating whether to advance a compound targeting a particular mechanism, the patent landscape analysis should answer four specific questions. First, does the company have freedom to operate, meaning can it develop, manufacture, and commercialize the compound without infringing existing valid patents? Second, what is the quality of the company’s own patent estate around the compound, covering the composition of matter, the manufacturing process, and the relevant formulations? Third, what is the expected timing of generic or biosimilar competition, which determines the commercial window? Fourth, are there defensive filing opportunities that have not yet been pursued?
The third question requires particular attention because the answer is not always obvious from reading Orange Book listings. Companies routinely file patents on secondary characteristics of drugs (specific polymorphic forms, specific dosing regimens, specific patient populations) specifically to extend effective market exclusivity beyond the composition of matter patent expiration. Understanding which of these secondary patents will survive generic challenge and which will not requires analysis of litigation precedent, not just the patent listing.
The Orange Book Strategy: Defense and Offense
Orange Book listing strategy is both a defensive and offensive tool. The defensive use is well understood: list every relevant patent for a drug, including formulation patents and method-of-use patents, because each listed patent triggers a 30-month stay of generic approval when challenged by a Paragraph IV Hatch-Waxman filing.
The offensive use is less commonly discussed. Monitoring competitor Orange Book listings tells you precisely what intellectual property a competitor believes is commercially significant around a given drug. If a competitor suddenly lists three new formulation patents on a drug that is approaching its composition of matter expiration, that is a signal about their lifecycle management strategy. If those formulation patents were filed shortly after your company disclosed clinical data for a next-generation compound in the same class, that is a signal about what they believe your threat profile looks like.
Portfolio managers who treat competitor Orange Book surveillance as a routine intelligence function, rather than a reactive legal process, identify strategic threats and opportunities months or years before they become visible through conventional competitive intelligence channels.
The Paragraph IV certification process provides another source of intelligence. When a generic company files an ANDA with a Paragraph IV certification challenging a branded drug’s patents, that filing and the subsequent litigation become public. The litigation record reveals which patents the generic company believes are invalid or not infringed, which tells you something about the strength of your competitor’s patent position, or your own. For companies with compounds in related therapeutic space, monitoring Paragraph IV litigation in their category is a material intelligence activity.
Part IV: The Capital Allocation Mechanics
How Portfolio Reviews Actually Work at Top Companies
Portfolio review cycles at large pharmaceutical companies typically occur quarterly at the operational level and annually at the strategic level, with emergency reviews triggered by material clinical events. The operational reviews make incremental resource decisions: does this program get the additional $15 million needed to run the secondary endpoint analysis? The strategic reviews make structural decisions: should we exit this therapeutic area, acquire external assets to fill a gap, or restructure the portfolio around a different platform?
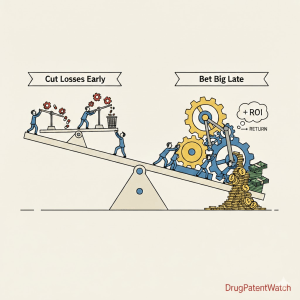
The structural failure in most portfolio reviews is that they evaluate programs individually rather than as a portfolio. A program that would be killed if evaluated on its own merits survives because the person presenting it is a senior vice president who has organizational capital invested in the outcome. A program that is genuinely promising gets fewer resources than it needs because the budget was already committed to the senior VP’s protected program.
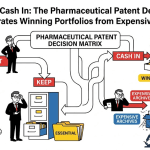
The companies that have fixed this problem have done so by changing the information structure of the review, not by changing the people in the room. They present every program simultaneously, with standardized metrics, and make resource allocation decisions at the portfolio level rather than program by program. The practical mechanism is a portfolio simulation model that lets decision-makers see the aggregate impact of different resource allocation scenarios on the portfolio’s expected value.
Johnson and Johnson’s pharmaceutical division has operated a portfolio management system along these lines for over two decades, which correlates with a clinical success rate in Phase III that has historically been among the highest in the industry. The causality is plausible: when you can see the aggregate impact of your decisions on a portfolio model, you make different individual decisions than when you evaluate each program in isolation.
Kill Decisions: The Hardest Part of Portfolio Management
The literature on organizational behavior is unambiguous: humans are loss-averse, and organizations are even more loss-averse than individuals. The sunk cost fallacy, the tendency to continue investing in a failing endeavor because of what has already been spent, is not merely a cognitive bias in pharmaceutical R&D. It is an organizational dynamic driven by incentives, career concerns, and the difficulty of admitting that a scientific hypothesis was wrong.
A compound that has absorbed $200 million in development costs is not worth advancing to Phase III if the Phase II data suggests a 10 percent probability of approval. But the people in the room who have spent the last four years of their careers on that compound will find ways to interpret the Phase II data more optimistically, will argue that a different trial design could rescue the program, and will point out that killing the program means acknowledging a failure that affects their performance reviews.
The structural response to this problem is to separate the decision to continue a program from the evaluation of the people who have been running it. Program outcomes and personnel performance are different things, and organizations that conflate them systematically make worse portfolio decisions because they cannot afford to kill programs honestly.
AstraZeneca’s portfolio transformation under Pascal Soriot, who took over as CEO in 2012 when the company was burning through patent expirations and its pipeline was thin, involved a period of aggressive program killing combined with a deliberate cultural message that abandoning a program based on data was a sign of analytical rigor, not a career setback. The pipeline rebuild that followed, which produced the oncology franchise that now drives a significant portion of AstraZeneca’s revenue, required first creating the organizational space to kill things honestly.
Resource Allocation Under Budget Constraints
Portfolio managers rarely operate with unconstrained budgets. The operational reality is a fixed or semi-fixed annual R&D budget that must be allocated across a portfolio of programs at different stages of development, each with different capital requirements and different risk-return profiles.
The correct approach to this allocation problem is not to divide the budget proportionally among programs. Proportional allocation is efficient from an organizational fairness standpoint and disastrous from a value-creation standpoint. It produces a portfolio where every program is underfunded relative to the optimal investment level for that program’s risk-return profile.
The correct approach is to identify the programs with the highest expected value per dollar invested and concentrate resources there, accepting that some programs will receive no incremental funding in a given period. This requires ranking programs by their marginal expected value, which is the expected value added by the next incremental dollar of investment rather than the total expected value of the program.
The marginal calculation matters because the return on the next dollar invested in a Phase III program that has already enrolled 70 percent of its patients is very different from the return on the next dollar invested in a Phase I program where two more cohorts of dose escalation data would dramatically clarify the compound’s development path. A simple expected value ranking will not capture this distinction. A marginal expected value ranking will.
Gilead Sciences has been unusually transparent about the capital allocation logic behind some of its major decisions. Its $11.9 billion acquisition of Pharmasset in 2011, which gave Gilead the sofosbuvir program that became Sovaldi and Harvoni, was made on an explicit calculation that the probability-weighted value of the Hepatitis C franchise vastly exceeded the acquisition price, even accounting for the scientific and regulatory risks remaining at the time of the deal. The compound had Phase II data. The mechanism was validated. The remaining risk was a commercial question about price and market access, not a scientific question about whether the drug worked.
Part V: Licensing, Partnerships, and External Innovation
The Build vs. Buy vs. Partner Decision
Every therapeutic gap in a pharmaceutical portfolio presents the same decision: build it internally, acquire it through M&A or licensing, or partner on it through a collaboration or co-development arrangement. The right answer depends on factors that are specific to each situation, but the analytical framework for making the decision is consistent.
Build decisions make sense when the company has scientific and clinical capabilities in the relevant area that represent a durable competitive advantage, when the timeline for internal development is compatible with the commercial opportunity window (accounting for patent life and competitive landscape), and when the capital required for internal development is lower than the premium required to acquire equivalent external assets.
In practice, large pharmaceutical companies are generally less efficient at early-stage discovery than smaller biotech companies and academic research groups. This is not because their scientists are worse. It is because small organizations with concentrated economic incentives, less administrative overhead, and greater tolerance for unconventional hypotheses tend to produce more output per unit of research investment in early discovery. The structural implication is that the build option is most attractive for companies that have already established a hypothesis and need to apply clinical operations and regulatory expertise that smaller organizations lack.
Buy decisions are most attractive when the target asset has Phase II proof-of-concept data that validates the mechanism, when the competitive landscape suggests that delay will either foreclose the opportunity or result in a bidding war with worse terms, and when the acquiring company has commercial infrastructure in the relevant therapeutic area that the seller lacks.
The danger in buy decisions is overpayment driven by competitive auction dynamics. When multiple large pharmaceutical companies are bidding for the same Phase II oncology asset, the winning bidder is paying a price that reflects not just the asset’s expected value but the scarcity premium created by competing bidders. Analysis of pharmaceutical M&A transactions over the past decade consistently shows that acquirers overpay for assets in categories where auction competition is highest, specifically oncology and rare disease, where the scarcity premium can push prices 40 to 60 percent above the expected value calculation that would drive a decision absent competitive pressure.
Partnership decisions make sense when the risk or capital requirement of a program exceeds what either party could optimally absorb alone, when the technical capabilities needed to advance the program span the competencies of two different organizations, or when regulatory or commercial market access requirements in specific geographies favor a local partner’s infrastructure.
Evaluating Licensing Deals: What the Numbers Miss
Licensing deal valuation in the pharmaceutical industry typically involves a net present value calculation applied to projected milestone payments and royalties, discounted at a rate that reflects both the time value of money and the probability of each milestone being achieved. This calculation is technically correct and practically insufficient.
The NPV calculation misses three things that consistently determine whether a licensing deal creates or destroys value. It misses the quality of the licensee’s development execution, which matters more than the terms of the deal when the compound is still in Phase I or Phase II. It misses the strategic option value created by the deal, particularly the knowledge and relationships that develop through co-development arrangements. It misses the opportunity cost of the management attention that licensing relationships consume, which is the resource that most pharmaceutical companies underestimate most systematically.
A licensing deal that looks economically attractive at signing can destroy more value than it creates if it diverts the development team’s attention from internal programs that were better positioned, or if the licensee’s clinical operations capabilities are weaker than the licensor’s due diligence suggested.
The intelligence dimension of licensing analysis is where patent databases like DrugPatentWatch add specific value. When evaluating an in-licensing opportunity, the acquiring organization needs to understand not just the compound’s clinical profile but the quality and defensibility of the IP that will protect the investment. A compound with strong Phase II data and weak patent protection is a fundamentally different asset than a compound with equivalent clinical data and a broad, well-structured patent estate that includes composition of matter coverage, formulation protection, and method-of-use claims across the relevant indications.
The difference between these two situations can be 10 years of effective market exclusivity, which at a revenue scale of $1 billion per year represents $10 billion of commercial value, before accounting for the impact on royalty negotiations, biosimilar development timing, and generic entry strategy. License deals are routinely structured without this analysis being done rigorously at the point of negotiation, and the consequences appear in the commercial performance of the licensed product years later.
Part VI: Competitive Intelligence and Market Positioning
Mapping the Competitive Landscape Before You Commit Phase III Budget
The decision to advance a compound to Phase III is the most consequential single decision in pharmaceutical portfolio management. Phase III trials typically cost between $100 million and $500 million, depending on the indication and trial design. The trial takes two to five years to complete. By the time the data is available, the competitive landscape may look very different from what it was when the trial started.
Companies that run Phase III trials and discover that the market they were targeting has been substantially claimed by a competitor that launched 18 months earlier have made a systematic failure of competitive landscape analysis, not a scientific failure. The science may be excellent. The portfolio decision was wrong.
The competitive landscape analysis that should precede every Phase III decision covers the clinical development status of all competitors in the relevant indication, the patent expiration timeline for current standard-of-care drugs, the expected commercial positioning of competitive compounds that are already in Phase III, the pricing and reimbursement environment that will exist when the compound reaches the market (which is not the environment that exists today), and the patient population size and segmentation that will determine peak revenue potential.
This analysis requires integrating data from multiple sources: clinical trial registries for development status, patent databases for exclusivity timing, drug pricing databases for market value, and epidemiological data for patient population modeling. No single source contains all of this information, and the integration of data from multiple sources into a coherent competitive picture is where most companies’ analytical capabilities break down.
Therapeutic Area Crowding: When to Stay and When to Exit
Some therapeutic areas become so crowded with competitive development programs that the expected value of advancing another compound becomes negative despite the underlying science being valid. The programmatic response to this situation is to identify the precise patient subpopulation where differentiation remains possible, pivot the development strategy to focus on that subpopulation, and build the evidence base that will support a differentiated commercial positioning.
The PD-1/PD-L1 immune checkpoint inhibitor class is the most extreme example of therapeutic area crowding in recent pharmaceutical history. By 2020, there were more than 3,000 active clinical trials involving PD-1 or PD-L1 inhibitors. The mechanism was validated beyond any reasonable scientific doubt. The competitive challenge was entirely commercial: in a field with multiple approved agents and dozens in late-stage development, how do you differentiate your compound and justify a premium price?
Companies that entered this space with undifferentiated compounds and no clear subpopulation strategy found their Phase III programs producing statistically significant but commercially insufficient results. Compounds that demonstrated efficacy in broad populations that already had multiple approved options faced reimbursement barriers that made commercial success difficult regardless of the Phase III outcome.
The companies that navigated this crowding successfully focused development on specific biomarker-defined subpopulations where existing options were suboptimal, or combined their checkpoint inhibitor with a companion asset (either another immunotherapy, a targeted therapy, or a novel delivery approach) in ways that created clinical differentiation. Merck’s pembrolizumab strategy of pursuing first-line non-small cell lung cancer in PD-L1-high patients with a monotherapy label was a positioning decision as much as a clinical one, and it created an enormous commercial advantage over competitors who pursued broader labels with combination regimens.
The Biosimilar Threat: Intelligence-Driven Response
For companies with biologics products approaching patent expiration, the biosimilar development landscape represents both a competitive threat and a strategic forcing function. The forcing function element is often underappreciated: biosimilar competition forces originator companies to make lifecycle decisions that they might otherwise defer indefinitely.
The typical originator response to approaching biosimilar competition includes four elements: developing next-generation formulations or delivery devices that provide clinical differentiation from biosimilar versions, building a patient support and adherence infrastructure that biosimilar manufacturers cannot easily replicate, establishing long-term contracts with payers that include volume commitments and pricing structures that make switching to biosimilars economically less attractive, and accelerating development of next-generation compounds in the same therapeutic area that can capture patients who are price-sensitive.
The timing of each element matters as much as the elements themselves. Companies that begin biosimilar defense strategies only after the first biosimilar approval find that the competitive window for each defensive move has already narrowed. The intelligence activity that supports appropriate timing is continuous monitoring of biosimilar development pipelines, which DrugPatentWatch’s biosimilar tracking capabilities enable at a level of specificity that manual surveillance cannot replicate.
The biosimilar development pipeline for any major biological product typically begins to take shape four to six years before the product’s basic patent expiration. Biosimilar manufacturers file their development programs with the FDA in advance of the approval dates they are targeting. Monitoring these filings, the patent certification challenges that biosimilar applicants file, and the litigation that follows Paragraph IV-equivalent certifications in the biosimilar framework provides originator companies with the leading indicators they need to calibrate their defensive strategies.
Part VII: Regulatory Strategy as Portfolio Tool
How Regulatory Designations Change the Math
The FDA offers a set of expedited review designations that change the timeline and probability of approval in ways that should be explicitly incorporated into portfolio expected value calculations. Fast Track designation, Breakthrough Therapy designation, Accelerated Approval, and Priority Review each have different implications for development timeline, approval probability, and commercial opportunity.
Breakthrough Therapy designation, introduced by the FDA Safety and Innovation Act in 2012, has had a measurable impact on development timelines for designated compounds. Programs receiving Breakthrough designation have historically moved from IND filing to approval in shorter timeframes than non-designated programs in the same therapeutic area, partly because of the intensive FDA guidance that accompanies designation and partly because FDA reviewers allocate more of their bandwidth to designated programs.
The strategic implication for portfolio management is that the expected development timeline for a compound seeking Breakthrough designation is materially shorter than for a comparable compound that does not qualify for designation, which means the net present value calculation for the designated compound should reflect a higher probability of a shorter timeline. Organizations that model designated and non-designated programs with identical timeline assumptions are leaving value on the table in their portfolio analysis.
Rare Pediatric Disease designation, which grants a priority review voucher upon approval that can be sold to another pharmaceutical company, creates a specific financial dynamic worth modeling explicitly. Priority review vouchers have sold for prices ranging from $67 million to $350 million, with recent transactions settling in the $100 to $150 million range. For a development program in a rare pediatric indication, the voucher value is a real financial asset that belongs in the expected value calculation, even though it sits outside the commercial model for the drug itself.
Orphan Drug designation provides both regulatory incentives (seven years of market exclusivity for small molecules, which is separate from and additive to patent protection) and a tax credit for qualified clinical testing expenses. For companies building portfolios with rare disease components, the interaction between orphan exclusivity and patent protection requires integrated analysis. A compound that has orphan exclusivity expiring two years before its composition of matter patent provides a different commercial durability picture than one where the orphan exclusivity extends beyond the patent term.
The 505(b)(2) Pathway as Portfolio Strategy
The 505(b)(2) regulatory pathway allows pharmaceutical companies to file new drug applications that rely in part on published literature or on data previously submitted to the FDA by another applicant, with that applicant’s permission or after its exclusivity has expired. This pathway creates strategic options that are material to portfolio decisions, particularly for companies with capabilities in formulation development or drug delivery.
A pharmaceutical company that identifies a proven mechanism of action with an expiring composition of matter patent can potentially develop a reformulated version of the compound using the 505(b)(2) pathway, establishing new patent protection around the reformulation and qualifying for its own regulatory exclusivity period. This is not a theoretically attractive strategy; it is how a significant portion of the specialty pharmaceutical industry has built its portfolio.
The risks are real. Reformulation programs pursued under 505(b)(2) face challenges establishing clinical differentiation that justifies premium pricing relative to the existing formulation. They also face the possibility that the new formulation will be characterized by payers as line extensions of an existing product, subjecting them to Medicaid rebate provisions that reduce net pricing.
The companies that have made 505(b)(2) strategies work systematically, rather than opportunistically, are those that identify the therapeutic areas where formulation improvements provide genuine clinical benefit, where the patient population is large enough to support the commercial investment in development and launch, and where the patent and regulatory landscape leaves a viable window for establishing exclusivity around the new formulation before competitors reach the same opportunity.
Part VIII: Portfolio Analytics and Decision Support Technology
The Data Infrastructure Problem
The analytical demands of modern pharmaceutical portfolio management exceed what spreadsheet-based tools can support. This is not a data science observation about the complexity of the models; it is a practical observation about the volume and diversity of data inputs that a portfolio decision requires.
A comprehensive portfolio analytics system needs to integrate clinical trial data from internal systems and public registries, financial projection models, patent status data from multiple jurisdictions, regulatory history and designation tracking, competitive intelligence from published sources and licensed databases, market access and pricing intelligence, and manufacturing capacity constraints. Each of these data streams updates on different timelines, uses different taxonomies, and requires different analytical skills to interpret.
The companies that have invested in integrated portfolio analytics infrastructure consistently report that the primary value is not in the sophistication of the analysis itself but in the speed and accessibility of the output. A portfolio director who can pull a current competitive landscape for a therapeutic area, including patent expiration timelines and competitive development status, in the time it takes to prepare for a decision meeting is making qualitatively different decisions than one who receives that analysis as a PowerPoint deck that was prepared two weeks ago and is already partially out of date.
The investment required for this infrastructure is not trivial. Building or licensing the data components, integrating them into a coherent analytical platform, and training the team to use the output effectively typically costs more than most pharmaceutical companies budget for competitive intelligence functions. The companies that have made the investment at scale have done so because they can calculate the value of the decisions it improved.
Using DrugPatentWatch in Portfolio Analysis Workflows
The specific value that DrugPatentWatch provides in the portfolio analytics workflow is access to structured, current patent data that would otherwise require weeks of manual legal research to assemble. For portfolio decisions, the most commonly cited applications fall into three categories.
The first is freedom-to-operate screening for early-stage compounds. Before committing to a full FTO opinion from outside patent counsel, which typically costs $50,000 to $150,000 and takes four to eight weeks, a portfolio analyst can use DrugPatentWatch to get a rapid landscape view of relevant patents, identify the key patents that will require detailed legal analysis, and scope the FTO project appropriately. This shortens the timeline for the full analysis and reduces its cost.
The second is competitive patent monitoring. For each compound in the development portfolio, the portfolio analyst can set up monitoring alerts for competitor patent activity in the relevant therapeutic area. When a competitor files a continuation application that extends coverage in a targeted indication, or when a key patent is challenged in inter partes review proceedings, the portfolio decision-makers see that signal in time to respond rather than discovering it after the fact.
The third is lifecycle management planning. For marketed products, the patent expiration timeline drives lifecycle management investment decisions. DrugPatentWatch’s aggregation of Orange Book data, patent term extensions, and pediatric exclusivity grants provides the current state of a product’s IP position in a format that portfolio managers can use directly, rather than waiting for periodic updates from the patent counsel team.
AI and Machine Learning in Portfolio Decision Support
The pharmaceutical industry’s application of artificial intelligence to portfolio decision support has moved from theoretical enthusiasm to operational deployment at a meaningful number of companies over the past five years. The applications that have shown genuine utility fall into two categories: pattern recognition in historical data and simulation of portfolio outcomes under different strategic scenarios.
The pattern recognition applications use historical clinical trial, regulatory, and commercial data to build predictive models for compound success probability at different development stages. The most commercially available versions of these models are from companies like Insilico Medicine, BenevolentAI, and Recursion Pharmaceuticals, each of which has built variations on the approach using different data types and model architectures.
The honest assessment of these models’ utility for portfolio decisions is that they improve the calibration of success probability estimates in domains where historical data is abundant, specifically in common disease areas with large clinical trial datasets. In rare diseases and novel mechanisms where historical data is sparse, the models add less value because there is insufficient training data to support confident predictions.
The simulation applications use Monte Carlo methods or similar stochastic approaches to model the aggregate portfolio outcome distribution under different resource allocation scenarios. A portfolio manager can ask: “If I kill the three lowest-probability programs and concentrate their budget on the top two programs, how does that change the distribution of possible portfolio outcomes over the next ten years?” A well-constructed simulation answers this question in probabilistic terms, providing not just the expected value change but the change in the distribution’s tail risk, which is often the decision-relevant number.
Part IX: Therapeutic Area Strategy
Oncology: The Portfolio Complexity Champion
Oncology represents the most complex therapeutic area for portfolio management for reasons that are structural, not incidental. The mechanism space is vast, spanning targeted kinase inhibition, immune modulation, epigenetic regulation, cell therapy, and combinations thereof. The patient populations are fragmented by tumor type, mutation status, line of therapy, and biomarker profile in ways that create both opportunity and complexity. The competitive landscape is the most crowded in pharmaceutical development. The regulatory requirements for oncology trials have become increasingly sophisticated, with the FDA demanding progression-free survival as a minimum endpoint for accelerated approval in many situations where overall survival data is unavailable at the time of filing.
Building an oncology portfolio that creates durable value requires making explicit choices about where the company will compete and where it will not. Companies that try to participate across the oncology landscape without genuine competitive advantages in specific areas are consistently outcompeted by organizations with deeper capabilities in narrower spaces.
The portfolio principle that applies in oncology more clearly than in any other therapeutic area is the importance of biomarker strategy from the beginning of development. Compounds that enter clinical development without a clear biomarker hypothesis are at a severe disadvantage in both regulatory and commercial terms. Regulators increasingly expect biomarker-selected trial designs in oncology because they improve statistical efficiency and because the FDA’s precision medicine initiatives make patient selection a priority. Commercial payers expect biomarker-defined patient populations because they support more defensible coverage decisions.
The portfolio implication is that oncology programs need companion diagnostic co-development as an integral component of the development plan, not an afterthought added during Phase III. Companies that neglect this requirement at the portfolio level pay for it in development timelines (the companion diagnostic requires its own regulatory submission) and commercial outcomes (a drug without a companion diagnostic launches into an undefined patient population, which slows uptake even when the clinical data is strong).
Rare Disease: The Patent Arithmetic Is Different
The rare disease portfolio has different patent economics from the mainstream pharmaceutical portfolio for reasons that relate to market size, regulatory incentives, and pricing power. A rare disease compound with 10 years of effective patent protection remaining and strong orphan drug exclusivity can generate commercial returns that would not be achievable with a compound that has the same patent profile but targets a large patient population where pricing is constrained by competitive pressure and payer bargaining.
The pricing power in rare disease markets comes from the combination of small patient populations, high disease severity, limited treatment options, and the moral and political dynamics that make payer resistance to rare disease drug pricing difficult to sustain. Alexion’s eculizumab, marketed as Soliris for paroxysmal nocturnal hemoglobinuria and subsequently for other complement-mediated conditions, demonstrated that a compound targeting a patient population measured in the thousands could generate billions of dollars of annual revenue at pricing levels that would be unachievable in larger indications.
Portfolio managers building rare disease programs need to understand the patent arithmetic in this context. The standard composition of matter patent provides 20 years from filing, with potential for patent term extension. Orphan drug exclusivity adds seven years for small molecules and twelve years for biologics, but it only provides exclusivity for the specific indication for which orphan status was granted. A compound with orphan status in condition A and approved for a second indication in condition B does not receive orphan exclusivity for condition B unless it was also granted orphan designation for that indication separately.
Understanding this nuance matters for portfolio valuation. A rare disease compound with a single indication and orphan exclusivity has a different commercial durability profile from a rare disease compound with multiple indications, each with separate orphan status, even if the clinical profiles look similar. The commercial window for the multi-indication compound is potentially much longer, which should be reflected in the portfolio expected value calculation.
Part X: The Human Factor in Portfolio Decisions
Why Smart People Make Bad Portfolio Calls
The behavioral economics research on decision-making under uncertainty is directly applicable to pharmaceutical portfolio management. The documented biases that affect clinical and portfolio decision-makers include optimism bias (overestimating the probability of a favorable outcome for programs we are invested in), confirmation bias (seeking information that supports a prior belief about a compound’s prospects), escalation of commitment (continuing to invest in a failing program because of prior investment), and overconfidence in precision (treating point estimates from projection models as if they were more reliable than they are).
None of these biases is eliminated by technical sophistication. Pharmaceutical scientists and executives who understand the literature on cognitive bias make the same systematic errors as those who have never read it, because the biases operate through emotional and social mechanisms that are not responsive to intellectual knowledge about them. The solution is structural: building decision processes that correct for known biases rather than relying on individual decision-makers to correct for them in real time.
The pre-mortem technique, popularized by psychologist Gary Klein and now used by some pharmaceutical portfolio teams, asks decision-makers to imagine that a program has failed and to work backward from that failure to identify what went wrong. This prospective failure analysis often surfaces risks that would not be identified through conventional forward-looking risk assessment, because it shifts the cognitive frame from defending a decision to explaining its failure.
Red teams, independent groups tasked with building the strongest possible case against advancing a program, serve a similar function. Merck has reportedly used red team processes in portfolio decisions for major compounds, and the discipline of mounting a genuinely serious attack on a development hypothesis tends to surface the vulnerabilities that advocates would prefer not to articulate.
The Incentive Problem and How to Fix It
The fundamental incentive problem in pharmaceutical portfolio management is that the people whose programs are killed bear an immediate, concrete cost (the program they worked on is gone) while the benefit of the decision (resources redirected to better programs) is diffuse, deferred, and attributed to the programs that received the redirected resources rather than to the decision to kill the original program.
This incentive structure systematically favors keeping programs alive over killing them, regardless of the data quality or the expected value calculation. The people most capable of evaluating whether a program should be killed, the scientists and development leaders who know it best, have the strongest incentives to argue for its continuation.
Structural solutions exist and are used by the best-managed pharmaceutical companies. One approach is to explicitly evaluate and reward the decision to kill programs based on data, not just the decision to continue programs that succeed. A development leader who recommends terminating a program and articulates a rigorous data-driven case for that recommendation is demonstrating exactly the skill set that should be recognized in performance evaluation.
A second approach is to create a separate career track for portfolio management that is not conflated with program management. The skills required to evaluate a portfolio of 20 programs against each other are different from the skills required to advance a single program. Companies that staff portfolio management with people whose career success depends on individual program outcomes will get program advocacy in their portfolio reviews, not portfolio optimization.
Part XI: The Patent Cliff and Portfolio Renewal
Managing the Patent Cliff Without Panic
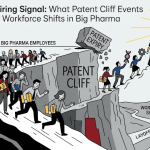
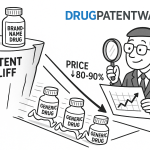
The term “patent cliff” refers to the revenue drop that occurs when a major pharmaceutical product loses patent protection and faces generic or biosimilar competition. The cliff is predictable: the patent expiration date is known years in advance, the generic development timeline is observable in ANDA filings and litigation, and the revenue impact of generic entry is well-documented from historical precedents in similar categories.
Despite this predictability, pharmaceutical companies routinely fail to manage patent cliff transitions effectively, and the consequences are severe for both revenue and valuation. Bristol-Myers Squibb’s revenue from Plavix dropped from $7.1 billion in 2011 to $2.1 billion in 2013 following patent expiration and generic entry, a decline that was entirely predictable but for which the company’s portfolio replacement strategy proved insufficient.
The analytical discipline that prevents patent cliff crises is not difficult to describe: maintain a portfolio where the commercial lifecycle of assets is staggered such that no more than 20 to 25 percent of total revenue is scheduled to come off patent in any three-year window. In practice, maintaining this discipline is genuinely difficult because development timelines are uncertain, approval probabilities are less than one, and the assets that are most valuable for portfolio renewal are exactly the assets that are most competed for in external deals.
What makes the discipline achievable is maintaining real-time visibility into both the patent expiration schedule for the existing portfolio and the development timeline for replacement assets. This requires integrating patent data, regulatory approval projections, and commercial forecasting in a unified model that is updated as each data stream changes. DrugPatentWatch’s patent expiration tracking, cross-referenced with commercial forecast models and development timelines, provides the input to this kind of integrated view.
Building the Next Wave: Identifying White Space
White space in the pharmaceutical patent landscape, areas where no existing patent provides broad coverage and where the competitive development pipeline is sparse, represents the most valuable territory for portfolio development investment. Identifying this white space requires systematic patent landscape analysis, not just monitoring of what competitors are publishing in their annual reports.
The methodology for white space identification starts with defining the target space by mechanism, indication, and patient population. Within that target space, a comprehensive patent landscape search identifies the existing coverage, the owners of that coverage, the expiration timeline, and the quality of the claims. Coverage gaps in the existing landscape represent potential filing opportunities. Coverage areas with patents expiring in the near term represent opportunities to develop in the white space that will be created by those expirations.
This analysis is most valuable when done prospectively, looking at the patent landscape not as it exists today but as it will look in five to seven years given the expirations that are already scheduled. A therapeutic area that looks crowded today may have substantial patent white space in six years as first-generation compound patents expire and biosimilar competition creates openings for next-generation assets with improved profiles.
The companies that identify these prospective opportunities early, build the scientific programs that will fill the white space, and file patent protection around their innovations before competitors reach the same analysis have a significant competitive advantage. That advantage is not accidental. It is the product of systematic patent landscape surveillance as an input to portfolio strategy, not as an afterthought to program management.
Part XII: From Strategy to Execution
Translating Portfolio Decisions into Operating Plans
The gap between portfolio strategy and operating execution is where strategic value most commonly evaporates. A portfolio committee can make a decision to prioritize three programs and deprioritize five, and three months later find that the operational reality is indistinguishable from the previous state because the clinical operations team is still allocating resources proportionally across all eight programs.
Translating portfolio decisions into operating plans requires three specific mechanisms. First, the resource allocation decision needs to be expressed in terms that connect directly to the budget and headcount decisions of every operational function. A decision to “prioritize” Program A over Program B is not actionable without a specific statement of how much clinical operations time, regulatory affairs bandwidth, and manufacturing capacity Program A gets relative to Program B.
Second, the timeline for implementing the resource shift needs to be short. Clinical programs have ongoing operational commitments, trial site contracts, patient enrollment schedules, and regulatory submission timelines that cannot be restructured instantaneously. But the lag between portfolio decision and operational implementation should be measured in weeks, not quarters. Organizations where it takes six months for a portfolio prioritization decision to show up in actual resource allocation are organizations where the portfolio strategy is decorative.
Third, the portfolio decision needs to be communicated to the organization in a way that explains the reasoning, not just the outcome. Scientific and clinical teams that understand why resources are being redirected are better positioned to execute the new priorities effectively than teams that receive an unexplained directive.
Measuring Portfolio Health: The Right Metrics
Most pharmaceutical companies track R&D productivity through metrics that measure activity rather than value creation. Number of INDs filed, number of compounds entering Phase I, number of Phase II programs, number of publications from research teams. These are leading indicators of future output, but they are also gameable and do not connect directly to the portfolio’s commercial performance.
The metrics that matter for portfolio health assessment are probability-weighted expected value of the portfolio (rNPV), capital efficiency (expected value created per dollar of R&D investment), portfolio diversification against therapeutic area concentration risk, and phase transition rates compared to industry benchmarks by therapeutic area.
The last metric, phase transition rates, is particularly diagnostic. If a company’s Phase I to Phase II transition rate is below the industry benchmark for a given therapeutic area, that is a signal that either the scientific quality of the Phase I programs is substandard or the kill criteria at Phase I are insufficiently rigorous. Either problem has a different solution, but neither is visible without tracking the metric explicitly.
Roche has historically reported phase transition rates in their innovation updates, and the consistency of their above-benchmark performance in Phase II to Phase III transitions is a measurable indicator of the quality of their portfolio decision-making at the Phase II gate. Companies that do not track and publicly discuss their phase transition rates typically have phase transition rates that are not worth discussing.
Synthesis: The Principles That Hold
What the Evidence Supports
The body of evidence from pharmaceutical portfolio management research, transaction history, clinical development success rates, and company performance over the past 25 years supports a clear set of principles.
Companies that separate portfolio governance from program management, so that portfolio resource decisions are made by a function that does not have organizational loyalty to individual programs, make better portfolio decisions than those where program advocates control resource allocation.
Companies that build and maintain real-time patent intelligence as a routine portfolio management input, rather than treating it as a legal function that engages at specific points in the development lifecycle, identify competitive threats and opportunities earlier and make better-calibrated development investments.
Companies that make explicit kill decisions based on data, and build organizational cultures and incentive structures that support honest program termination, generate better portfolio returns than those where escalation of commitment drives continued investment in failing programs.
Companies that concentrate resources on their highest expected-value programs rather than distributing resources proportionally across all portfolio programs produce better commercial outcomes, despite the organizational friction that concentration creates.
These principles are not novel. They have been articulated in various forms in pharmaceutical strategy literature for two decades. The reason they are worth restating is that the gap between knowing the principles and applying them consistently, under budget pressure and organizational dynamics that systematically work against them, is where the actual competitive advantage lives.
The pharmaceutical companies that will generate the most consistent R&D returns over the next decade are not those with the best individual compounds or the best scientists. They are those that have built the organizational infrastructure, decision processes, data systems, and incentive structures that translate good science into consistent portfolio decisions. That is the real discipline, and it is harder than the science.
Key Takeaways
Portfolio management in pharmaceutical R&D is a capital allocation problem above everything else. The technical excellence of the underlying science is necessary but not sufficient for portfolio returns. The companies that generate the most consistent returns apply rigorous, probabilistic decision frameworks to the question of where to deploy resources, and they apply those frameworks with organizational discipline that prevents individual program advocacy from overriding portfolio-level expected value optimization.
Patent intelligence is not a legal function; it is a strategic one. The companies that integrate patent landscape analysis, competitive patent monitoring, and exclusivity timeline modeling into their routine portfolio decision processes make qualitatively better choices about which programs to advance, which to license, which to acquire, and which to abandon than those that treat patent analysis as a reactive legal activity.
Kill decisions are where portfolio value is created or destroyed. The organizational reluctance to terminate programs that should be terminated, driven by loss aversion, career concerns, and sunk cost thinking, is the most reliable destroyer of portfolio value in pharmaceutical R&D. Structural solutions exist and work.
Phase III commitment is the portfolio decision that demands the most rigorous competitive landscape analysis. Entering Phase III without a clear, current view of the competitive field, including patent positions, development timelines, and commercial positioning of all competitive compounds, is a systematic way to generate statistically significant results in markets that will not reward them commercially.
Data infrastructure for portfolio decisions is a strategic investment, not an IT project. The companies that have built integrated data environments that combine patent intelligence, clinical development data, commercial forecasting, and competitive landscape analysis in accessible formats are making systematically better portfolio decisions than those relying on siloed data and periodic manual analysis.
FAQ
Q: How do pharmaceutical companies determine the right portfolio size for their stage of development?
Portfolio size should be determined by the company’s capital base, its clinical operations capacity, and its risk diversification requirements, in that order. A company that tries to maintain more programs than it can fund adequately across development stages is not diversifying risk; it is diluting investment below the level required for any individual program to succeed. The practical test is whether each program in the portfolio is receiving resources at the level that maximizes its probability of success. If any program is resource-constrained below that level, the portfolio is too large for the company’s capital base, and the decision is which programs to cut, not how to spread the budget more thinly.
Q: What is the relationship between patent term extensions and portfolio commercial planning, and how should portfolio managers account for it?
Patent term extensions under Hatch-Waxman compensate for time lost during regulatory review by extending the patent term by a period equal to the regulatory review time, capped at five years, with a maximum effective patent life of 14 years from approval. Portfolio commercial plans that do not explicitly model the patent term extension that a product will qualify for are overestimating generic entry risk in the near term and underestimating it in the medium term. The calculation is product-specific: the restoration period depends on the date the IND was in effect, the patent filing date, and the NDA approval date. A compound that files its IND early in development and spends longer in Phase III will qualify for a shorter patent term extension than one that files its IND late and moves through development quickly. Commercial planners should model each product’s specific extension calculation, not a generic industry average.
Q: How should a mid-size biotech approach competitive intelligence differently from a large pharmaceutical company?
Mid-size biotechs face a specific competitive intelligence challenge: they lack the resources to maintain the breadth of surveillance that large companies run, but they cannot afford the blind spots that result from under-investing in competitive awareness. The answer is to concentrate surveillance on the narrowly defined space where the company is actually competing, and to use structured databases rather than human intelligence to do the monitoring cost-effectively. A mid-size oncology biotech with three programs in HER2-driven tumors can get excellent competitive intelligence on that specific space from patent databases, clinical trial registries, and conference abstract monitoring at a fraction of the cost of a broad competitive intelligence function. The mistake mid-size biotechs make is either spending proportionally more than they can afford trying to replicate large company surveillance, or spending nothing and flying blind.
Q: When is it strategically rational to continue developing a compound after a Phase II miss, and when is it rationalization?
The honest answer requires distinguishing between scientific and commercial misses. A Phase II miss that is attributable to trial design problems, patient selection issues, or dose selection errors, where the underlying biological hypothesis remains plausible and there is a credible path to redesigning the study to test the hypothesis more cleanly, can rationally support a decision to continue development with a restructured program. A Phase II miss that provides clear evidence that the drug is not working in the intended patient population with the intended mechanism, regardless of how it was tested, is a scientific miss that should result in program termination. The rationalization version looks like the scientific version but is driven by organizational unwillingness to declare failure. The diagnostic test is whether the expert review of the miss is being done by people with a stake in the program’s continuation or by people with no such stake. Independent scientific advisory boards are useful precisely because they provide the latter perspective.
Q: How is the role of patent cliffs changing as biologics and gene therapies replace small molecules in R&D pipelines?
The patent cliff dynamic for biologics and gene therapies is fundamentally different from small molecule dynamics for two reasons. First, biologics have multiple overlapping exclusivity protections: composition of matter patents, formulation patents, manufacturing process patents, and 12 years of biologic exclusivity under the Biologics Price Competition and Innovation Act, in addition to any orphan drug designation. This layered protection structure means that a biologic product’s effective market exclusivity is determined not by a single patent expiration date but by the interaction of multiple expiration dates and exclusivity periods, each of which requires separate analysis. Second, the technical difficulty of manufacturing exact replicas of biologic products means that even after all exclusivity periods expire, biosimilar market penetration is slower and less complete than small molecule generic market penetration. The commercial cliff for a biologic is a slope, often spanning several years, rather than the sharp revenue drop that follows small molecule patent expiration. Portfolio models that apply small molecule cliff dynamics to biologics systematically undervalue the post-exclusivity commercial durability of biologic assets.
Patent data referenced in this article can be explored through platforms including DrugPatentWatch, which aggregates FDA Orange Book listings, patent prosecution records, and exclusivity timelines for pharmaceutical competitive intelligence applications. Clinical trial data cited is sourced from the Biotechnology Innovation Organization, PhRMA, and publicly available FDA and European Medicines Agency records. Financial data is drawn from company earnings reports and publicly disclosed transaction terms.