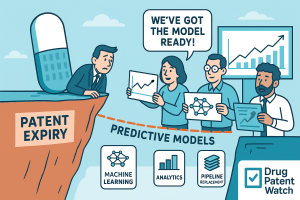
Between 2025 and 2030, an estimated $200-300 billion in branded drug sales globally will lose patent protection. That figure covers roughly 190 drugs, including 69 blockbusters with more than $1 billion in annual revenue each. For any analyst whose job touches pharma equities, pipeline valuation, or IP strategy, the question is never whether the cliff is coming. It is whether your models are sophisticated enough to tell you what happens next.
The answer, for most teams, is no. Standard DCF models mechanically project an 80-90% revenue drop and call it done. Event studies get run after the fact as academic exercises. Machine learning gets proposed in strategy decks and rarely deployed with the patent-specific feature engineering that makes it useful. The result is a persistent gap between how complex these events actually are and how the industry models them.
This guide closes that gap. It covers the architecture of pharmaceutical market exclusivity in precise technical terms, the mechanics of every major valuation and econometric model used by Wall Street and sophisticated pharma BD teams, the specific IP assets that drive those models, and three detailed case studies, Lipitor, Plavix, and Humira, where post-hoc analysis reveals exactly what the models got right and wrong. The goal is a working framework that IP strategists, portfolio managers, R&D leads, and institutional investors can deploy on the 2025-2030 wave.
Deconstructing Market Exclusivity: The Architecture Behind the Monopoly
Before you can model financial impact, you have to map the IP correctly. This sounds obvious, but the most common error in pharma financial modeling is treating patent expiration as a single date determined by a single filing. It is not. A drug’s monopoly is built from two distinct but overlapping systems: patent protection and regulatory exclusivity. The true Loss of Exclusivity (LOE) date is wherever the last layer of that combined structure falls away.
Effective Patent Life: Why the 20-Year Number Is Misleading
A U.S. patent grants a 20-year term measured from the earliest non-provisional filing date. That is the nominal term. The effective patent life, which is the period a drug is actually sold under patent protection with no generic competition, averages between 7 and 12 years after approval.
The gap exists because the patent clock starts running at filing, not at FDA approval. A typical NME program files its composition of matter patent early in preclinical development. The drug then spends 10-15 years in clinical trials and FDA review before it generates its first commercial dollar. By the time a drug reaches patients, its foundational patent may have only a decade of exclusivity remaining.
That compression is the structural economic pressure behind virtually every lifecycle management (LCM) strategy the industry uses. A company that has spent $2-3 billion in fully capitalized development costs has a 7-10 year window to recover that investment plus a market-rate return. Any model that does not incorporate effective patent life as its primary time-horizon variable rather than nominal term will systematically overestimate a drug’s peak-sales runway.
The practical implication for financial analysts: when you are reviewing an rNPV model for a Phase II asset, check whether the team has calculated effective patent life from the actual filing date. If they are using nominal term, the NPV figures are inflated.
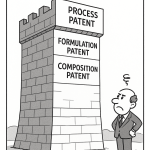
The Patent Hierarchy: Composition of Matter to the Thicket
Not every patent in a drug’s portfolio carries equal weight. The hierarchy matters for valuation because each layer has a different likelihood of surviving Inter Partes Review (IPR) at the USPTO and a different ability to deter generic filers.
Composition of Matter Patents
These are the foundational patents covering the active pharmaceutical ingredient (API) itself. They are the broadest form of protection because they block any competitor from making, using, or selling the same molecule for any therapeutic purpose. For early-stage biotech investors and BD teams evaluating licensing deals, the existence of a granted composition of matter patent in key jurisdictions, particularly the U.S., EU, Japan, and China, is the single most consequential IP variable in the asset’s valuation. A strong composition of matter patent can justify a substantial premium in an rNPV model relative to the same asset without one.
Formulation and Delivery Patents
These secondary patents cover specific physical or chemical presentations of the API: sustained-release tablets, nanoparticle formulations, inhaler devices, transdermal patches, subcutaneous injection systems. Eli Lilly’s once-weekly sustained-release fluoxetine (marketed as Prozac Weekly) is a textbook example. Lilly developed and patented the new formulation as the original fluoxetine composition of matter patent neared expiration, extending its branded market position. GlaxoSmithKline pursued the same play with sumatriptan (Imitrex), securing patents on an intranasal delivery formulation when its oral tablet patent was expiring.
The valuation contribution of formulation patents is conditional. They add meaningful protection only if the new formulation delivers a clinically differentiated benefit that drives formulary preference or physician prescribing habits. A sustained-release version that offers no clinical advantage over the original may face formulary displacement by generic IR versions regardless of the patent status of the SR form.
Method-of-Use Patents
These patents cover specific therapeutic indications rather than the molecule itself. If a drug approved for Type 2 diabetes is later found effective in heart failure with preserved ejection fraction (HFpEF), the company can obtain a new method-of-use patent for that indication. The protection is narrower than a composition of matter patent because a generic filer can still enter the market for the original indication while the new indication remains protected. For oncology drugs, method-of-use patents tied to specific biomarker-defined patient populations have become an increasingly important LCM tool.
Other Secondary Patents
Polymorph patents cover specific crystalline structures of the same API, each of which may have distinct solubility, bioavailability, or stability properties. Salt-form patents cover specific acid-base salt combinations. Dosage regimen patents cover specific dosing schedules. Process patents cover manufacturing methods. Each one is a potential obstacle for generic filers, which is precisely their strategic function.
The Patent Thicket: AbbVie’s Humira as the Defining Case
When a company layers dozens or hundreds of secondary patents on a single drug, the result is a patent thicket. AbbVie’s adalimumab (Humira) accumulated more than 250 U.S. patents. The composition of matter patents expired years before the U.S. biosimilar entry date of January 2023. What kept competitors out of the U.S. market for years was the thicket of secondary patents covering formulations, devices, manufacturing processes, and methods of use across more than a dozen indications.
The thicket’s strategic value is not primarily about winning every lawsuit. Its purpose is to make the economics of challenging the entire portfolio prohibitive. A biosimilar developer confident it can invalidate two or three patents still faces the prospect of simultaneous litigation on dozens of others, each requiring separate legal resources, expert witnesses, and years of management attention. AbbVie executed that strategy with precision, settling with each biosimilar entrant on its own schedule, effectively controlling the timing and pace of U.S. market entry rather than having it imposed by a single patent expiration date.
For financial modelers, the lesson is that counting patents is the wrong metric. A rigorous model must assess thicket density, the diversity of patent types across the portfolio, and the strategic placement of expiration dates to identify whether a company has created genuine deterrence or merely paper protection. That assessment requires access to structured patent data, including claim-level analysis and PTAB petition history, not just expiration dates from the Orange Book.
Regulatory Exclusivity: The Second Fence
The FDA grants market exclusivity periods that are independent of patent status. They can run concurrently with patents, extend beyond them, or be the sole source of market protection when patent coverage is weak or absent.
New Chemical Entity (NCE) exclusivity grants five years of data exclusivity for drugs containing an active ingredient with no prior FDA approval. During this window, the FDA will not accept an ANDA or 505(b)(2) application for a generic referencing that drug’s clinical data. NCE exclusivity is what protects a drug in its earliest commercial years before generic filers can even begin the process.
Orphan Drug Exclusivity (ODE) grants seven years of market exclusivity for drugs approved for rare diseases affecting fewer than 200,000 U.S. patients. The ODE is a market exclusivity provision, not just a data exclusivity provision, meaning it blocks any competitor from marketing the same drug for the same orphan indication regardless of patent status. For biotech companies developing therapies in rare diseases, ODE can represent the primary IP protection if composition of matter patents are weak.
Pediatric exclusivity adds six months to any existing patent or exclusivity period as a reward for completing pediatric studies under the Pediatric Research Equity Act or Best Pharmaceuticals for Children Act. While only six months, on a drug generating $5 billion annually, that extension translates to approximately $2.5 billion in protected revenue. It is a routine and cost-effective LCM tool.
The LOE date for any given drug is whichever protection ends last, whether patent or regulatory exclusivity. This single date is the foundational input for every quantitative model discussed below. Getting it wrong, which happens when analysts rely on a single patent date rather than the full exclusivity stack, invalidates every downstream calculation.
Key Takeaways: Exclusivity Architecture
The LOE date is not determined by the first patent that expires, nor by the composition of matter patent alone. It is the final expiration date across all applicable patents and all active regulatory exclusivities. Patent thicket density is a qualitative variable that must be translated into a quantitative deterrence score for inclusion in predictive models. Effective patent life, which averages 7-12 years post-approval, is the only commercially relevant time horizon. Nominal 20-year term is a legal construct with limited analytical utility.
IP Valuation as a Core Asset: How Patent Portfolios Drive Enterprise Value
A drug’s patent portfolio is not just a legal defense mechanism. It is the primary determinant of the present value of its future cash flows and, by extension, a significant component of the parent company’s enterprise value. Understanding the mechanics of patent IP valuation at the asset level is the prerequisite to any serious analysis of how a patent cliff affects stock performance.
The Discounted Relief-from-Royalty Method for Individual Patents
The relief-from-royalty method is one of the standard approaches for valuing an individual patent. It estimates the value of the patent as the present value of the royalty payments the company avoids by owning the patent rather than licensing it from a third party. The calculation requires three inputs: a market-appropriate royalty rate for the technology category, a revenue forecast for the drug, and a discount rate that reflects the riskiness of those revenues.
For pharmaceutical composition of matter patents, royalty rates in comparable licensing transactions have historically ranged from 5% to 25% of net sales, depending on therapeutic area, stage of development, and competitive landscape. A composition of matter patent on a first-in-class biologic in a validated oncology indication commands rates at the high end of that range. A formulation patent on a me-too cardiovascular agent sits at the low end.
The practical use of this method for corporate IP teams is in licensing negotiations and deal pricing. If a partner is seeking a license to a composition of matter patent, the relief-from-royalty method gives the licensor a defensible floor price grounded in the patent’s revenue contribution.
Incremental Cash Flow Attributable to Patent Protection
A second method compares the expected cash flows under two scenarios: one where the patent remains in force and one where generic competition enters immediately. The difference, discounted to present value, is the financial value attributable to the patent. This method is particularly useful for quantifying the value of secondary patents in a thicket. A formulation patent that delays a competitor’s launch by 18 months on a drug generating $4 billion annually in net sales has a calculable value: 18 months of protected contribution margin minus the cost of obtaining and defending the patent.
For BD teams, this framing translates directly into decisions about whether to file, prosecute, and litigate secondary patents. If the incremental cash flow from an 18-month delay exceeds the all-in litigation cost of a Paragraph IV defense, the patent is economically worth defending. If not, a settlement that brings a generic in early and eliminates litigation expense may be the value-maximizing choice.
Keytruda’s Patent Portfolio: A $29.5 Billion Question
Merck’s pembrolizumab (Keytruda) generated $29.5 billion in 2023 revenue, making it the highest-grossing drug in pharmaceutical history by annual sales. Its core composition of matter patents are expected to provide U.S. exclusivity through approximately 2028. But the relevant IP valuation question for Merck’s portfolio managers is not simply ‘what happens in 2028?’ It is a compound question about at least four distinct layers.
The base composition of matter patents cover the pembrolizumab antibody itself. Merck has supplemented these with a portfolio of method-of-use patents covering specific approved indications, biomarker selection criteria (PD-L1 expression thresholds, MSI-H/dMMR tumor status), and combination regimens. Each indication-specific method-of-use patent has its own expiration date and its own potential for biosimilar carve-out. A biosimilar pembrolizumab approved for non-small cell lung cancer but not for melanoma would be launching into a carved-out indication with a different competitive and pricing dynamic.
Merck’s defensive strategy for Keytruda post-2028 runs on several tracks simultaneously. The company has been aggressively expanding Keytruda into new indications, each generating new method-of-use patents. It has partnered Keytruda in combination regimens with other approved agents and investigational drugs, creating clinical data in indication-specific settings that biosimilar manufacturers would need to replicate to achieve a label that matches Keytruda’s current approved uses. Merck has also invested heavily in subcutaneous pembrolizumab formulation development, with the subcutaneous version potentially commanding a new patent position and a more defensible market share among patients and physicians who prefer the non-infusion route.
For institutional investors with a 5-7 year horizon, the Keytruda IP valuation is not a cliff calculation. It is a multi-scenario model with at least four meaningful outcomes, ranging from a situation where strong biosimilar competition erodes revenue by 60-70% within three years of LOE to one where Merck’s combination data, indication complexity, and subcutaneous formulation create sufficient market segmentation to hold 50%+ branded share for several years post-LOE.
Investment Strategy Note: Patent Portfolio Value as a Screener
For equity analysts building a quantitative pharma screen, a company’s ratio of IP asset value to enterprise value is a useful but underused signal. Companies where a single drug’s patent portfolio accounts for more than 50% of total enterprise value carry a structurally different risk profile than diversified companies where the most exposed asset represents 20% of value. That ratio, calculable from SOTP analysis, should trigger additional scrutiny of that drug’s remaining patent life, the density of its secondary patent thicket, the status of active Paragraph IV filings, and the company’s pipeline strength relative to the gap the LOE will create.
Foundational Valuation Models: Building the Quantitative Framework
Discounted Cash Flow Analysis: Modeling the Revenue Erosion
DCF analysis quantifies the present value of a drug’s future net cash flows. Its core utility in the patent cliff context is to make the value destruction explicit and calculable rather than abstract.
Step 1: Revenue Projection and Erosion Curve Construction
The revenue forecast requires estimates of target patient population, market penetration rate, net price trajectory, and competitive displacement timeline. For the patent cliff, the critical component is the post-LOE erosion curve, which is the shape and speed of revenue decline after generic entry.
For small-molecule oral drugs with multiple generic filers, historical data is consistent: revenue declines 70-90% within the first 12-18 months. The pace of erosion depends on the number of approved generic filers, the speed of pharmacy-level substitution, and formulary tier restructuring by PBMs. When 10 or more generics enter simultaneously, as happened with atorvastatin in December 2011, the erosion curve is almost vertical.
Biologics follow a fundamentally different pattern. Biosimilar manufacturing is sufficiently complex that manufacturing scale-up, FDA inspection timelines, and interchangeability designation requirements create natural pacing of competitive entry. Humira’s U.S. biosimilar entry in January 2023 involved seven biosimilar launches on day one, which was historically unprecedented for a biologic. Even so, branded Humira retained substantial market share through most of 2023, partly because AbbVie’s rebate wall contracts with payers locked biosimilars out of preferred formulary positions. Revenue fell materially but not vertically. Modelers who applied a small-molecule-style erosion assumption to Humira would have significantly underestimated AbbVie’s 2023 and 2024 revenues.
For biologics, the appropriate erosion model is a graduated S-curve, with erosion accelerating over a 3-5 year period as biosimilar interchangeability designations are obtained, formulary shifts accumulate, and PBM negotiations reset at plan year boundaries. The specific slope depends on the therapeutic category’s switching sensitivity, the number of interchangeable-designated biosimilars, and the innovator’s ability to negotiate volume-based rebate contracts.
Step 2: Terminal Value in a Post-Exclusivity World
Terminal value assumptions for post-LOE assets deserve more scrutiny than they typically receive in sell-side models. For small-molecule drugs, the standard assumption of zero or near-zero terminal value is defensible. The branded product typically retains less than 10% market share at a price premium serving a small segment of brand-loyal patients, generating contribution margins too thin to merit a meaningful terminal value.
For biologics, the calculation is more nuanced. Innovator biologics in complex disease states, particularly immunology and oncology, where physicians are reluctant to switch stable patients, can retain 20-40% market share years after biosimilar entry. If the terminal revenue level is $1-2 billion annually with strong margins from a low-volume, high-price branded segment, a terminal value is warranted. The discount rate applied to that terminal value should reflect the long-term risk of interchangeability designation, formulary changes, and new competitive entrants.
Step 3: WACC and Risk-Adjusted Discount Rates
The WACC for a single-product pharmaceutical company facing imminent LOE on its primary revenue source should reflect the binary risk that entails. Standard pharmaceutical industry WACCs range from 8% to 12%. For a company where 70% of revenue comes from a drug expiring in 24 months with no late-stage pipeline assets, a higher rate, potentially 12-15%, is analytically justified. The higher rate captures the elevated risk that the company’s future cash flows will be materially lower than base-case projections.
Risk-Adjusted Net Present Value: Valuing the Pipeline Offset
The rNPV model addresses a problem DCF cannot. When a company’s strategic response to a patent cliff involves developing new drugs, those pipeline assets carry substantial probability-of-failure risk that must be incorporated into the valuation. Simply projecting peak sales for a Phase II asset and discounting it to present value produces a wildly overoptimistic number.
The Mechanics of Probability-Weighted Cash Flows
The rNPV calculation adjusts each stage’s projected cash flows by the cumulative probability that the drug reaches that stage and eventually gains approval. Industry-standard POS rates, validated by analysis of thousands of development programs, provide the empirical basis for these adjustments.
For a drug entering Phase I, the industry-average cumulative POS to approval runs approximately 7-10% across all therapeutic areas. Oncology historically has lower POS rates than internal medicine. CNS programs have some of the lowest POS rates in the industry, reflecting the difficulty of clinical endpoint selection and brain penetration. A phase-adjusted rNPV model uses the following typical benchmarks, though these vary significantly by indication:
Phase I to Phase II completion: 52-64%. Phase II to Phase III initiation: 28-40%. Phase III to NDA/BLA submission: 57-68%. Submission to approval: 82-90%.
The cumulative figure from Phase I entry to approval averages approximately 7-14% across all areas. That number explains why a single Phase I candidate is nearly worthless as a hedge against a major patent cliff on its own. An analyst who models one Phase I candidate as providing meaningful offset to a $5 billion LOE event has made a categorical error.
Applying rNPV to Measure Strategic Resilience
The rNPV framework’s most useful application for corporate strategy is as a gap analysis tool. Start with the SOTP-derived NPV of the expiring blockbuster. Calculate the total rNPV of the company’s late-stage pipeline assets, weighted by their individual POS rates and peak revenue forecasts. The difference between these two figures is the patent cliff gap: the amount of expected value being destroyed that the pipeline is not expected to replace on a risk-adjusted basis.
A company with a $10 billion drug expiring in four years and a pipeline rNPV of $12 billion has no gap. A company with the same expiring drug and a pipeline rNPV of $3 billion faces a structural problem that M&A or in-licensing will need to address. The rNPV gap analysis quantifies that need and gives BD teams a target size for acquisitions.
The SOTP method values each major product independently and sums them to arrive at total enterprise value. Its specific utility for patent cliff analysis is in making revenue concentration risk explicit and visible to management, boards, and investors.
The standard SOTP calculation assigns a separate DCF or rNPV to each product above a materiality threshold, typically any drug representing more than 5% of total revenue. The resulting breakdown shows, with precision, what percentage of enterprise value is tied to each product and each product’s proximity to LOE.
A company where the top product accounts for 65% of SOTP value and faces LOE in 18 months has a structurally different risk profile than one where no single product exceeds 20% of SOTP value. The former profile is what drives M&A urgency. Companies in that position are compelled to either acquire late-stage assets to diversify the revenue base or accept that they will be significantly smaller enterprises in 36 months and manage their cost structure accordingly.
SOTP is also the correct framework for pricing M&A. If a target company’s SOTP analysis reveals that its primary asset is a late-stage oncology program with strong POS rates and a large addressable market, but the current market cap trades at a 20% discount to SOTP because a concurrent early-stage program is dragging sentiment, a buyer with a high-quality DD process can identify that discount and price a deal accordingly.
Key Takeaways: Foundational Models
DCF analysis quantifies the value being destroyed by a patent cliff, but only if the erosion curve assumption is drug-class-appropriate, meaning biologics require a slower S-curve, not a small-molecule vertical drop. rNPV is the correct tool for valuing pipeline offsets because it incorporates probability-of-failure at each clinical stage. SOTP makes revenue concentration risk explicit and calculable. The rNPV gap analysis, which compares the value being destroyed against the risk-adjusted pipeline value being created, is the most direct quantitative measure of a company’s strategic resilience to its patent cliff.
Measuring Market Reactions: Econometric and Event-Driven Methods
Event Study Methodology: What the Market Actually Knew and When
An event study measures the portion of a stock’s price movement directly attributable to a specific news event by stripping out expected market-wide returns. The method rests on the efficient market hypothesis: prices incorporate publicly available information rapidly. An event study tests that assumption by asking whether a given event moved the stock by more or less than the market model predicted.
Abnormal Returns and the Event Window
The abnormal return (AR) for stock i on day t is the actual return minus the expected return:
AR(i,t) = R(i,t) – E(R(i,t))
The expected return is derived from a market model estimated over a clean estimation window, typically 200-250 trading days ending roughly 30 days before the event to avoid contamination. The event window spans a short period around the announcement, often from two days before to two days after, abbreviated as [-2, +2].
The Cumulative Abnormal Return (CAR) sums the daily ARs across the event window to capture multi-day price reactions to events that unfold over several trading sessions, such as a multi-day court proceeding or a sequenced regulatory announcement.
Statistical significance is tested using a t-statistic. A CAR that is statistically significant at the 5% level indicates that the event caused a price movement distinguishable from noise, that is, the event was genuinely informative to the market.
Which Patent Events Cause Significant Abnormal Returns
The most informative application of event study methodology for patent cliff analysis is distinguishing between anticipated and unanticipated events. A drug losing exclusivity on its long-expected LOE date generates little or no abnormal return. The market has spent years pricing in that outcome. The relevant events to study are those that change the expected timing or magnitude of exclusivity loss relative to prior market expectations.
A surprise PTAB decision invalidating a key secondary patent, particularly one that is part of a carefully constructed thicket, can move a stock 8-15% on the day of the ruling. A successful Paragraph IV filer obtaining a 30-month stay and proceeding to trial narrows the expected LOE range, reducing uncertainty even if the outcome is not yet known. An unexpected FDA decision granting or denying interchangeability designation to a biosimilar has direct implications for the speed and depth of market share erosion for the innovator.
Research on patent infringement verdicts has found statistically significant abnormal returns in both directions around ruling dates, with the magnitude depending on the degree to which the market had anticipated the outcome. Cases where the market had assigned high probability to the innovator winning, and the generic won instead, produce the largest negative abnormal returns. This asymmetry, where surprised negative outcomes generate larger absolute ARs than surprised positive ones, appears consistently in pharmaceutical event study literature.
Using Event Studies to Validate Valuation Models
The most powerful application of event study methodology in a predictive context is model validation. If your DCF model implies that the unexpected invalidation of a key formulation patent should destroy 8% of enterprise value, and an event study of a comparable patent loss at a comparable company shows a mean CAR of negative 7.5%, you have strong empirical support for your valuation assumptions. If your model implies 15% and the empirical result is 4%, your model is mispriced and needs recalibration.
This feedback loop, running event studies on historical patent-related news and comparing the market’s revealed preference to what your intrinsic value models imply, is systematically underused by pharma IP teams and BD functions. It is one of the most data-rich methods for understanding how the market actually prices IP risk in real time.
Regression Analysis: Structural Drivers of Long-Run Stock Performance
While event studies capture discrete shocks, regression analysis identifies the continuous structural relationships between IP-related variables and long-run stock performance. The setup requires a dependent variable, typically quarterly or annual total shareholder return (TSR), and a set of independent variables engineered from patent data, financial data, and pipeline status.
Constructing Predictive Features
Revenue Concentration at Risk is the percentage of total revenue derived from products with less than 36 months of remaining exclusivity. A negative relationship between this variable and forward TSR is the expected sign, and empirical research on pharma equities consistently finds it.
The Pipeline Replacement Ratio compares the total rNPV of late-stage assets (Phase III and NDA-stage) to the remaining NPV of the most significant at-risk product. A ratio above 1.0 implies the pipeline is expected to generate more risk-adjusted value than the at-risk drug will lose. Companies with Pipeline Replacement Ratios above 1.5 have historically outperformed sector benchmarks in the two years following a major LOE event.
Patent Thicket Density can be operationalized as the count of secondary patents (formulation, method-of-use, polymorph, device) filed in the five years preceding a drug’s expected composition of matter expiration date. A higher count signals stronger LCM activity and a more complex competitive entry environment for generic filers.
Active Paragraph IV Challenge Count represents the number of active ANDA-linked Paragraph IV certifications filed against a company’s key products. Each Paragraph IV filing represents a generic company’s assertion that the relevant patents are either invalid or not infringed by the proposed generic. A company facing 15 simultaneous Paragraph IV challenges on its lead product has a materially different risk profile than one facing two or three.
A National Bureau of Economic Research study that used the predictable timing of patent expirations as a natural experiment found that a firm’s R&D spending drops approximately 25% in the two years following a major LOE event. Because the LOE timing is exogenous to current R&D quality, this finding provides clean evidence that the cash flow shock from patent expiration has real, measurable consequences for a company’s future innovation capacity. That post-LOE R&D contraction is a quantifiable leading indicator of reduced long-term pipeline value that can be embedded directly in multi-year predictive models.
Limitations and Diagnostic Checks
Regression models for stock prediction are prone to two systematic problems. Overfitting occurs when a model is trained on a sample long enough to find spurious correlations that do not persist out-of-sample. Standard controls include out-of-sample validation on a holdout period, regularization techniques such as LASSO for variable selection, and cross-validation across different time periods and company sub-samples. Reverse causality is the second concern. Companies with strong stock performance may invest more in patent thicket construction, which means the observed positive correlation between thicket density and future performance may partly reflect omitted underlying firm quality. Instrumental variable approaches or natural experiments, where patent strategy choices are partially driven by exogenous policy changes such as the America Invents Act’s PTAB provisions, can help address this.
Machine Learning and AI-Powered Prediction: The Feature Engineering Imperative
The adoption of machine learning in pharma financial modeling has been uneven. It is common in algorithmic trading at hedge funds and rare in corporate IP strategy functions. The limiting factor is rarely the algorithm. It is the quality and depth of the structured patent data used to engineer predictive features.
Feature Engineering: Turning Patent Data Into Predictive Signals
Machine learning models learn patterns from numerical and categorical inputs. Their predictive power depends entirely on whether those inputs capture economically meaningful variation. A model trained only on patent expiration dates and company financials will have lower predictive accuracy than one trained on a dense feature set derived from claim-level patent analysis, litigation history, regulatory exclusivity status, and biosimilar interchangeability data.
Patent Quality and Impact Metrics
Forward citation count measures how many later patents cite a given patent. A high forward citation count indicates that the cited patent covers technology that subsequent inventors need to work around or build upon, implying high technological centrality and legal strength. Research on pharma IP has found that forward citation count is positively correlated with patent survival in IPR proceedings and with the royalty rates achieved in licensing transactions.
Claim breadth is a more direct measure of a patent’s legal reach. A composition of matter patent with a single independent claim covering an entire class of compounds is broader, and generally more valuable, than one with narrow claims covering only specific stereoisomers. Automating the measurement of claim breadth requires NLP-based patent claim parsing, which is now commercially available from several patent analytics platforms.
Patent family breadth, meaning the number of jurisdictions in which a patent has been filed and granted, signals commercial importance. A company that has pursued patent protection in 40 countries for a formulation patent is signaling that it believes the formulation has commercial relevance in global markets. A patent filed only in the U.S. and EU is cheaper to maintain but more geographically exposed to generic entry in markets outside those filings.
Portfolio Risk and Pipeline Metrics
Weighted Average Remaining Exclusivity (WARE) calculates the revenue-weighted average years of remaining exclusivity across a company’s entire product portfolio. A WARE of 2.5 years means that, on average, each dollar of current revenue has only 2.5 years of remaining patent protection. A WARE of 8 years suggests a well-diversified and forward-extended portfolio. WARE is a single-number summary of portfolio LOE risk that can be tracked over time and compared across peer companies.
A Herfindahl-Hirschman Index (HHI) of revenue concentration, calculated as the sum of squared market share percentages across a company’s product portfolio, provides a standard measure of concentration that can be compared to antitrust benchmarks. A pharmaceutical company with an HHI above 5,000, equivalent to one product accounting for more than 70% of revenue, carries a structurally concentrated revenue base where a single LOE event is existential rather than manageable.
Litigation Risk Scoring
Active Paragraph IV litigation can be converted into a probabilistic risk score using historical outcome data. Variables that predict generic success in Paragraph IV litigation include the generic’s representation by specialized patent litigation firms with strong pharma track records, the number and type of patents being challenged (method-of-use patents are invalidated at higher rates than composition of matter patents in Hatch-Waxman litigation), the complexity of the patent claims relative to the prior art cited by the generic, and whether any of the challenged patents have previously survived IPR proceedings.
A trained classification model using these inputs can generate a probability-of-generic-success score for each active Paragraph IV matter. That score, when combined with the expected revenue impact of generic entry at the challenged patent’s expiration date, produces a probability-weighted expected value reduction that can be fed directly into a DCF or SOTP model.
Model Selection: Tree-Based Models, LSTMs, and Ensemble Systems
Gradient Boosting and Random Forests
Gradient Boosting Machines (GBMs) and Random Forests are the most practical ML algorithms for structured tabular data of the type generated by patent feature engineering. Both build ensembles of decision trees, with GBMs sequentially correcting errors and Random Forests averaging parallel tree outputs. Their key advantage for this application is interpretability through feature importance scores, which rank the engineered features by their contribution to predictive accuracy. A GBM trained on 10 years of pharma company data might reveal that the Pipeline Replacement Ratio and Active Paragraph IV Challenge Count are the two highest-importance features for predicting 12-month TSR, while patent count per se ranks low. That finding is both a model result and a strategic insight.
LSTM Networks for Erosion Curve Prediction
Long Short-Term Memory (LSTM) networks are recurrent neural architectures designed for sequential data. In the pharmaceutical LOE context, they can be trained on the historical post-LOE revenue decay curves of drugs that have already gone off-patent, learning the temporal pattern of erosion as a function of drug type, competitive entry count, and market structure. A trained LSTM can then generate probabilistic forecasts of the erosion curve for a drug approaching LOE, with confidence intervals that reflect the historical range of erosion outcomes for comparable drugs.
The critical input for an LSTM erosion model is a sufficiently large and carefully curated training set. Oral small-molecule cardiovascular drugs, oral small-molecule CNS drugs, injectable biologics in immunology, and infused oncology biologics each have distinct historical erosion patterns. Training an LSTM on a mixed dataset without controlling for these structural differences will produce poorly calibrated outputs. The training set should be segmented by drug class, route of administration, number of generic filers, and whether the drug achieved formulary tier 2 or tier 3 status post-LOE.
Ensemble Architectures for Full-Spectrum Prediction
The most robust commercial implementations combine multiple model types in an ensemble architecture. A representative system might operate as follows: an NLP pipeline first processes full-text patent claims to generate a patent strength score and a claim breadth index for each product in the portfolio. A GBM model then uses those scores, along with financial features, Paragraph IV litigation scores, and pipeline rNPV estimates, to produce a 12-month TSR prediction. Simultaneously, an LSTM model uses the drug’s sales history and comps to predict the post-LOE revenue erosion curve. An ensemble model, a second-stage algorithm, then takes outputs from both the GBM and LSTM as its inputs and generates a final integrated forecast with calibrated confidence intervals.
This architecture is not theoretical. Several quantitative hedge funds with dedicated pharma/biotech strategies have built systems of this general design. The competitive advantage comes not from the algorithmic novelty but from proprietary training data, rigorous feature engineering tied to structured patent intelligence, and disciplined out-of-sample validation.
AI in Patent Landscape Analysis: Improving Upstream Inputs
The quality of inputs to these models depends on the quality of patent intelligence tools. Manual analysis of patent claims for thousands of compounds across global filing jurisdictions is not scalable. AI-powered patent analytics now enables several capabilities that were impractical at scale five years ago.
Semantic claim analysis using transformer-based NLP models can extract the key inventive concepts from patent claims in natural language, enabling automated generation of claim breadth scores without manual attorney review. AI-assisted prior art search can identify the closest prior art documents to a patent’s claims, enabling probabilistic assessment of invalidity risk without full litigation-level analysis. AI-powered freedom-to-operate (FTO) screening can flag whether a proposed biosimilar or generic formulation would likely infringe claims in an innovator’s secondary patent portfolio, guiding both the innovator’s enforcement strategy and the generic’s development choices.
These tools improve the quality of data fed into valuation and predictive models. Better upstream data, specifically more accurate patent strength scores, more precise LOE dates, and better calibrated Paragraph IV risk assessments, produces better model outputs. The investment in AI-assisted patent analytics is an investment in predictive accuracy across every downstream model the IP team or investment function operates.
Key Takeaways: Machine Learning and Feature Engineering
Algorithmic complexity is not the binding constraint in ML-based pharma prediction. Predictive power is determined by the richness and accuracy of the engineered feature set, particularly patent quality metrics such as forward citation count and claim breadth, litigation risk scores derived from Paragraph IV case characteristics, and pipeline metrics such as rNPV and the Pipeline Replacement Ratio. Gradient Boosting models on well-engineered tabular data outperform or match deep learning approaches in most practical pharmaceutical prediction tasks. LSTM models add value specifically in erosion curve forecasting where temporal sequence patterns are the primary signal. Ensemble architectures combining structured patent features with sequential revenue data are the current state of the art.
Case Studies: Lipitor, Plavix, and Humira Under the Microscope
Pfizer’s Lipitor (Atorvastatin): The Archetypal Small-Molecule Cliff
IP Asset Profile
At its 2006 peak, atorvastatin generated $12.9 billion in annual global sales for Pfizer, representing approximately 27% of total company revenue. The foundational composition of matter patents provided U.S. protection through November 2011. Pfizer’s LCM efforts included the co-formulation of atorvastatin with amlodipine (marketed as Caduet), which secured its own patent position and provided a vehicle for migrating patients to a product with a distinct LOE date.
The Pre-LOE Competitive Landscape: Paragraph IV History
Ranbaxy Laboratories filed the first Paragraph IV certification against Lipitor’s patents in 2003, triggering the 30-month stay under Hatch-Waxman and earning the 180-day first-filer exclusivity for generic atorvastatin. Ranbaxy’s Paragraph IV filing was the clearest possible signal to any competent analyst that 2011 would be a contested LOE. The litigation resolved through a settlement in 2008 that authorized Ranbaxy to launch its generic in late November 2011, coinciding with the expected expiration of Pfizer’s key process patents.
An analyst tracking the Paragraph IV docket at the time of the 2008 settlement had the clearest possible picture of Lipitor’s effective LOE: approximately November 30, 2011, subject to Ranbaxy’s manufacturing compliance. Watson, Teva, and other generic manufacturers were lined up behind Ranbaxy for entry after the 180-day exclusivity period, which meant a full multi-filer generic market by mid-2012.
Stock Performance Analysis: The Forward-Looking Market
Pfizer’s atorvastatin revenue followed the expected small-molecule cliff pattern. Worldwide atorvastatin revenues fell from $9.5 billion in 2011 to $3.9 billion in 2012, a 59% decline in a single year. By 2013, revenues had fallen to approximately $2 billion, with the decline continuing as multiple generics competed at commodity prices.
The apparent paradox is that Pfizer’s stock (PFE) returned 22.4% in 2011, the year of the cliff, and 14.2% in 2012. An event study conducted on the November 2011 LOE date would show near-zero abnormal returns, because the market had been pricing this event for years. The stock’s strong performance during the cliff period reflected the market’s assessment of Pfizer’s recovery strategy: the $68 billion acquisition of Wyeth in 2009 had brought Prevnar 13, Enbrel (ex-U.S.), and a diversified portfolio that reduced Lipitor’s relative weight in enterprise value. Pfizer’s aggressive cost restructuring, which included a series of manufacturing site closures and headcount reductions, was being credited as management executing well on a known transition.
The modeling lesson from Lipitor is clean: a model that focuses exclusively on the expiring drug’s revenue path will reach systematically wrong conclusions about stock performance. The market was not modeling Lipitor’s 2012 revenues. It was modeling Pfizer’s 2014-2018 revenues from everything else. A DCF-only analysis of Lipitor’s post-LOE revenues would have suggested significant stock downside. An enterprise-level SOTP that incorporated the Wyeth acquisition’s contribution and the restructuring cost savings would have told a different story.
Investment Strategy Implication
The 2006 failure of torcetrapib, Pfizer’s CETP inhibitor and primary planned blockbuster replacement for Lipitor, generated a significant negative abnormal return when Phase III trial data showed no cardiovascular benefit and possible harm. A sophisticated event study analyst tracking Pfizer in 2006 would have identified that event as the moment when the company’s pipeline replacement buffer was eliminated, increasing the structural risk of the Lipitor cliff substantially. The LOE itself in 2011 was priced in. The pipeline failure in 2006 was the event that mattered.
BMS and Sanofi’s Plavix (Clopidogrel): The Divergence Story
IP Asset Profile
Clopidogrel bisulfate (Plavix) reached peak annual sales of approximately $9 billion, split between Bristol Myers Squibb and Sanofi under their co-promotion agreement. The key U.S. patents expired in May 2012. Like Lipitor, Plavix’s LOE was long anticipated. The Canadian Supreme Court’s ruling in 2007 invalidating Sanofi’s clopidogrel stereoisomer patent was an early signal that the composition of matter protection for specific salt and stereoisomeric forms could be legally vulnerable, a relevant input for any model assessing the durability of the secondary patent thicket.
Paragraph IV Litigation: Apotex and the Failed Settlement
The Plavix Paragraph IV litigation produced one of the most consequential legal and regulatory events in modern pharmaceutical IP history. Apotex filed a Paragraph IV certification against the Plavix patents and engaged in settlement negotiations with BMS and Sanofi in 2006. The parties reached a settlement that would have authorized Apotex to launch a generic in 2011. But the agreement required approval from state attorneys general, and when several objected to what they characterized as an anticompetitive arrangement, the parties withdrew the settlement and the case returned to litigation.
The fallout was severe. The FTC and New Jersey Attorney General investigated the failed settlement. BMS ultimately paid $125 million to resolve FTC claims. More directly, the disruption to the litigation timeline created uncertainty about the final LOE date and, in the near term, produced news events with measurable abnormal returns on BMS stock as the regulatory scrutiny intensified.
For analysts modeling Plavix’s LOE in 2007-2008, the Apotex settlement attempt and its subsequent collapse were information-rich events. They revealed that BMS was willing to pay significant value to extend Plavix’s effective exclusivity, which was itself an implicit signal of how much enterprise value was at stake. They also revealed regulatory risk in reverse payment settlements that would later be clarified by the Supreme Court’s 2013 FTC v. Actavis decision, which established that reverse payment patent settlements can constitute antitrust violations subject to rule of reason analysis.
Stock Performance Divergence: BMS vs. Sanofi in 2012
Bristol Myers Squibb’s stock returned negative 6.9% in 2012. Sanofi’s stock returned positive 27.3% in the same year. Both companies lost the same blockbuster in May 2012. The divergence was driven entirely by the market’s assessment of their respective replacement strategies.
Sanofi’s pipeline had several late-stage assets with strong commercial prospects. Lantus (insulin glargine) remained one of the world’s best-selling drugs with several years of exclusivity remaining. Sanofi’s strategic pivot to diabetes, rare diseases, and emerging markets was viewed favorably. BMS, by contrast, was perceived as more dependent on Plavix and had a thinner near-term pipeline at the time of the LOE. This divergence is the practical demonstration of why SOTP and rNPV gap analysis must be conducted at the enterprise level, not the product level.
Investment Strategy Implication
For event-driven investors, the sequence of Paragraph IV filings, settlement attempts, regulatory interventions, and ultimate litigation outcomes around Plavix generated multiple tradable events across a five-year period from 2006 to 2012. Each outcome either compressed or expanded the probability distribution over the effective LOE date. A model that tracked the litigation docket in real time and updated the expected LOE date accordingly would have generated alpha relative to analysts using a static LOE assumption.
AbbVie’s Humira (Adalimumab): The Biologic Playbook and the Rebate Wall
IP Asset Profile and Thicket Valuation
Adalimumab is a fully human anti-TNF monoclonal antibody, first approved in December 2002 for rheumatoid arthritis and subsequently approved in more than a dozen additional indications including plaque psoriasis, Crohn’s disease, ulcerative colitis, and ankylosing spondylitis. Peak annual global sales reached approximately $21.2 billion in 2022. The number of U.S. patents covering Humira exceeded 250 at the time of biosimilar entry, covering composition of matter, antibody formulations at specific concentrations, device components of the auto-injector pen, dosing regimens, and methods of use across each approved indication.
AbbVie’s patent thicket strategy delayed U.S. biosimilar entry by several years beyond the expiration of the primary composition of matter patents. The mechanism was not primarily litigation victories. It was litigation attrition. Amgen, which launched the first U.S. Humira biosimilar (Amjevita) under a July 2023 settlement agreement, reached that settlement because AbbVie was willing to authorize entry on terms that eliminated the legal uncertainty while preserving meaningful pricing advantages for branded Humira. Each subsequent biosimilar settlement, with companies including Samsung Bioepis, Sandoz, and Coherus, was negotiated individually, with AbbVie controlling the pace.
The IP valuation of AbbVie’s secondary patent thicket on Humira is substantial. The approximately five-year delay in U.S. biosimilar entry relative to what would have been possible with only the primary composition of matter patents translated into hundreds of billions of dollars of cumulative protected revenue. No single secondary patent was responsible for that delay. The thicket’s value came from its aggregate deterrent effect.
AbbVie’s Replacement Strategy: Skyrizi and Rinvoq
AbbVie did not rely on patent litigation alone to navigate the Humira LOE. The company’s replacement strategy centered on two immunology assets developed internally: risankizumab (Skyrizi), an IL-23 inhibitor approved for plaque psoriasis, psoriatic arthritis, Crohn’s disease, and ulcerative colitis, and upadacitinib (Rinvoq), a JAK1 inhibitor approved for rheumatoid arthritis, atopic dermatitis, and multiple other inflammatory conditions.
The rNPV analysis for both assets, conducted by sell-side analysts and AbbVie’s own commercial planning teams in the 2019-2021 period, consistently projected that peak combined annual sales for Skyrizi and Rinvoq could reach $15-20 billion or more by the mid-2020s. AbbVie updated that guidance upward multiple times as the drugs’ clinical profiles expanded. By 2023, with Skyrizi receiving approval in Crohn’s disease and ulcerative colitis, two of Humira’s largest indications by patient volume, the replacement thesis was well-advanced.
Biosimilar Interchangeability and the Rebate Wall
The U.S. biosimilar market for adalimumab has behaved differently from the European experience, where biosimilar penetration was rapid and deep. In the U.S., branded Humira retained substantial market share through 2023 and into 2024, with biosimilar uptake slower than many analysts predicted. The primary mechanism was AbbVie’s rebate wall: the company structured long-term rebate contracts with PBMs and health plans that offered deep discounts on branded Humira in exchange for formulary exclusivity or preferred placement, blocking biosimilars from achieving the formulary positions necessary for meaningful volume.
The FDA had granted interchangeability designation to Cyltezo (adalimumab-adbm, Boehringer Ingelheim) in October 2021, making it the first interchangeable biosimilar for a biologic drug. Interchangeability designation allows pharmacists to substitute the biosimilar for branded Humira without the prescribing physician’s explicit approval in most states, the same automatic substitution mechanism that drives rapid small-molecule generic uptake. Despite this designation, Cyltezo’s market penetration remained limited in 2023 because the rebate wall determined formulary access, not interchangeability status alone.
For any analyst modeling biologic LOE events going forward, the Humira experience has calibrated the expected speed of biosimilar penetration in the U.S. market under a rebate wall scenario. The erosion is real but slow. A well-resourced innovator with a large commercial infrastructure and deep PBM relationships can maintain branded share far longer than the interchangeability designation alone would suggest. The erosion model for a biologic LOE in the U.S. now has a clearly documented analog to reference.
Stock Performance
AbbVie’s stock was essentially flat in 2023, the year of U.S. biosimilar entry. The market entered 2023 already knowing that Humira faced multiple biosimilar launches. The event was anticipated. What the market was watching was the speed of Skyrizi and Rinvoq uptake. As 2023 progressed and both drugs posted accelerating revenue growth, AbbVie’s stock recovered from its early-year pressure and ended the year close to its opening level. AbbVie subsequently provided guidance indicating that Skyrizi and Rinvoq combined were expected to generate more than $27 billion in annual revenue by 2027, which, if achieved, would make them collectively the highest-grossing drug portfolio in pharmaceutical history.
Investment Strategy Implication
The Humira case is the most current template for modeling a large-biologic LOE event. The key variables are: thicket density and settlement negotiation leverage, which determines the timing of competitive entry; the depth and operational effectiveness of the rebate wall, which determines the pace of branded share erosion; biosimilar interchangeability designation status, which is a necessary but not sufficient condition for rapid penetration; and the pipeline rNPV gap, which determines whether the replacement strategy can credibly offset the LOE loss. AbbVie scored well on all four. Companies facing biologic LOE events without a comparable rebate wall infrastructure or comparable pipeline assets should expect faster and deeper erosion.
Key Takeaways: Case Studies
Lipitor demonstrates that the market prices anticipated LOE events years in advance. The stock-relevant events are pipeline failures and M&A, not the LOE date itself. The Plavix/BMS versus Plavix/Sanofi divergence confirms that the same LOE event produces different stock outcomes for different companies based on their replacement pipelines. Humira establishes the biologic LOE template: thicket strategy delays entry, rebate walls slow penetration, and a credible high-rNPV pipeline is the only durable solution. In all three cases, a product-level revenue model fails. Enterprise-level SOTP combined with rNPV gap analysis is the correct framework.
IRA Drug Price Negotiation: A New Variable for Every Model
The Inflation Reduction Act of 2022 introduced Medicare drug price negotiation for the first time in the program’s history. The CMS began negotiating prices for ten drugs with the first negotiated prices effective in 2026, including Eliquis (apixaban), Jardiance (empagliflozin), Xarelto (rivaroxaban), Januvia (sitagliptin), Farxiga (dapagliflozin), Entresto (sacubitril/valsartan), Enbrel (etanercept), Imbruvica (ibrutinib), Stelara (ustekinumab), and Fiasp/NovoLog (insulin aspart).
The IRA creates a structural change in the cash flow profile of pharmaceutical products that every DCF, rNPV, and SOTP model must now incorporate. Under the IRA, small-molecule drugs become eligible for negotiation 9 years after initial approval, and biologics become eligible 13 years after approval. At the point of negotiation, CMS can impose significant price reductions, capped at 25-60% off list price depending on the number of years the drug has been on the market.
The practical effect on DCF models is a kink in the revenue trajectory. Instead of assuming stable net pricing through LOE, analysts must now model a price step-down event when a drug reaches its negotiation eligibility threshold. For late-lifecycle blockbusters, this effectively compresses the period of maximum profitability and lowers the total NPV of the asset, even without accounting for any patent cliff.
For the rNPV framework, the IRA increases the premium placed on innovative drugs that are genuinely differentiated rather than merely incremental. The IRA’s exemption for drugs designated as qualifying single-source (QSS) small molecules or biologics without therapeutic alternatives, and the shorter post-approval period before negotiation eligibility for products that receive multiple indications over time, creates a set of strategic incentives that will shape pipeline investment priorities for the next decade.
BD teams evaluating in-licensing opportunities must now run a dual scenario for any asset with expected peak sales in the Medicare patient population: a base case with IRA negotiation triggering at the relevant milestone, and a no-IRA scenario for the biologic’s first 13 years. The differential between those scenarios represents the valuation risk that the IRA adds to every late-lifecycle pharma asset.
A Tiered Modeling Framework for IP Teams and Investors
Tier 1: Foundational Internal Valuation
Every pharmaceutical and biotech company’s corporate finance function should maintain a living SOTP model with rNPV-based valuations for all pipeline assets above a materiality threshold and DCF-based valuations for all marketed products. The LOE dates, built from the full patent and regulatory exclusivity stack for each product, are the primary inputs. This model drives capital allocation decisions, R&D prioritization, licensing economics, and M&A targeting.
The model should be updated at every material IP event: a new patent grant, a Paragraph IV filing, an IPR petition, a court ruling, or a regulatory exclusivity grant or expiration. Treating LOE dates as static annual assumptions rather than dynamic inputs updated in real time is a systematic source of valuation error.
Tier 2: Market Intelligence and Model Validation
The BD and commercial functions should run systematic event studies on competitor patent events. When a competitor loses a Paragraph IV case, when a biosimilar receives interchangeability designation in a shared therapeutic area, or when a competitive pipeline asset fails Phase III, an event study of the competitor’s stock reaction calibrates the market’s valuation of those events. That calibration informs how your own team should price comparable events in your own drug portfolio.
This tier also includes systematic tracking of the Paragraph IV docket for your own products, monitoring of PTAB petition activity against your patent portfolio, and competitive intelligence on biosimilar development programs targeting your biologics.
Tier 3: Advanced Predictive Modeling
This tier is appropriate for large pharma companies with dedicated analytics functions and for specialized investment funds with concentrated pharma/biotech portfolios. It involves building and maintaining GBM or ensemble ML models trained on historical patent, financial, and pipeline data with engineered features as described above. The models produce forward-looking probability-weighted predictions of stock performance and revenue outcomes, with confidence intervals derived from out-of-sample validation.
Data infrastructure requirements for Tier 3 include access to structured patent data with claim-level detail and global family coverage, historical ANDA and BLA filing data linked to litigation outcomes, Orange Book and Purple Book data with exclusivity tracking, and historical sales data at the product level with quarterly granularity.
Investment Strategy: Building a Patent-Cliff-Aware Pharma Portfolio
For institutional investors, the patent cliff creates both long and short opportunities within the sector. The pattern from Lipitor, Plavix, and Humira, where anticipated LOE events are priced in and the stock-relevant variable is the pipeline replacement, implies a specific screening approach.
Short candidates are companies with a high SOTP-derived revenue concentration in a product with a near-term LOE and a pipeline rNPV gap that the market has not fully priced. The market occasionally misprices the adequacy of a pipeline replacement. When consensus sell-side models project that a pipeline will fill the LOE gap but an independent rNPV analysis with appropriately conservative POS assumptions shows a 40% shortfall, there is a short thesis grounded in fundamental analysis.
Long candidates are companies where the market has discounted the stock due to a high-profile patent cliff but where the pipeline rNPV is either underappreciated or where the company’s biosimilar defense infrastructure, rebate wall depth, and thicket complexity are likely to produce slower-than-expected erosion. AbbVie in 2022, entering the Humira LOE year at a valuation that embedded deep pessimism about biosimilar penetration, was a case where detailed biologic LOE modeling, informed by the European biosimilar market experience and the contractual mechanics of AbbVie’s payer agreements, could have supported a long thesis ahead of what turned out to be a better-than-feared revenue outcome.
The pipeline rNPV gap is the single most informative quantitative signal for both theses. Calculating it accurately requires the LOE date precision, the phase-appropriate POS rates, and the indication-level peak sales estimates that are only available through dedicated pharmaceutical intelligence analysis.
Frequently Asked Questions
How does a Paragraph IV filing affect a DCF model in practice?
A Paragraph IV certification by a generic company initiates a potential 30-month stay of generic approval under Hatch-Waxman. The filing should trigger an immediate revision to the DCF model’s LOE probability distribution. Before the filing, the LOE date is the expected patent expiration. After the filing, the model should assign probability weight to three outcomes: the generic wins and enters early, the innovator wins and the original LOE date holds, or a settlement is reached with an authorized early entry date. Each outcome has a different NPV implication. A model that ignores Paragraph IV filings and maintains a static LOE assumption is systematically miscalibrated.
What distinguishes a strong biologic patent thicket from a weak one for modeling purposes?
A strong thicket has high density across multiple patent categories (formulation, device, method-of-use, manufacturing process), with expiration dates staggered to create deterrence across a multi-year window. It covers multiple jurisdictions with coordinated filing strategies. The individual patents have survived or have not yet been challenged at the PTAB. The weakest thickets are those composed entirely of method-of-use patents, which can be designed around by biosimilar manufacturers who accept a carved-out label, or those composed of device patents where biosimilar manufacturers develop their own delivery systems.
How does the Inflation Reduction Act change the rNPV calculation for early-stage pipeline assets?
For small molecule assets, the IRA negotiation eligibility window (9 years post-approval) means that peak sales projections for large Medicare-patient drugs need to incorporate a price reduction scenario in years 9-15 post-approval rather than assuming price stability through LOE. This compresses the NPV of the asset. For pipeline assets expected to reach substantial revenues in the Medicare population, IRA-adjusted rNPV runs approximately 10-25% lower than pre-IRA rNPV calculations, depending on the drug’s therapeutic area and patient demographics. The magnitude of the IRA haircut should be modeled explicitly rather than hand-waved in the discount rate.
Why do biosimilar interchangeability designations matter for stock modeling if formulary access depends on PBM contracts?
Interchangeability designation is a necessary condition for maximum penetration but not sufficient on its own in the current U.S. market structure. Its stock-modeling relevance is that it removes one of the structural barriers to biosimilar uptake. Without interchangeability, pharmacists cannot automatically substitute the biosimilar, which limits penetration to new patients and physician-directed switching decisions. With interchangeability, the structural mechanism for mass-market substitution is in place. Whether that mechanism is actually activated depends on formulary access. The PBM contract dynamic can suppress penetration temporarily, but as contracts reset at plan-year boundaries and more interchangeable biosimilars enter, the rebate wall’s effectiveness erodes. Interchangeability designation thus shifts the erosion timeline from ‘possibly never achieving high penetration’ to ‘high penetration on a 3-5 year horizon as contracts reset.’ That shift has material implications for the terminal value in a biologic LOE DCF model.
What data sources are required to build a fully operational Tier 3 predictive model?
At a minimum, a Tier 3 model requires structured Orange Book and Purple Book data with full patent and exclusivity listings updated in near-real-time, ANDA and BLA filing data with Paragraph IV certification history and litigation outcome records, global patent family data with grant status and expiration dates by jurisdiction, PTAB IPR petition and decision data, clinical trial phase transition data from ClinicalTrials.gov or commercial databases, and historical quarterly product-level revenue data for a training sample of at least 50-100 drugs with completed LOE events. Platforms such as DrugPatentWatch provide integrated access to much of the patent and regulatory exclusivity data layer, which is the most time-intensive component to build from primary sources.
Copyright considerations: This analysis is original work. Drug names, company names, financial data, and regulatory events referenced are factual public record. Peak sales figures are derived from company earnings reports and public regulatory filings. Litigation outcomes cited reflect documented public court records.