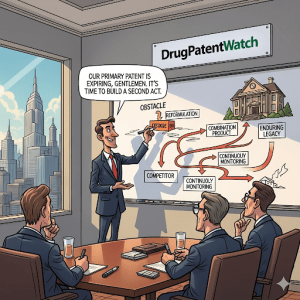
1. Why Late-Stage LCM Has Become a Board-Level Discipline
The pharmaceutical industry is staring at its largest revenue destruction event in history. Between 2025 and 2030, an estimated $236 billion to $300 billion in annual branded drug sales face loss of exclusivity (LOE) in the United States alone. Approximately 190 drugs will lose their market protection during this window, 69 of which qualify as blockbusters by the conventional $1 billion annual revenue threshold. The drugs at the center of this cycle include some of the most commercially dominant molecules ever approved: Keytruda, Eliquis, Stelara, and a roster of second-generation biologics whose combined peak revenues dwarf anything the 2011-2016 patent cliff produced.
The standard industry framing, a ‘patent cliff,’ understates both the severity of the problem and the range of tools available to manage it. A cliff implies a single, violent drop. The actual pattern, as Lipitor and Humira both demonstrated, is more conditional. It depends on how many generic or biosimilar competitors enter the market simultaneously, whether a patent thicket delays that entry by years, how aggressively the major pharmacy benefit managers (PBMs) shift their formularies, and whether the innovator has built the commercial infrastructure to retain its most price-insensitive prescribers. Companies that treat LOE as a predetermined outcome will lose far more revenue than those that treat it as a manageable transition with a specific, dateable timeline and a set of addressable variables.
McKinsey research documented a structural change that compounds the urgency: the window for a new drug to achieve 50% of its lifetime sales has shortened by 18 to 24 months since 2000. Rival products now enter the same disease area within two years of a drug’s launch, compared to 15 years two decades ago. The Inflation Reduction Act accelerated this compression further by introducing Medicare price negotiation at the 9-year mark for small molecules and the 13-year mark for biologics, effectively shortening the revenue runway before government pricing begins. This is not merely a forecasting challenge. It changes the entire NPV architecture of a pharmaceutical asset and demands that lifecycle management planning start at launch, not three years before LOE.
The practical implication for IP teams and R&D leads: the strategies covered in this guide are not defensive afterthoughts. The most commercially effective LCM programs, Pfizer’s Lipitor defense, AbbVie’s Humira patent thicket, and AstraZeneca’s Lynparza partnership with Merck, each required decisions made 6 to 10 years before the revenue impact materialized. Planning that begins 3 to 5 years before LOE captures a fraction of the available value. Planning that starts at launch, or ideally in Phase III when endpoint selection and trial design still have downstream LCM consequences, captures everything.
Key Takeaways: Section 1
The 2025-2030 patent cliff is the largest by absolute revenue volume in pharmaceutical history. Revenue erosion depth and timing depend on six independently variable factors: competitor entry count, patent thicket survival probability, PBM formulary positioning, authorized generic presence, IRA negotiation timing, and successor pipeline readiness. The IRA’s introduction of mandatory Medicare price negotiation has permanently compressed the high-revenue phase for both small molecules and biologics, requiring LCM planning to begin at or before launch. Companies that delay planning to within 3 years of LOE systematically destroy 30% to 50% of recoverable asset value.
2. The Strategic Foundation: 360-Degree Market and Patent Intelligence
Every LCM program that produced outsized commercial results was built on a foundation of intelligence that was richer, more granular, and more forward-looking than what competitors had assembled. The intelligence function in late-stage LCM has two primary inputs: the patent landscape and the clinical/commercial landscape. Most organizations treat these separately, which creates the analytical blind spot that consistently produces suboptimal decisions.
2a. Patent Monitoring as a Predictive Tool
Patent applications in the U.S. are published 18 months after their initial filing date. This creates a 18-month window in which a competitor’s strategic intentions are visible in their filings before any public announcement. A company filing a cluster of extended-release formulation patents for a molecule in the same therapeutic category as your drug is signaling a lifecycle extension program. A company filing method-of-use patents in adjacent indications is signaling an indication expansion. A sudden burst of device-integration patents around a biologic suggests the manufacturer is preparing to defend against biosimilar substitution at the device level.
Systematic monitoring of competitor patent portfolios through platforms like DrugPatentWatch converts this 18-month publication lag into a durable competitive advantage. The analytical task is not just to track individual patents but to identify the strategic pattern they represent: is a competitor building a patent thicket around their primary molecule? Are they constructing the IP foundation for a next-generation reformulation that will enable product hopping? Are they protecting a combination product that would create formulary competition with your drug?
This intelligence directly informs several LCM decisions. If a competitor is 24 months ahead of you in building a once-weekly formulation patent, you have a narrow window to accelerate your own development or to file method-of-use claims on dosing protocols that could complicate their commercial launch. If a competitor has filed a combination product application that pairs their molecule with a complementary agent already in your portfolio, the co-commercialization opportunity may be as large as the defensive threat.
2b. White Space Identification: Finding Uncontested IP Terrain
Patent landscape analysis should identify not only threats but also white space: therapeutic applications, formulation approaches, and patient populations where the composition-of-matter or method-of-use IP around your drug is thin or uncontested. White space analysis is the starting point for indication expansion programs, because it identifies the clinical directions where you can build strong, durable IP protection rather than entering a heavily patented area that will require years of expensive litigation to operate freely within.
The tactical output of white space analysis is a prioritized map of potential lifecycle extension directions, ranked by the combination of clinical plausibility, IP defensibility, regulatory pathway clarity, and commercial market size. IP teams that produce this map 5 to 7 years before the primary composition-of-matter patent expires give R&D teams enough time to design and execute trials that can generate the data required for both regulatory approval and meaningful new patent protection.
2c. Patient and Physician Intelligence: Identifying the Unmet Need That Drives Real-World Value
Patent intelligence tells you what is technically possible and legally defensible. Patient and physician intelligence tells you what is commercially valuable. The most durable LCM initiatives combine both. The sildenafil story at Pfizer, where clinical trial subjects consistently reported an unexpected pharmacological effect that was initially treated as a side effect, is the canonical example. But the modern equivalent is systematic and data-driven rather than serendipitous.
Structured physician advisory programs, electronic health record (EHR) data partnerships, and patient registry analyses generate three specific categories of insight that LCM teams need. First, adherence failure patterns: where in the patient journey are patients abandoning therapy, and what is driving that discontinuation? Inconvenient dosing, injection site reactions, and cost burden each point toward a different LCM intervention. Second, real-world outcome gaps: where does clinical trial performance diverge from real-world effectiveness in specific patient subgroups? These gaps represent both a commercial vulnerability (payers and HTA bodies will cite them) and a potential LCM opportunity (a reformulation or dosing protocol change that closes the gap generates new supporting data and potentially new IP). Third, payer friction points: which characteristics of your current product are being cited by payers as obstacles to preferred formulary status? These often point directly toward the reformulation or HEOR investment that would unlock better market access.
The FDA’s Patient-Focused Drug Development (PFDD) initiative formalizes much of this intelligence-gathering at the regulatory level, and HTA bodies in Europe and the UK have made patient-reported outcomes central to their benefit assessment processes. Building a structured patient intelligence function is not just a commercial best practice; it is increasingly a regulatory and reimbursement requirement.
Investment Strategy: Section 2
Patent publication lag creates a systematic edge for investors who monitor ANDA filings, IPR petition dockets, and new patent application clusters around targeted molecules. A company that has received multiple Paragraph IV certification notices from first-filer generics but has disclosed none in its public filings has a material event pending. Companies with no disclosed patent monitoring program and a major LOE event within 36 months are systematically mis-priced by sell-side analysts who rely exclusively on management guidance for LOE timing assumptions.
Key Takeaways: Section 2
The 18-month patent publication lag converts systematic monitoring into a structural competitive intelligence advantage. White space analysis should drive indication expansion target selection 5 to 7 years before LOE to give clinical teams adequate development time. Patient adherence failure patterns, real-world outcome gaps, and payer friction points are the three specific intelligence inputs that direct the highest-ROI LCM investments. IP and commercial intelligence functions that operate as silos produce systematically worse LCM outcomes than those integrated into a shared analytical framework.
3. Product Performance Audit: What Your Data Is Actually Telling You
The second step in a rigorous LCM program is an audit of the asset itself: not its commercial performance in the abstract, but its performance relative to what patients, physicians, payers, and regulators now require from it. The landscape against which a drug is evaluated shifts continuously during its commercial life. A drug that was first-in-class at launch is often a mid-tier option in a crowded field by year 8. The audit must assess the asset against the current competitive and evidentiary standards, not the standards that existed at approval.
3a. Granular Commercial Decomposition
Total revenue and total market share are the least informative numbers available to an LCM team. The analytically useful decomposition runs along at least four dimensions: geography, prescriber specialty, patient population subgroup, and payer type. Each of these dimensions can reveal different LCM insights.
Geographic decomposition frequently reveals that a drug holds dominant market share in a small number of high-volume specialties or urban markets while quietly losing volume to newer entrants in geographically dispersed or less academically influential settings. This pattern indicates that the drug retains strong advocacy among physicians who know its clinical evidence deeply but is losing ground among prescribers who rely primarily on formulary tier and cost, which is the majority. That asymmetry is the specific problem that late-stage marketing strategy (Section 13) needs to address.
Prescriber specialty decomposition often shows that a brand retains strong advocacy among academic specialists while losing market share to generics and newer agents among primary care physicians. For drugs that cross specialty boundaries, whether an immunology biologic used by both rheumatologists and dermatologists, or an anticoagulant prescribed by cardiologists, hematologists, and internists simultaneously, understanding the specialty-level retention dynamics is critical to directing medical education investment.
Patient population decomposition, powered by EHR and claims data, is the most actionable because it can identify subpopulations where the drug shows superior real-world outcomes relative to its competitors. Those subpopulations become the focus of the prospective real-world evidence (RWE) generation program, which is the commercial and payer strategy foundation described in Section 4 of the pricing analysis.
3b. Pharmacovigilance as an LCM Asset
The post-marketing pharmacovigilance database for a drug that has been on the market for 10 years represents one of the most underutilized assets in its IP and commercial profile. Regulatory agencies require post-marketing safety surveillance as a condition of approval, and most organizations treat the resulting data as a compliance obligation rather than a commercial resource.
The strategic framing should be the opposite. A drug with 10 years of post-marketing safety data covering millions of patient-years of exposure has an evidentiary advantage over every competitor that launched more recently, and a categorical advantage over every generic that can demonstrate bioequivalence but carries no long-term safety evidence of its own. The HEOR team’s task is to convert this safety database into a quantified long-term safety narrative: what is the 10-year incidence of adverse events of clinical interest? How does that compare to published data on competing agents or, where available, to real-world data on switch patients who moved from the branded drug to a generic? For biologics, where immunogenicity profiles can shift over time and with manufacturing changes, the long-term safety database is particularly valuable, because biosimilars cannot make equivalent long-term safety claims at launch.
Pharmacovigilance data can also reveal signals that become LCM opportunities. Consistent observations of unexpected clinical effects, whether positive (unexpected disease-modifying activity, patient-reported quality-of-life improvements beyond the primary endpoint) or negative (adverse effect patterns concentrated in specific genetic subgroups that might be avoided with a reformulated delivery system), are raw material for hypothesis-driven research programs that can generate both new clinical data and new IP.
3c. Real-World Evidence as a Payer Strategy Instrument
Randomized controlled trials prove that a drug works under optimal conditions. Payers, health technology assessment bodies, and integrated delivery networks decide formulary placement and utilization management policy based on evidence of what happens in their specific patient populations under real-world conditions. That gap between RCT evidence and real-world performance is where many late-stage products are most commercially vulnerable, and it is where a proactive RWE program can rebuild a defensible evidence base.
The three categories of RWE that produce the highest return on investment in the late stage are: long-term effectiveness and safety studies in patient populations excluded from the original pivotal trials (elderly patients with multiple comorbidities, patients on polypharmacy regimens, pediatric populations); comparative effectiveness studies against the actual current standard of care rather than the comparators used in the pivotal trials; and healthcare resource utilization (HCRU) analyses that quantify downstream cost savings attributable to better disease control on the branded agent. The last category is the most commercially powerful because it directly addresses the payer’s primary concern, which is total cost of care rather than the cost per prescription.
A prospective HCRU study showing that a branded anticoagulant reduces stroke-related hospitalization by 15% in a high-risk elderly population is worth significantly more in a formulary negotiation than a retrospective claims analysis showing bioequivalence between the branded drug and its generic competitor. Payers can price a guaranteed outcome; they cannot price a claim of equivalence that is already assumed under standard substitution policy.
Key Takeaways: Section 3
Total revenue and market share are the least informative metrics for LCM planning. Geographic, specialty, and population decomposition identify the specific patient subgroups and prescriber segments that represent the drug’s defensible commercial core. A 10-year post-marketing safety database is a durable competitive asset that generics and biosimilars cannot replicate, and it should be quantified and packaged as a payer value argument rather than treated as a regulatory compliance record. HCRU analyses showing downstream cost savings in high-risk populations are the most commercially powerful RWE investment in the late stage.
4. IP Asset Valuation: Pricing the Patent Portfolio as a Core Balance Sheet Item
4a. Why Standard Accounting Fails to Capture Patent Portfolio Value
Standard pharmaceutical financial statements do not assign a current market value to an in-force patent portfolio. The balance sheet carries drug development costs at historical cost or at the value assigned in an acquisition, neither of which reflects the forward-looking revenue protection the patent provides. For LCM analysts, this accounting convention creates both a valuation gap and an analytical opportunity: the actual value of a late-stage drug’s IP position can be estimated using a probability-weighted DCF framework that most sell-side models do not apply with sufficient granularity.
The core inputs to a pharmaceutical patent portfolio valuation are: (1) the revenue at stake, measured as peak or current annual revenues; (2) the terminal LOE date under the most conservative realistic interpretation of the patent thicket; (3) the probability that secondary patents survive Paragraph IV challenges and PTAB inter partes review; (4) the number of years of revenue protection that secondary patents add beyond the composition-of-matter expiry; and (5) the expected post-LOE revenue tail under the assumed generic entry scenario. Each of these inputs requires judgment and carries uncertainty, but applying explicit probabilities to each produces a materially more accurate asset value estimate than simply using the latest Orange Book expiry date.
4b. The Humira Portfolio: A Quantitative Benchmark
AbbVie’s adalimumab (Humira) portfolio is the most analytically useful benchmark for biologic patent portfolio valuation in pharmaceutical history, because the outcome is now known. The composition-of-matter patents on adalimumab expired in 2016. AbbVie filed 247 patent applications on Humira in the U.S., with 89% filed after the drug’s initial FDA approval in 2002. The resulting patent thicket generated settlement agreements with every major U.S. biosimilar developer, collectively deferring commercial biosimilar launch until January 2023.
The quantifiable value of this seven-year delay: AbbVie’s U.S. Humira revenues from 2016 through 2022 totaled approximately $100 billion. Had biosimilars entered in 2016 when the core molecule patents expired, the European experience (where biosimilars launched in 2018 and captured 60% market share within 18 months) suggests that U.S. Humira revenues during that period would have been approximately $25 billion to $30 billion. The patent thicket therefore protected approximately $70 billion to $75 billion in U.S. revenues above what the composition-of-matter patent alone would have generated.
The I-MAK analysis placed the excess healthcare system cost attributable to this delay at $14.4 billion. AbbVie’s investors earned the remainder. The legal cost of building and enforcing the thicket, primarily filing fees, prosecution costs, and litigation expenses across multiple venues, was in the range of $500 million to $1 billion across the full period. The return on that investment is among the highest in any industry.
For IP teams analyzing their own portfolios, the Humira benchmark provides a calibration point. A biologic with $5 billion in U.S. annual revenues, a composition-of-matter patent expiring in 2026, and a secondary patent portfolio that plausibly extends effective exclusivity to 2030 has an IP portfolio protecting approximately $20 billion in U.S. revenues beyond what the core patent would secure. If the secondary patent portfolio has a 60% probability of surviving biosimilar challenges (a reasonable assumption for a well-constructed thicket), the expected value of that IP protection is approximately $12 billion. That number should appear explicitly in any M&A analysis or capital allocation decision involving the asset.
4c. The PTAB Discount
PTAB inter partes review (IPR) petitions impose a material discount on secondary pharmaceutical patent values that most IP valuation models underweight. The institution rate for pharmaceutical patent IPR petitions has historically ranged from 60% to 70%. Among petitions that are instituted, the PTAB issues final written decisions that invalidate the challenged claims in whole or in part approximately 75% of the time. The combined probability that a challenged secondary pharmaceutical patent survives intact through a full IPR proceeding is therefore in the range of 22% to 25%, before district court appeals.
Importantly, the PTAB applies a lower burden of proof than federal district courts: preponderance of the evidence rather than clear and convincing evidence. This means secondary patents covering incremental innovations, specifically formulation improvements, new salt forms, crystalline polymorphs, and dosing protocols, are more vulnerable at the PTAB than at district court, and patent thicket valuations must reflect this. A secondary patent that has not yet been the subject of an IPR petition should carry a probability weight of approximately 60% to 65% in an IP valuation model. A secondary patent for which an IPR has been instituted but not yet decided should carry a probability weight of approximately 25%.
4d. Lipitor’s IP Portfolio at Peak Value
Pfizer’s atorvastatin (Lipitor) portfolio at its 2006 revenue peak of $12.9 billion provides the canonical small molecule valuation benchmark. The core composition-of-matter patent (U.S. Patent No. 4,681,893) was scheduled to expire in November 2011, with a patent term extension (PTE) already applied. Pfizer had filed secondary formulation and salt patents extending Orange Book listings into 2017. At 2006 revenues and a 75% probability that secondary patents would survive Paragraph IV challenges (they ultimately did not fully survive, and generic entry began on schedule in November 2011), the NPV of the remaining atorvastatin IP protection at a 10% discount rate was approximately $35 billion to $40 billion, making it the most valuable pharmaceutical IP asset in the world at that time.
By 2009, with LOE three years closer, peak revenue forecasts being trimmed, and the litigation landscape clarifying, the NPV had compressed to approximately $18 billion to $22 billion. This progressive compression in IP NPV as LOE approaches is a systematic and investable signal: the market price of a branded drug company’s shares should mechanically decline as the gap between current revenues and post-LOE revenues narrows, unless successor pipeline assets replace the lost NPV. When a company’s share price does not reflect this compression during the 3-to-5-year pre-LOE window, the position is systematically overvalued.
Investment Strategy: Section 4
IP portfolio valuation based on probability-weighted DCF modeling produces systematically different LOE NPV estimates than naive Orange Book expiry date lookups. Investors should build three-scenario IP valuation models for every major pharma holding with a primary LOE event within 5 years: a ‘thicket holds’ scenario using the latest secondary patent expiry date, a ‘core patent only’ scenario using the composition-of-matter expiry, and a ‘at-risk entry’ scenario using an assumed 18-month early launch. Probability-weight the three scenarios using PTAB institution history, pending IPR petition data, and the number of Paragraph IV filers on record. The expected NPV from this exercise typically differs from sell-side consensus by 15% to 35% in the 3-to-5-year pre-LOE window, which is where the alpha lives.
Key Takeaways: Section 4
Standard accounting does not reflect forward-looking IP protection value. The Humira patent thicket protected approximately $70-75 billion in U.S. revenues beyond what the composition-of-matter patents alone would have secured. PTAB IPR proceedings impose a 22-25% survival probability on challenged secondary pharmaceutical patents, requiring explicit discounting of thicket value in IP valuation models. The Lipitor IP portfolio at $35-40 billion peak NPV and Humira’s $70-75 billion protected revenue are the primary calibration benchmarks for pharmaceutical patent portfolio valuation at scale.
5. The R&D Extension Playbook: Indication Expansion, Reformulation, and Combination Products
5a. Indication Expansion: The Capital-Efficient Path to New Revenue Streams
Drug repurposing, specifically the systematic identification and clinical development of new therapeutic uses for an approved compound, is the highest return-on-investment R&D strategy available in the late lifecycle stage. The cost of a repurposing program runs approximately $300 million with a development timeline of 3 to 12 years, compared to the Tufts CSDD estimate of $2.6 billion and 10 to 15 years for a new chemical entity. More importantly, Phase II success rates for repurposing programs are materially higher than for de novo development because the fundamental safety questions, including tolerability, drug interactions, and long-term organ toxicity, have already been answered in years of post-marketing use.
The regulatory mechanism for a new indication in the U.S. is the Supplemental New Drug Application (sNDA), which requires clinical data supporting the new use but does not require the full CMC and preclinical package demanded for a new NDA. A successful sNDA generates three years of new clinical investigation exclusivity for the new indication under FDA regulation 21 CFR 314.108(b)(5). This exclusivity does not block generic applications for the original indication, but it does prevent any competitor from relying on the sponsor’s clinical data for the new use during the three-year window, giving the innovator a head start in establishing clinical precedent and market share before generic follow-on applications are submitted.
The most durable protection from an indication expansion program comes not from the sNDA exclusivity but from the new method-of-use patent. A new indication generates a new patentable method: the use of compound X to treat disease Y in patient population Z. If the indication is sufficiently novel, the method-of-use patent has a 20-year term from filing and, if issued before or during the sNDA submission, begins accumulating term while the FDA reviews the application. For drugs with a crowded primary indication space, a method-of-use patent in an adjacent indication can produce more durable revenue protection than any reformulation patent.
The sildenafil story illustrates the category-defining upside: Pfizer’s discovery of sildenafil’s activity in erectile dysfunction came from a side-effect observation in angina clinical trials. The resulting pivot created a multi-billion-dollar franchise that eclipsed the original development program in commercial value. The modern equivalent is AI-driven target identification, where machine learning models screen an approved compound’s known mechanism of action and receptor binding profile against published disease biology databases to identify high-probability new indication hypotheses before any clinical work begins.
5b. Indication Expansion Case Study: Lynparza (Olaparib) and IP Valuation
AstraZeneca’s olaparib (Lynparza), initially approved as a PARP inhibitor for BRCA-mutated ovarian cancer in 2014, illustrates how a systematic indication expansion program compounds IP value over time. By 2023, olaparib had received regulatory approval for five distinct tumor types: ovarian, breast, prostate, pancreatic, and gastric cancers, plus additional approvals for specific genetic subpopulations within those indications. Each approval generated a new method-of-use patent filing, a new sNDA-derived exclusivity period, and a new clinical data package supporting payer value arguments in the relevant oncology specialty.
AstraZeneca’s 2017 collaboration with Merck, under which Merck agreed to pay up to $8.5 billion to co-develop and commercialize Lynparza, was in part a transaction in which Merck was purchasing access to AstraZeneca’s indication expansion pipeline for the molecule and the synergies between Lynparza and Keytruda in combination oncology studies. The deal valued Lynparza’s future indication expansion potential at a multiple that reflected the IP protection those expansions would generate, not merely the revenue of the approved indications at the time of signing. The IP-generated optionality was the primary commercial rationale.
For IP teams, the Lynparza model provides a structured template: launch in the most approvable indication first to generate clinical data and establish safety precedent; file method-of-use patents for subsequent indications based on biomarker-defined subpopulations where the mechanism of action predicts differential efficacy; run a parallel indication expansion program across three to four concurrent development programs to maintain a continuous pipeline of sNDA filings; and structure co-development partnerships around indications where a partner’s complementary agent creates combination therapy opportunities that neither company can efficiently exploit alone.
5c. Reformulation: Converting Patient Experience Failures into IP Opportunities
A reformulation program targets the gap between the drug’s clinical efficacy and its real-world performance, which is driven by adherence. If patients do not take the drug as prescribed, the clinical trial data overstates real-world effectiveness, and payers who observe the real-world underperformance will cite it in formulary negotiations. Reformulation closes this gap and generates new IP in the process.
The most commercially impactful reformulation strategies address three specific failure modes. Frequency burden: a drug that requires twice-daily dosing creates twice the opportunity for missed doses as a once-daily alternative. Developing an extended-release formulation that supports once-daily dosing generates new formulation patents covering the excipient matrix, the release kinetics, and the manufacturing process, along with clinical data showing improved adherence and outcomes. Administration barrier: a drug that requires clinic administration creates access and adherence barriers that a self-administered alternative eliminates. The shift from IV to subcutaneous formulation has been commercially decisive for multiple biologics. Sensory tolerability: injection site pain, tablet size, and taste in oral dispersible formulations are low-profile problems in clinical trials that drive significant real-world discontinuation. Reformulations that address these problems generate patient preference data that can support payer negotiations and new IP.
The Suboxone (buprenorphine/naloxone) film is the most analytically instructive reformulation case study because it was commercially successful, generated meaningful new IP, and triggered subsequent antitrust scrutiny, each of which informs the risk-adjusted calculus for modern reformulation programs. Indivior’s switch from sublingual tablet to sublingual film produced a patient preference result of approximately 80% in favor of the film and created a new formulation patent that extended effective market protection for the franchise. The commercial transition was so successful that the FDA later became concerned that Indivior’s withdrawal of the tablet from the market, combined with the film’s patent protection, was designed primarily to prevent generic substitution rather than to improve patient outcomes. This ‘product hopping’ concern, and the subsequent antitrust litigation and settlement, is a regulatory and legal risk that reformulation strategies must explicitly model.
5d. Combination Products: Creating New Protected Entities
A fixed-dose combination (FDC) product takes two or more compounds with established safety and efficacy profiles and formulates them together in a single dosing unit. The strategic advantage of an FDC is that it creates a new, patentable pharmaceutical entity with its own NDA, its own Orange Book listings, and its own exclusivity protections, even though neither active ingredient is new. The clinical bar for approval is demonstrating that the combination is safe and at least as effective as the individual components administered concomitantly. The regulatory pathway is a standard NDA, not an sNDA, because the combination itself is a new drug product.
AstraZeneca’s Symbicort (budesonide/formoterol) achieved peak annual revenues above $2 billion by combining an inhaled corticosteroid with a long-acting beta agonist in a single inhaler device. The clinical argument was straightforward: patients with asthma or COPD who require both drug classes have better real-world adherence when they use one inhaler twice daily than when they use two separate inhalers on different schedules. The device integration itself generated additional patents covering the inhaler mechanism and the breath-actuated dosing system, layering device IP on top of the formulation IP that covered the specific budesonide/formoterol powder blend.
For LCM teams evaluating FDC opportunities, the prioritization framework has four criteria: does the combination have established clinical rationale based on complementary mechanisms? Is the commercial market for the separate components large enough to justify the development cost? Can the FDC be protected by a combination of formulation, device, and method-of-use patents that provide at least 8 to 10 years of effective exclusivity from launch? Will the resulting product qualify for independent formulary placement rather than being treated as a premium version of an existing generic combination?
The last criterion is increasingly important as payers scrutinize FDC approvals for signs of patent evergreening without genuine clinical value. An FDC that replaces a commonly prescribed off-label combination with no improvement in efficacy, safety, or adherence will face formulary pushback regardless of its IP protection.
Key Takeaways: Section 5
Indication expansion generates both sNDA-derived 3-year exclusivity and method-of-use patents with 20-year terms, making it the most IP-durable R&D LCM strategy. The Lynparza partnership structure demonstrates how indication expansion optionality is valued in BD transactions, often more highly than the revenue of approved indications at signing. Reformulation programs must explicitly model the antitrust risk of product hopping as defined in New York v. Actavis (2015) when withdrawal of the original formulation is part of the commercial transition plan. FDC development should meet all four prioritization criteria: clinical rationale, market size, IP durability of at least 8-10 years, and independent formulary value.
6. Technology Roadmap: Biologic Lifecycle Extension from Molecule to Device
The technology roadmap for biologic lifecycle extension operates across five distinct dimensions simultaneously, each with its own development timeline, IP strategy, and regulatory pathway. Organizations that execute on only two or three of these dimensions typically leave the equivalent of several years of exclusivity protection on the table. The full roadmap requires coordinated execution across formulation chemistry, protein engineering, device design, indication strategy, and next-generation molecule development.
6a. Dimension 1: Formulation Optimization
For a subcutaneous biologic, formulation optimization centers on three parameters: concentration, buffer system, and excipient composition. Higher-concentration formulations allow smaller injection volumes, which improves patient experience and reduces administration time. Citrate-free formulations (AbbVie’s key reformulation of adalimumab) reduce injection site pain by eliminating the citrate buffer that activates pain receptors in subcutaneous tissue. Both modifications generate new formulation patents that are legally independent of the core molecule patents and can carry Orange Book or Purple Book listings that trigger their own certification requirements from biosimilar developers.
The development timeline for a high-concentration, citrate-free reformulation of an existing biologic runs 18 to 36 months from formulation screening to BLA supplement submission, depending on whether new clinical bridging studies are required to demonstrate bioequivalence to the prior formulation. The IP generated is typically a composition patent covering the specific concentration and buffer system combination, a process patent covering the manufacturing steps required to achieve that concentration without aggregation, and potentially a device patent if the new formulation requires a modified autoinjector to accommodate the higher viscosity.
6b. Dimension 2: Device Integration
Autoinjector and prefilled syringe device patents are legally independent of drug patents and are prosecuted through the same USPTO mechanism, but they are listed separately in FDA submissions as combination product components. A biosimilar developer who wants to market their product in a prefilled autoinjector must either design their own device (requiring separate human factors studies, usability engineering documentation, and device-specific bridging data) or license the device design from the reference product sponsor.
The device IP strategy for a biologic lifecycle extension program should be developed in parallel with formulation optimization, because the device must accommodate the formulation’s specific viscosity, fill volume, and shear sensitivity. A device patent that is commercially essential, meaning the device genuinely improves patient self-administration success rates as demonstrated in human factors studies, is substantially more defensible than a device patent covering cosmetic or convenience features with no functional clinical significance. The Orange Book listing of device patents is currently a regulatory gray area for biologics (the Purple Book does not list device patents), but the FDA’s 2022 guidance on combination product lifecycle management clarified that device components are subject to their own substantial equivalence and performance requirements, which effectively imposes a development burden on biosimilar developers seeking to offer an equivalent device.
6c. Dimension 3: Subcutaneous Reformulation of IV Biologics
Several oncology and immunology biologics that were originally approved as intravenous infusions have been reformulated for subcutaneous self-administration using recombinant human hyaluronidase (rHuPH20, marketed by Halozyme as the ENHANZE drug delivery technology). The SC formulation reduces administration time from 1 to 3 hours to approximately 5 to 8 minutes, eliminates the requirement for intravenous access, and shifts the site of care from infusion centers to the home or physician’s office.
Johnson & Johnson’s Darzalex Faspro (daratumumab plus hyaluronidase), approved in 2020, is the most commercially impactful example. By the time biosimilars of the original IV daratumumab (Darzalex) begin entering the U.S. market, Darzalex Faspro has already become the clinical standard of care for multiple myeloma treatment. Prescribers and patients who have transitioned to the SC formulation have no clinical or logistical incentive to switch back to an IV biosimilar. The ENHANZE technology is itself protected by Halozyme patents that run to 2033, providing a secondary layer of IP protection that is entirely independent of the daratumumab patents.
For any biologic currently administered intravenously with annual revenues above $2 billion, the SC reformulation calculus should be modeled explicitly. The development cost of an SC reformulation using rHuPH20 is typically $150 million to $300 million. The commercial value of establishing the SC product as the standard of care before IV biosimilar entry is a function of the IV revenues at risk and the expected speed of IV biosimilar penetration. For Darzalex, with IV revenues of approximately $4 billion at the time of the Faspro approval, the SC reformulation effectively removed the majority of that revenue base from the IV biosimilar opportunity.
6d. Dimension 4: Indication Expansion with Biomarker Stratification
In oncology, the most durable biologic lifecycle extension programs use biomarker stratification to create indication expansions that are both clinically differentiated and IP-protected in ways that are difficult to design around. A method-of-use patent covering the use of a biologic to treat a tumor type defined by a specific genetic alteration, for example a PD-L1 expression threshold or a tumor mutational burden cutoff, is substantially narrower than a broad tumor-type patent but is also substantially more defensible because the claim construction is tied to a specific patient population definition that is clinically and scientifically rigorous.
Keytruda’s 40-plus indication approvals in the U.S. are, among other things, a systematic biomarker-stratified indication expansion program. Each approval in a new tumor type or patient population creates a new method-of-use patent with its own 20-year term, a new 3-year sNDA exclusivity period, and a new body of clinical evidence that biosimilar developers of pembrolizumab will need to reference or replicate for each indication they seek approval in. The totality of Keytruda’s indication expansion program creates a legal landscape in which a pembrolizumab biosimilar faces not a single patent thicket but a different set of method-of-use patents for each of the more than 40 approved indications, dramatically increasing the cost and complexity of biosimilar commercialization across the full indication space.
6e. Dimension 5: Next-Generation Molecule Development
The biobetter strategy involves developing a next-generation biologic that shares a mechanism of action with the reference product but incorporates molecular engineering improvements that produce superior clinical outcomes, a differentiated safety profile, or a materially more convenient dosing schedule. A biobetter is a new molecular entity requiring a full BLA, but it benefits from the mechanistic and clinical precedent established by the reference product.
AbbVie’s execution of this strategy with Skyrizi (risankizumab) and Rinvoq (upadacitinib) set the contemporary standard. Both drugs address the same autoimmune disease populations as Humira. Both were in Phase III trials while Humira was still generating $21 billion annually. By the time U.S. Humira biosimilars began meaningfully eroding revenues in 2024, Skyrizi and Rinvoq combined were on a trajectory to reach $30 billion in annual revenue by 2027. AbbVie’s total revenue in 2024 was actually higher than in 2022, despite Humira’s 58% U.S. revenue decline, because the succession planning was executed with enough lead time to overlap the revenue curves.
The critical planning parameter for the biobetter dimension is the overlap interval: the period during which the reference product is still generating peak revenues and the next-generation molecule is advancing through late-stage clinical development. This overlap must be at least 5 years to provide adequate clinical development time and allow for pre-commercial investment in the successor’s market access and payer strategy before the reference product begins its LOE decline.
Key Takeaways: Section 6
The biologic LCM technology roadmap runs across five concurrent dimensions: formulation optimization, device integration, SC reformulation of IV products, biomarker-stratified indication expansion, and next-generation biobetter development. The Darzalex Faspro SC reformulation effectively pre-empted the majority of IV biosimilar commercial opportunity. Keytruda’s biomarker-stratified indication expansion creates a distinct method-of-use patent challenge for biosimilar developers in each of 40-plus approved indications. AbbVie’s Skyrizi/Rinvoq succession program is the canonical model for biobetter revenue overlap planning, requiring at least 5 years of parallel development to achieve meaningful revenue curve overlap.
7. The Legal Fortress: Building and Defending Patent Thickets
7a. What a Patent Thicket Actually Is and Why It Works
A patent thicket is a cluster of overlapping patents, each individually valid, that collectively makes it legally impractical for a competitor to bring a competing product to market without either invalidating multiple patents through litigation, designing around all of them simultaneously, or negotiating a licensing arrangement with the patent holder. In pharmaceutical markets, the thicket strategy exploits the economics of patent litigation: even a low-probability-of-success patent creates a costly litigation obligation for a challenger, and when a thicket contains dozens of patents covering different aspects of a product, the aggregate litigation cost of clearing the entire field can exceed the NPV of the generic or biosimilar opportunity.
The Hatch-Waxman Act’s 30-month automatic stay mechanism amplifies the thicket’s deterrent value for small molecules. Each Orange Book-listed patent that a generic filer challenges via Paragraph IV certification triggers a potential 30-month delay in ANDA approval if the brand files suit within 45 days. A brand that lists 10 patents in the Orange Book covering formulations, methods of use, and dosing regimens can, in principle, generate multiple rounds of litigation even against a single generic filer, each adding to the cumulative delay. Congress limited the use of ‘stay stacking’ in the Medicare Modernization Act of 2003 by restricting each ANDA filing to a single 30-month stay, but the deterrent effect of a complex thicket remains substantial.
7b. The Humira Thicket: Category Structure and Timeline
AbbVie’s Humira patent thicket is the most studied in pharmaceutical history because the commercial outcome is now fully documented. Understanding its structure is essential for any IP team building or evaluating a biologic patent defense.
Patent Category
Description
Approximate Filing Range
Composition of Matter
Core adalimumab antibody sequence and structure
1996-2000
New Indications
Method-of-use patents for Crohn’s, UC, psoriasis, PsA, AS
Methods of use in combination with methotrexate or other agents
2008-2015
The critical observation is that 89% of AbbVie’s 247 Humira patent applications were filed after the drug’s initial FDA approval. This is not coincidental. Post-approval filings are by definition secondary patents covering improvements, new uses, and manufacturing refinements rather than the original molecular invention. Their value is not in protecting the scientific breakthrough but in expanding the legal perimeter around a commercially validated product.
Biosimilar developers challenging the Humira thicket faced a choice: litigate every relevant patent at enormous expense and over many years, or negotiate a settlement that deferred market entry in exchange for license rights and a defined launch date. Every major U.S. biosimilar developer chose settlement. AbbVie’s thicket strategy succeeded not because the patents were individually unassailable but because the aggregate cost of clearing them all exceeded the NPV benefit of an earlier launch for each individual challenger.
7c. Constructing a Defensible Thicket: What the Patent Must Actually Cover
The post-Actavis antitrust environment and the PTAB’s active invalidation of secondary pharmaceutical patents impose two substantive requirements on patent thicket construction that prior generations of IP strategy could ignore. First, each patent must cover a genuine innovation that provides clinical, manufacturing, or patient-experience benefit. A patent on a crystalline polymorph of a drug that shows no difference in dissolution or bioavailability compared to the marketed polymorph is highly vulnerable to PTAB invalidity proceedings on obviousness grounds. A patent on a citrate-free formulation that demonstrably reduces injection site pain in published clinical data is much more defensible.
Second, the commercial transition strategy must not include market withdrawal of the original formulation, because the combination of reformulation and withdrawal triggers antitrust exposure under New York v. Actavis (2015). The Second Circuit’s analysis in that case established that when a brand company reformulates a product and then discontinues the original formulation before generics of the original can substitute at retail, the conduct can constitute an unlawful exclusionary practice if the primary purpose is to prevent generic substitution rather than to improve the therapeutic product. Modern thicket strategy must sequence the introduction of new formulations and the phasing out of old ones in a way that can be justified on clinical or operational grounds independent of the generic timing.
Key Takeaways: Section 7
Pharmaceutical patent thickets work because the aggregate litigation cost of clearing multiple overlapping patents exceeds the NPV of earlier generic or biosimilar market entry for individual challengers. The Humira thicket generated approximately $70-75 billion in protected U.S. revenues beyond the composition-of-matter expiry at an estimated IP maintenance cost of $500 million to $1 billion. Post-Actavis antitrust doctrine requires that each secondary patent cover a genuine clinical or manufacturing innovation and that market withdrawal of original formulations be sequenced to withstand independent clinical or operational justification.
8. Patent Term Extension and Adjustment: Mechanics and Maximum Recovery
8a. Patent Term Extension: Recovering Regulatory Review Time
The Hatch-Waxman Act authorizes the USPTO to extend the term of a single patent per approved drug to compensate for time spent in FDA regulatory review. The extension is calculated as one-half of the time spent in clinical trials (from IND filing to NDA submission) plus the full duration of the FDA review period (from NDA submission to approval), subject to a maximum extension of five years and a ceiling that the post-extension remaining patent life cannot exceed 14 years from the date of first FDA approval.
The strategic selection of which patent to extend is non-trivial. The optimal choice is the patent with the latest natural expiry date among those eligible for extension, because the 14-year ceiling applies to the patent’s post-extension term from the FDA approval date, not from the patent’s original filing date. For a drug approved in year 8 of its composition-of-matter patent’s 20-year term, the ceiling is 14 years from approval, or year 22 from the original filing date. Selecting a formulation patent with a natural expiry later than the composition-of-matter patent as the PTE recipient can produce a longer effective exclusivity extension than selecting the core molecule patent.
European Supplementary Protection Certificates (SPCs) function analogously to PTEs in the U.S. but with a calculation method tied to the gap between the filing date of the basic patent and the date of first EU marketing authorization, subject to a maximum SPC term of 5 years. SPCs are granted at the national level in each EU member state, making global biologic lifecycle management a coordination challenge across multiple patent offices with different procedural requirements.
8b. Patent Term Adjustment: Recovering Office Delay
Patent Term Adjustment (PTA) compensates patent holders for delays caused by the USPTO during the patent examination process. Under the American Inventors Protection Act of 1999, the USPTO is required to act on patent applications within specified time periods. When the USPTO fails to meet these periods, including failing to issue a final office action within 14 months of filing, failing to respond to applicant submissions within 4 months, or failing to issue a patent within 3 years of filing absent applicant delays, each day of resulting delay is added to the patent term.
For complex pharmaceutical patents that spend multiple years in examination due to restriction requirements, inter partes examination proceedings, or prolonged prosecution related to claim scope debates, PTA can add several months to several years of additional patent term. IP prosecution teams that systematically monitor USPTO examination timelines and promptly respond to office actions minimize applicant-caused delays that offset PTA calculations, while preserving the USPTO-caused delays that generate additional term.
Key Takeaways: Section 8
PTE selection strategy should optimize for the patent with the latest natural expiry date among eligible candidates, not necessarily the composition-of-matter patent, to maximize effective exclusivity extension within the 14-year ceiling. European SPCs require separate national-level filings and create a country-specific exclusivity mosaic that must be managed as a coordinated program rather than a single filing. PTA adds months to years of pharmaceutical patent term for USPTO prosecution delays and is maximized by prompt applicant response to office actions combined with systematic documentation of USPTO delay periods.
9. Rx-to-OTC Conversion: Market Architecture and Regulatory Pathway
9a. The Commercial Logic and IP Consequences
Switching a drug from prescription (Rx) to over-the-counter (OTC) status opens access to a fundamentally different distribution channel and a dramatically larger potential consumer base. The U.S. OTC drug market exceeded $36 billion in annual retail sales, and an Rx-to-OTC switch that succeeds commercially can generate revenues that more than offset the revenue lost when payers stop covering the branded prescription version for patients who can self-manage the condition.
The Claritin (loratadine) switch in 2002 is the most instructive commercial benchmark. The OTC launch grew the total allergy medication market by 45% in its first year by converting consumers who had been managing allergies without any medication into regular purchasers of a category they could now access without a physician visit. The market expansion was not merely cannibalization of the prescription base; it created net new revenue in the category. Prilosec OTC (omeprazole) demonstrated a similar dynamic in the proton pump inhibitor category, reaching initial annual OTC sales approaching $400 million.
From an IP perspective, the OTC switch generates new market opportunity but does not create new patent protection. The molecule is the same; the formulation may or may not change depending on whether the OTC dose differs from the Rx dose. The primary IP consequence is that OTC branded products face rapid competition from private-label store brands, which can file ANDAs for the OTC formulation as soon as the relevant patents expire. The competitive moat in the OTC market is brand equity and distribution, not IP protection.
9b. The FDA’s Regulatory Pathway: What Actually Gets Approved
The FDA evaluates Rx-to-OTC switch applications under a standard that requires demonstrating that consumers can self-select appropriately for the condition, understand the label instructions, and use the product safely without professional supervision. The evidentiary requirements include label comprehension studies showing that consumers correctly understand the indication, dosing instructions, and contraindications; self-selection studies demonstrating that consumers who should not use the product (because they have contraindications or are in excluded populations) correctly identify themselves as inappropriate users; and actual use studies showing that real-world consumers use the product in the manner intended.
The FDA finalized rules in January 2025 for a new regulatory category, Additional Conditions for Nonprescription Use (ACNU), which creates a pathway for drugs that require more consumer interaction than a standard OTC label can support but less than a full prescription requires. An ACNU product might require a consumer to answer a digital screening questionnaire before purchase, or to interact with a pharmacist for a brief consultation. This pathway expands the universe of Rx products eligible for OTC transition by providing a mechanism for more complex drugs to be switched without requiring consumers to self-manage every aspect of use.
For LCM teams evaluating OTC switch candidates, the primary commercial criteria are: Is the condition self-diagnosable? Is the patient population for self-treatment significantly larger than the treated prescription population? Is the drug’s safety profile robust enough to support unrestricted OTC access, or does it require ACNU-level screening? Will the OTC launch cannibalize Rx revenues from commercially insured patients, and if so, does the net OTC revenue expansion exceed the Rx revenue loss?
Investment Strategy: Section 9
OTC switches are investable events with a typical 3-to-5-year development and regulatory timeline from decision to launch. FDA approval of an ACNU filing signals a near-term market expansion event. For drugs whose Rx patent protection is within 24 months of expiry, an OTC switch can partially preserve revenue by capturing a consumer market that generic Rx competitors cannot serve (because generic Rx products require prescriptions, while OTC products are available without one). Monitor FDA GRAS (generally recognized as safe) submissions and Nonprescription Drug Advisory Committee meeting dockets for leading indicators of imminent OTC switch approvals.
Key Takeaways: Section 9
The OTC switch creates a market expansion opportunity, not an IP protection mechanism. Claritin and Prilosec OTC both grew their categories by 40%+ by converting previously unmedicated patients into regular purchasers. The FDA’s new ACNU pathway expands the drug universe eligible for OTC transition by accommodating digital screening and pharmacist consultation requirements. OTC switches face rapid private-label competition and require brand equity and distribution moats rather than IP moats to sustain premium pricing.
10. Authorized Generics: The Tactical Weapon Against the First-Filer
10a. Mechanics and Commercial Impact
An authorized generic (AG) is the brand-name drug’s exact formulation, manufactured at the same facility, sold without the brand name under a generic label by the innovator or a designated partner. Because it is already approved under the original NDA, an AG requires no ANDA filing, no bioequivalence studies, and no waiting period tied to the 180-day first-filer exclusivity. The AG can enter the market on the same day as the first-filer generic, converting what the first-filer anticipated as a 180-day duopoly into an immediate three-way market.
The FTC’s landmark 2011 study on authorized generics estimated that the presence of an AG during the 180-day exclusivity period reduced the first-filer’s revenue during that period by 40% to 52% compared to a true duopoly scenario. This estimate has been broadly replicated in subsequent academic analyses and is now widely accepted as the operating assumption in generic company financial models. A generic company considering a Paragraph IV challenge against a drug with $5 billion in annual U.S. revenues must now factor in an approximately 50% reduction in expected exclusivity-period revenues if the brand is likely to respond with an AG.
10b. Pfizer’s Viagra AG and the Greenstone Model
Pfizer’s management of sildenafil’s LOE provides the most commercially sophisticated small-molecule AG case study. Sildenafil’s primary U.S. patent expired in December 2017. Rather than a passive brand defense, Pfizer launched its own AG through its Greenstone subsidiary, simultaneously deploying a branded co-pay assistance program and negotiating PBM formulary arrangements that gave pharmacy-level substitution priority to the Pfizer-controlled generic rather than to independent generic competitors.
The commercial result was that Pfizer captured a materially larger share of the post-LOE sildenafil market than brands typically retain. The combination of the AG (which captured volume-sensitive patients at a price point competitive with independent generics), the branded Viagra co-pay program (which retained price-insensitive patients), and the PBM formulary arrangements created a three-tier market structure in which Pfizer participated at every price point. Independent generic manufacturers were squeezed between Pfizer’s AG at the low end and Pfizer’s branded product at the premium end.
10c. AG Deterrence: The Strategic Signaling Function
Beyond its direct commercial impact, the AG is a deterrent against future Paragraph IV challenges. A generic manufacturer evaluating whether to file a Paragraph IV challenge on a drug with $3 billion in annual U.S. revenues must calculate the expected NPV of the 180-day exclusivity period. If the brand company has a history of launching AGs aggressively, the expected exclusivity-period revenues decline by approximately 50%. That reduction may push the Paragraph IV challenge below the hurdle rate for the risk and legal cost involved, deterring the filing entirely.
This deterrent effect is most powerful when the brand company announces its AG strategy publicly and in advance of LOE. The announcement converts a post-hoc tactical response into a prospective strategic threat that generic manufacturers price into their filing decisions. AGs announced 12 to 18 months before LOE have a larger deterrent effect than AGs deployed quietly on the day of generic entry.
Key Takeaways: Section 10
Authorized generics reduce first-filer 180-day exclusivity revenues by 40-52%, fundamentally altering the economics of Paragraph IV challenge filing decisions. Pfizer’s Greenstone AG strategy for Viagra created a three-tier post-LOE market structure in which Pfizer captured revenue at both the price-sensitive and price-insensitive ends of the market. Proactive public announcement of AG strategy 12-18 months before LOE creates a prospective deterrent that reduces the probability of Paragraph IV filings against the AG-committing brand.
11. Strategic Alliances and Co-Promotion: Deal Structures That Unlock Stranded Value
11a. When a Drug Is Too Valuable for One Company to Maximize
Several late-stage pharmaceutical assets generate more value under a collaborative commercialization model than under single-company ownership because the skills required to maximize their potential are not concentrated in any single organization. An oncology drug that requires simultaneous development in seven tumor types, exploration of combinations with multiple immuno-oncology agents, and global commercialization in 30 markets stretches any single company’s development bandwidth and commercial infrastructure. A co-development and co-commercialization partnership can divide these burdens by expertise and geography, allowing each partner to contribute what it does best.
The AstraZeneca-Merck Lynparza collaboration is the defining case study for this deal structure in oncology. At the time of the 2017 deal, Lynparza had one approved indication (ovarian cancer) and a broad, largely untested hypothesis about PARP inhibitor utility across multiple tumor types. AstraZeneca contributed deep mechanistic expertise in DNA damage response (DDR) biology, early clinical leadership in BRCA-mutated cancers, and a pipeline of complementary DDR agents. Merck contributed its global oncology commercialization infrastructure, its Phase III trial execution capabilities across multiple tumor types, and the strategic combination opportunity with Keytruda. The up-to-$8.5 billion deal structure was rational from both sides: AstraZeneca monetized future indication development risk and commercial upside while retaining scientific leadership; Merck gained a PARP inhibitor backbone for combination programs that could extend Keytruda’s clinical utility and expand its own I-O franchise.
11b. Deal Structure: Key Terms That Protect Long-Term Value
For pharma IP and BD teams negotiating late-stage co-promotion or co-development agreements, the contract terms that most often determine whether a deal creates or destroys value over a 10-year horizon are: indication carve-outs that preserve the originator’s exclusive commercialization rights in specific geographies or patient populations; IP ownership provisions for data generated during collaborative development programs, specifically whether combination therapy clinical data is owned jointly or by the party whose drug is on the lead label; change-of-control provisions that define what happens to the collaboration if either party is acquired; and royalty step-down provisions tied to LOE events for either partner’s drug that align the economic incentives when the composition-of-matter protection on a key asset expires.
11c. Co-Promotion vs. Co-Marketing: Distinguishing the Structures
Co-promotion involves two companies jointly promoting a single drug under one marketing authorization, typically with shared sales force resources and a common promotional message. The originator retains the NDA/BLA and is the marketing authorization holder; the co-promoter contributes sales force detailing effort in exchange for a fee, a royalty on sales driven by the co-promoter’s territory, or a share of incremental revenues above a baseline.
Co-marketing involves each company holding its own marketing authorization for the same active ingredient but under different brand names. This structure is less common in the U.S. but more frequent in European markets where national-level marketing authorizations create administrative opportunities to distribute commercialization rights geographically.
For a smaller biotech company with a strong late-stage asset, the co-promotion deal structure is typically the more attractive because it does not require the smaller company to build a full commercial infrastructure, allows the company to leverage the partner’s existing payer relationships and formulary positions, and preserves the biotech’s IP ownership while monetizing commercial execution capability.
Key Takeaways: Section 11
The AstraZeneca-Merck Lynparza deal demonstrates that co-development and co-commercialization partnerships create the most value when each party contributes a genuine capability the other lacks. Combination therapy clinical data ownership is the most contentious term in oncology co-development agreements and must be explicitly defined before development begins. Co-promotion agreements that leverage a larger partner’s existing formulary relationships are the highest-return structure for smaller biotechs seeking to maximize late-stage asset value without building commercial infrastructure.
12. Pricing Defense and Value-Based Contracting: Moving Beyond the Per-Pill Comparison
12a. The Generic Paradox and Its Commercial Exploitation
When a generic enters the market, the commercial logic of the branded drug’s pricing changes fundamentally. The market splits into two segments with different price elasticity. The price-elastic segment, which represents the majority of prescription volume, transitions to the generic immediately under formulary mandate. The price-inelastic segment, comprising brand-loyal patients, physicians with strong prescribing preferences, and patients whose specific insurance designs minimize cost differential, remains accessible to the brand at a premium price.
The optimal response to this bifurcation is counterintuitive: the brand raises its list price to maximize revenue from the price-inelastic segment rather than competing on price with the generic for the price-elastic majority. This is the ‘generic paradox,’ documented empirically across multiple therapeutic categories. Branded drugs in markets with four or more generic competitors show average list price increases of 5% to 15% in the two years following generic entry.
The commercial team that exploits this paradox most effectively is the one that has spent the preceding three years building the patient support programs, physician loyalty programs, and medical education infrastructure that creates the price-insensitive cohort. The brand loyalty that those investments generate becomes directly monetizable after LOE because it is the basis for the residual premium pricing position.
12b. Value-Based Contracts: Shifting the Comparison Framework
A value-based contract (VBC) reframes the payer’s decision from a comparison of branded drug price versus generic drug price to a comparison of a guaranteed outcome versus an unguaranteed outcome. The structure links reimbursement levels to the drug’s real-world performance on pre-specified clinical metrics, with the manufacturer paying larger rebates when performance falls below thresholds and smaller rebates (or none) when it exceeds them.
For a branded drug facing generic entry, the most commercially powerful VBC structures are those that incorporate patient support program adherence as a performance metric alongside clinical outcomes. A payer who has moved a drug to Tier 3 non-preferred to encourage generic substitution, but who then observes an increase in adherence failures and disease management costs among brand-loyal patients who resist switching, has a quantifiable cost problem. A VBC that guarantees a specific adherence rate in the branded patient population, backed by the manufacturer’s adherence support program, converts the brand’s patient support infrastructure into a contracted financial guarantee that the generic cannot offer.
The administrative complexity of VBCs is real. The Medicaid Best Price rule creates legal exposure when VBC rebates are structured in ways that could lower the effective Medicaid price below the quarterly best price disclosure. The data infrastructure required to track patient-level outcomes at scale for large payer populations is significant. These barriers explain why fully performance-linked VBCs remain relatively uncommon in the U.S. market. However, the simpler forms, specifically guaranteed adherence rates backed by refund provisions for patients who discontinue within a defined period, are increasingly feasible as digital health monitoring and EHR data integration improve.
12c. HEOR as the Language of Payer Negotiation
Health Economics and Outcomes Research (HEOR) provides the quantitative evidence base that makes a VBC offer credible and a value dossier persuasive. For a late-stage drug, the HEOR investment priorities are: cost-effectiveness models that update the original HTA submission with 8 to 10 years of accumulated real-world effectiveness data; budget impact models that quantify the total cost of care for a defined patient population under branded versus generic treatment pathways; and comparative effectiveness analyses that benchmark the branded drug’s real-world performance against the most relevant alternative treatment options, including both generics of the same molecule and competitive agents in the same class.
HEOR data generated from the drug’s own patient support program, specifically if that program tracks adherence metrics and downstream healthcare resource utilization, is more commercially powerful than claims-based analyses because the manufacturer controls the data quality and can demonstrate the causal pathway between the support program, adherence improvement, and downstream cost reduction.
Investment Strategy: Section 12
VBC adoption is a leading indicator of brand resilience post-LOE. Companies that have executed VBCs for their major assets demonstrate that the drug has a measurable, defensible HCRU advantage over its competitors that payers have agreed to pay for. Track VBC announcements in quarterly earnings calls and press releases as a qualitative signal of a drug’s formulary defense capability. Companies without VBCs for assets within 18 months of LOE have a structural gap in their market access strategy that is rarely closed in time.
Key Takeaways: Section 12
The generic paradox is empirically documented: branded drug list prices rise 5-15% after generic entry as the brand optimizes for the price-inelastic residual cohort. VBCs shift the payer comparison from branded price versus generic price to guaranteed outcome versus unguaranteed outcome, a framing that generics structurally cannot match. HEOR data derived from proprietary patient support program tracking is more commercially powerful in payer negotiations than claims-based analyses because the manufacturer controls data quality and can demonstrate causal adherence-outcome linkages.
13. Late-Stage Brand Marketing: Building Stickiness That Survives Generic Entry
13a. What Late-Stage Marketing Is Actually Trying to Accomplish
The objective of late-stage brand marketing is categorically different from the objective of early-stage launch marketing. Early-stage marketing drives adoption: converting new patients to the drug, expanding the pool of trained prescribers, and establishing formulary access. Late-stage marketing creates inertia: raising the activation energy required to switch existing patients and prescribers away from the brand, and embedding the brand in the clinical workflow and patient support infrastructure in ways that generics cannot replicate.
The tactical difference is significant. Early-stage campaigns emphasize efficacy, novelty, and differentiation from prior standard of care. Late-stage campaigns emphasize durability, familiarity, and the comprehensive support ecosystem surrounding the drug. The prescriber who has used a drug for 12 years is not making a new adoption decision; they are making a retention decision, and the variables that retain them are different from those that acquired them.
13b. Physician Loyalty as Measurable Commercial Asset
Brand loyalty among physicians is not a soft, unmeasurable quality; it is a documented behavioral pattern that can be quantified through prescription data and that decays at a specific rate following LOE. IMS Health (now IQVIA) research has documented that physician loyalty to a branded drug slows post-LOE market share erosion by 15% to 25% in the first 12 months of generic availability, with the protective effect declining as formulary mandates override individual prescribing preferences.
The prescription data analytics that identify the ‘loyal prescriber’ cohort are available to every commercial analytics team. The high-value targets for late-stage retention marketing are not the highest-volume prescribers (who are often academic centers already subject to formulary governance) but the mid-volume specialists and subspecialists who retain independent prescribing discretion within their health systems. These physicians make individual formulary exceptions based on patient-specific factors, and they are the primary driver of the branded drug’s revenue tail post-LOE.
Medical education and CME investment in this cohort has a direct commercial return that is calculable: for each specialist who prescribes the brand for an average of 20 patients post-LOE instead of switching to the generic, at a premium of $200 per month per patient over the generic price, the annual revenue retention per physician is $48,000. The cost of retaining that prescriber through targeted medical education, patient support program co-investment, and direct data engagement is substantially less than $48,000 annually, producing a measurable positive return on marketing investment.
13c. Patient Support Programs as Competitive Moat
Patient support programs (PSPs) encompass adherence support tools, financial assistance programs, nurse education programs, and disease management services that the brand manufacturer provides to patients on the drug. PSPs are a category of service that generic manufacturers cannot economically provide, because the generic’s margin per unit does not support the operating cost of a comprehensive PSP at scale.
The co-pay assistance program is the most immediately powerful PSP for LOE defense in commercially insured patients. By reducing or eliminating the patient’s out-of-pocket cost differential between the brand and the generic at the pharmacy counter, the co-pay program removes the primary financial incentive for the patient to accept generic substitution. Pfizer’s ‘Lipitor for You’ program reduced patient co-pays to as low as $4 per month, often making the branded Lipitor cheaper at point-of-sale than the first generic entrant. The program was cited by independent analysts as a significant factor in Pfizer’s ability to retain 18% branded prescription volume 12 months post-LOE, versus the 2% to 5% typical for a passive brand.
Federal anti-kickback statutes prohibit co-pay assistance programs for Medicare and Medicaid patients, which limits their use to the commercially insured population. However, this is also the population where the financial incentive to switch to a generic is lowest, because most commercial plans require a co-pay for branded drugs rather than covering them at zero cost. The co-pay assistance program’s value is greatest precisely where it is most targeted: commercial patients who have a small but quantifiable cost incentive to switch, which the program eliminates.
Key Takeaways: Section 13
Late-stage brand marketing targets inertia, not adoption: raising the activation energy required to switch existing prescribers and patients rather than converting new ones. Mid-volume specialists with independent prescribing discretion, not academic high-volume prescribers subject to formulary governance, are the highest-return targets for retention marketing investment. Co-pay assistance programs targeting commercially insured patients can retain 15-20% additional branded prescription volume post-LOE by eliminating the financial substitution incentive at the pharmacy counter, delivering a measurable positive ROI relative to program cost.
14. Monitoring, Iteration, and the Adaptive LCM Operating Model
14a. Building the KPI Dashboard
An LCM program without measurement infrastructure is a hypothesis without a feedback mechanism. The KPI architecture for a late-stage drug must track five categories of performance simultaneously, because movements in any one category signal different strategic adjustments.
Commercial KPIs cover sales volume by channel and prescriber segment, market share at the national and regional levels, new-to-brand prescriptions as an early indicator of formulary access changes, and gross-to-net adjustments that reflect the rebate and discount commitments made to maintain formulary position. Patient KPIs cover new prescription rates, refill rates at 30 and 90 days, persistence at 6 and 12 months, and utilization of patient support program components. HCP KPIs cover the breadth and depth of the prescriber base (specifically, whether the loyal prescriber cohort is growing or contracting), physician satisfaction survey results, and engagement with CME and medical education programs. Safety KPIs cover adverse event reporting rates and any emerging signals in the post-marketing surveillance database that require regulatory response. IP and competitive KPIs cover the status of every Orange Book patent (any new Paragraph IV notices, any PTAB petitions filed, any district court judgments pending), competitor pipeline filings in adjacent indications, and biosimilar or generic ANDA filing activity.
14b. AI-Powered Pharmacovigilance and Signal Detection
The FDA’s post-marketing surveillance requirements generate a continuous stream of adverse event reports, EHR data integrations, and registry submissions that, collectively, provide a real-time picture of how the drug is performing in the broadest possible patient population. The challenge is not data volume; it is signal detection speed and specificity. Traditional pharmacovigilance methods using periodic aggregate report analysis have an average signal-to-action timeline of 18 to 24 months. AI-powered signal detection systems can reduce that timeline to weeks for high-frequency event types.
For LCM purposes, faster signal detection serves two distinct commercial interests. First, proactive safety signal management allows the company to update labeling, implement risk mitigation measures, and communicate with physicians before a signal becomes a regulatory enforcement action or a litigation catalyst, preserving the drug’s commercial viability. Second, AI-powered pharmacovigilance generates granular patient subgroup performance data continuously, which feeds directly into HEOR analyses and RWE studies. A signal in the pharmacovigilance data showing that a specific comorbidity pattern is associated with superior drug performance is a commercial and IP opportunity (a new indication or patient selection patent) as well as a safety data point.
14c. The OODA Loop in LCM Execution
The strategic management framework that best describes effective late-stage LCM is the OODA loop: Observe, Orient, Decide, Act. The competitive environment at late stage changes faster than at any other point in the product lifecycle: new Paragraph IV filers emerge, formulary decisions shift, payer policies change, competitors launch next-generation products, and regulatory guidances evolve. Organizations that can cycle through the OODA loop faster than their competitors make better decisions with newer information, adjusting their strategies in response to real market developments rather than 12-month-old assumptions embedded in annual planning cycles.
The organizational structure that enables fast OODA cycling is a cross-functional LCM steering committee with members from commercial, IP, R&D, regulatory affairs, and medical affairs meeting at least quarterly to review the KPI dashboard and competitive intelligence inputs and to authorize tactical adjustments without requiring full business unit approval cycles. This committee structure breaks the silo problem that the original article identifies as the most common LCM failure mode, and it gives the organization the authority and speed to respond to a competitive development in weeks rather than quarters.
Key Takeaways: Section 14
The five-category KPI dashboard (commercial, patient, HCP, safety, IP/competitive) gives LCM steering committees the information required to distinguish between a formulary problem, a patient experience problem, and a competitive positioning problem, each of which requires a different strategic response. AI-powered pharmacovigilance can reduce signal-to-action timelines from 18-24 months to weeks, creating both safety management and commercial intelligence advantages. Cross-functional LCM steering committees with tactical authorization authority are the organizational mechanism that enables OODA loop cycling fast enough to respond to late-stage competitive developments before they crystallize into permanent market share losses.
15. The IRA Variable: How Medicare Price Negotiation Reshapes Every LCM Decision
15a. The New Revenue Runway Structure
The Inflation Reduction Act’s Medicare Drug Price Negotiation Program introduces government price negotiation at the 9-year mark for small molecule drugs and the 13-year mark for biologics. A drug that enters Medicare negotiation faces an administratively determined price reduction that, based on the first negotiation cycle covering 10 drugs, averaged approximately 60% off the current list price. This is not a hypothetical discount; it is a durable revenue reduction affecting the Medicare patient population, which for most drugs represents 30% to 50% of total U.S. volume.
The IRA fundamentally restructures the lifecycle NPV model for any drug with significant Medicare exposure. Pre-IRA, the high-revenue phase ran from launch until LOE, typically 7 to 12 years. Post-IRA, for a small molecule drug, the high-revenue phase runs from launch until year 9, at which point Medicare negotiation begins, followed by a second transition when generic LOE arrives. The commercially significant implication is that the window for full unregulated pricing is now approximately 9 years rather than 10 to 15, requiring that peak revenue be generated faster and that LCM strategies with ROI payoffs beyond year 9 be discounted more heavily.
15b. IRA’s Effect on Indication Expansion and Combination Therapy Strategy
The IRA creates a structural incentive distortion for small molecules with multiple indications. A small molecule drug that enters Medicare negotiation in year 9 based on its first indication will have its negotiated price applied across all uses for which it is approved, including new indications added after the original approval. This means that indication expansion programs for small molecules that launch later than year 5 of the drug’s commercial life may generate revenues that are subject to the negotiated price before the indication-specific development investment has been fully recovered.
For biologics, the 13-year negotiation-free window is longer and more accommodating of indication expansion programs. A biologic that launches a major indication expansion in year 8 still has 5 years of unrestricted pricing before negotiation begins. For small molecules, the IRA effectively creates a bias toward front-loaded indication expansion programs, where new indication approvals are targeted for the first 5 to 7 years of commercial life to maximize the revenue generated before the negotiated price applies.
The IRA also creates a strategic disadvantage for drugs that are used primarily as combination therapy partners. If Drug A is a cancer immunotherapy that serves as the combination backbone for multiple other agents, and its Medicare negotiated price is set based on its monotherapy use, the negotiated price will apply even when it is used in the combination regimen. Pricing strategy for combination products must therefore be modeled explicitly against the IRA’s combination therapy price implications.
15c. The ‘Small Molecule Disadvantage’ and Its Strategic Consequences
The 4-year difference in the IRA negotiation-free window between small molecules (9 years) and biologics (13 years) is widely characterized as a structural bias that will incentivize pharmaceutical R&D investment toward biologics and away from small molecules. This incentive effect is particularly pronounced for drugs in chronic disease indications with high Medicare prevalence, where the negotiated price reduction would apply to the largest patient population.
LCM teams managing small molecule portfolios must explicitly model the IRA negotiation discount in their revenue forecasts for any asset whose Medicare-eligible indication is likely to reach negotiation volume thresholds. The IRA selects drugs for negotiation based on total Medicare spend rather than per-patient cost, which means high-volume small molecules in common chronic conditions (cardiovascular disease, diabetes, osteoporosis) are at highest risk of early negotiation selection.
Key Takeaways: Section 15
The IRA’s Medicare price negotiation compresses the small molecule revenue runway from 10-15 years to 9 years, requiring faster peak revenue generation and lower discount rates applied to post-year-9 LCM investments. The 4-year negotiation window advantage for biologics creates a structural incentive for R&D portfolio allocation toward biologic assets. Small molecules in high-Medicare-prevalence chronic disease indications face the highest probability of early negotiation selection based on total Medicare spend volume. Indication expansion programs for small molecules must target approvals in the first 5-7 years of commercial life to maximize revenue before the negotiated price applies.
16. PTAB Inter Partes Review: Threat Assessment and Defense Protocol
16a. IPR Mechanics and the Pharmaceutical Patent Vulnerability Map
The PTAB Inter Partes Review process, created by the America Invents Act in 2012, allows any third party to petition the PTAB to cancel one or more patent claims on grounds of prior art anticipation or obviousness. For pharmaceutical secondary patents, the most common ground is obviousness: the argued position that a formulation, dosing regimen, or new indication would have been obvious to a person of ordinary skill in the art given the prior art that existed before the patent was filed.
The PTAB’s pharmaceutical patent statistics are clear and consistent: institution rates above 60%, and final written decisions invalidating claims in whole or part in approximately 75% of instituted proceedings. The combined probability of surviving an IPR challenge intact is approximately 25%, with the majority of pharmaceutical IPR casualties concentrated in secondary patents rather than composition-of-matter patents.
The practical priority for IP defense teams is therefore not to treat all patents in the portfolio as equally vulnerable but to identify which specific patents in the thicket would, if invalidated by the PTAB, materially shorten the effective LOE date. These ‘keystone’ patents, typically the two or three secondary patents with the latest expiry dates that are providing critical coverage not duplicated by other listed patents, are the ones worth investing in defending most aggressively. A PTAB trial defense for a single pharmaceutical patent typically costs $1.5 million to $3 million in attorney fees through the final written decision stage, with additional cost for Federal Circuit appeals.
16b. Ex Parte Reexamination and Other Defense Tools
When a competitor files an IPR petition against a keystone patent, the patent owner’s primary defensive tools during the PTAB proceeding are: filing a patent owner’s preliminary response challenging the petition’s prima facie case of obviousness; filing a patent owner’s response after institution with claim amendments or declarations of secondary considerations (commercial success, long-felt need, unexpected results); and compelling deposition of the petitioner’s experts to expose methodological weaknesses in the obviousness argument.
Before an IPR petition is filed, the patent owner can proactively seek ex parte reexamination of their own patent to re-examine and potentially amend claims in light of prior art that a challenger might raise. A patent that survives an ex parte reexamination with claim amendments on record carries a prosecution history that makes an IPR challenge on the same prior art substantially harder, because the amended claim language explicitly distinguishes the patented invention from the cited references.
16c. Strategic PTAB Settlement
PTAB proceedings can be settled by agreement between the petitioner and the patent owner at any point before a final written decision. A settlement typically involves the petitioner agreeing to withdraw the IPR petition in exchange for a license (often a paid-up, royalty-free license for specified uses) or a defined market entry date. For brand pharmaceutical companies, a negotiated PTAB settlement with a biosimilar developer can serve the same commercial function as a Paragraph IV litigation settlement: confirming a defined LOE date that is later than the composition-of-matter expiry while avoiding the risk of an adverse PTAB decision that would invalidate the keystone secondary patent entirely.
Investment Strategy: Section 16
Monitor PTAB IPR petition filings as leading indicators of the probability that a brand’s secondary patent thicket will hold. An IPR petition filed against a keystone secondary patent (one with a late expiry providing coverage not duplicated by other listed patents) should reduce the investor’s LOE date assumption toward the composition-of-matter expiry, increasing the probability weight on the ‘core patent only’ scenario in the IP valuation model. PTAB proceedings are public record; institution decisions, claim construction orders, and final written decisions are available on the USPTO PTAB e2e portal and should be reviewed systematically for major pharmaceutical IP positions.
Key Takeaways: Section 16
PTAB IPR petitions have a 60%+ institution rate and a 75% claim invalidation rate for instituted pharmaceutical secondary patent proceedings. Keystone secondary patents, those providing the latest expiry date without duplication by other listed patents, should receive the highest defensive investment priority. Proactive ex parte reexamination and claim amendment creates prosecution history that complicates subsequent IPR petitions on the same prior art. Strategic PTAB settlement functions as a commercial LOE date management tool analogous to Paragraph IV litigation settlement.
17. Global LCM Execution: FDA vs. EMA Pathway Divergence
17a. The sNDA vs. Type II Variation and Line Extension Dichotomy
Global LCM execution requires coordinating regulatory submissions across at least two major jurisdictions, the U.S. and the EU, with materially different procedural requirements, timelines, and legal consequences for post-approval changes. A new indication that takes 12 to 18 months to approve in the U.S. via sNDA may require 24 to 30 months in the EU via the centralized Type II variation or line extension pathway, with a 6-month advance notice requirement that the EMA requests before a line extension application is submitted.
The procedural distinction with the largest commercial consequence is the outcome of approval. In the U.S., an sNDA approval amends the existing NDA, adding the new indication to the approved labeling while the original NDA number is maintained. In the EU, a line extension results in the issuance of a new, separate marketing authorization under the same invented name as the original. This means that in the EU, a drug with three approved indications may have three separate marketing authorizations, each with its own data exclusivity clock, its own renewal requirements, and its own variation history. IP teams that manage EU patent linkage must track which indications correspond to which marketing authorization numbers.
Feature
FDA (U.S.)
EMA (EU)
New Indication Pathway
Supplemental NDA (sNDA)
Type II Variation or Line Extension
Advance Notice Required
Not mandatory (pre-submission meetings recommended)
6-month notice requested for Line Extensions
Review Timeline
4-6 months (Prior Approval Supplement)
210 days (Line Extension); ~60-90 days (Type II Variation)
Approval Outcome
Amendment to existing NDA; NDA number maintained
Line Extension issues new Marketing Authorization
Data Exclusivity Generated
3 years (new clinical investigation)
1 year (new indication exclusivity under 8+2+1 framework)
Patent Linkage
Formal (Orange Book / Paragraph IV)
No formal linkage; national patent courts
17b. EU Market Access: HTA Fragmentation and EUNETHRA
EU pharmaceutical LCM faces a market access challenge that the U.S. system, for all its complexity, does not replicate at the same scale: fragmented HTA decision-making across 27 member states, each with its own benefit assessment framework, reimbursement decision process, and pricing negotiation. A drug with EU centralized approval from the EMA still requires 27 separate reimbursement decisions, price negotiations, and formulary inclusions to be commercially available across the full EU market.
The EU HTA Regulation, effective January 2025, introduced mandatory joint clinical assessments (JCAs) for new oncology drugs and advanced therapy medicinal products conducted at the EU level rather than the national level. This reduces the duplication of clinical evidence assessment across member states for qualifying drugs, but national pricing and reimbursement decisions remain independent. For LCM teams managing EU indication expansion programs, the JCA requirement means that the clinical evidence package supporting a new indication will be assessed against a standardized EU-level comparator framework, with implications for what clinical endpoints and patient populations the pivotal trial must address.
Key Takeaways: Section 17
U.S. sNDA and EU line extension pathways produce different legal outcomes (NDA amendment vs. new Marketing Authorization) that have distinct data exclusivity, patent linkage, and renewal implications. The EU’s 6-month advance notice request for line extension applications requires earlier submission planning than comparable U.S. sNDA programs. The EU HTA Regulation’s mandatory joint clinical assessments for oncology drugs, effective January 2025, standardize clinical evidence evaluation at the EU level but preserve national pricing and reimbursement independence, requiring LCM teams to design pivotal trials for new indications against EU-level comparator standards.
18. Investment Strategy: LOE Events as Systematic Alpha Opportunities
18a. The LOE Calendar as a Forward Catalyst Schedule
Loss of exclusivity events are scheduled, dateable, and preceded by a sequence of observable signals, including Orange Book patent filings, ANDA filing activity, Paragraph IV certification notices, IPR petition submissions, and district court litigation milestones. Unlike clinical trial readouts or regulatory decisions, which carry binary outcome uncertainty, LOE events have a fundamentally different risk profile: the event itself is near-certain; the revenue impact depends on the competitive structure that the preceding patent and litigation landscape determines.
This makes LOE analysis a systematic, data-driven process rather than a binary event-driven bet. Analysts who build explicit LOE models using public patent data, ANDA filing histories, and PTAB petition dockets can construct probability-weighted revenue forecasts that are systematically more accurate than consensus estimates for companies with major LOE events within 3 years.
18b. Short-Side Strategy: Pre-LOE Overvaluation
The pharmaceutical equity market has a persistent tendency to overvalue branded drug revenue streams in the 2 to 4 years before LOE. This overvaluation is driven by three factors: management guidance that uses the latest secondary patent expiry date rather than a probability-weighted expected LOE date; sell-side models that treat the full patent thicket as protective without discounting for PTAB challenge probability; and investor psychology that anchors to current revenues and discounts the cliff more slowly than the actual patent maturity curve justifies.
Short-side positions in branded pharmaceutical companies with major LOE events within 24 to 36 months, established using publicly available Orange Book and PTAB data, have historically produced above-average risk-adjusted returns. The sizing should reflect three variables: the LOE revenue as a percentage of total company revenues (higher concentration means larger per-unit impact on earnings), the PTAB-adjusted probability that the secondary patent thicket holds (lower probability means earlier effective LOE), and whether the company has disclosed convincing successor pipeline assets with clinical milestones that are datable within the relevant investment horizon.
18c. Long-Side Strategy: First-Filer and Formulary Inflection Events
Two specific long-side catalysts in the LOE ecosystem generate systematic, near-term investable returns. The first-filer 180-day exclusivity is a specific, dateable, high-probability revenue event for the winning generic manufacturer. A generic company that confirms first-filer status through a district court non-infringement or invalidity decision is entering a defined period of duopoly pricing that can generate 20% to 35% of the company’s annual revenue in six months. The market often underreacts to first-filer status confirmations, particularly when the district court decision occurs in a mid-year quarter without a major earnings event to attract coverage.
Formulary inflection events, specifically the announcement by a major PBM of a formulary position change that favors a biosimilar over the reference product, are the single most actionable catalyst for biosimilar manufacturer positions. CVS Caremark’s 2024 Humira formulary decision produced a 20-percentage-point increase in adalimumab biosimilar market share within two quarters of the effective date. The decision was announced publicly before the effective date, providing a clear entry window. Monitor PBM formulary committee meeting schedules (typically held in Q2 and Q3 for the following year’s formulary) and annual formulary update announcements from the top three PBMs for advance signals of biosimilar market share inflection events.
18d. M&A Pricing: Patent Cliff Exposure as a Valuation Discount
For acquirers evaluating pharmaceutical M&A targets, the patent cliff exposure of the target’s commercial portfolio is one of the primary NPV discount drivers. A target company whose top three products face LOE within 4 years and whose pipeline has no confirmed Phase III assets to replace them is materially overvalued if the acquisition price reflects current revenues rather than post-LOE revenues. The LOE discount should be calculated using the three-scenario IP valuation framework: expected post-LOE revenues under the ‘thicket holds,’ ‘core patent only,’ and ‘at-risk entry’ scenarios, probability-weighted using PTAB data and ANDA filing counts.
For targets with significant biologic exposure to the next patent cliff cycle, the discount should also reflect the expected PBM formulary behavior based on the Humira and Stelara precedents, since first-year biosimilar market share has consistently been in the low single digits in the absence of a formulary mandate, meaning the full impact of biosimilar competition on a target’s biologic revenues may not materialize until 12 to 24 months after the first biosimilar approval.
Key Takeaways: Section 18
LOE events are schedulable, public, and analyzable using patent data, ANDA filings, and PTAB petition records, making them systematically investable with a data-driven edge over consensus models. Pre-LOE short-side opportunities arise from the persistent market tendency to overvalue patent thicket protection at full face value rather than PTAB-discounted probability. First-filer exclusivity confirmation events and PBM formulary position announcements are the two most actionable long-side catalysts, each producing measurable and relatively rapid market share inflection. M&A acquisition pricing for pharma targets with near-term LOE exposure requires three-scenario IP valuation models rather than current revenue multiples.
19. Master Key Takeaways and Analyst Checklist
Planning horizon. Effective late-stage LCM begins at launch, not at the 3-year pre-LOE mark. Decisions made during Phase III clinical trials, including endpoint selection, trial population design, and indication sequencing, constrain or enable every subsequent LCM option. Companies that begin structured LCM planning only when the patent cliff is visible are systematically leaving 30% to 50% of recoverable asset value unrealized.
IP portfolio valuation. The Orange Book expiry date is the wrong number for IP NPV calculations. Probability-weighted DCF models that discount secondary patent thicket value using PTAB institution and invalidation rates produce materially different, and more accurate, NPV estimates. The Humira and Lipitor benchmarks provide the primary calibration points for biologic and small molecule patent portfolio valuation at scale.
R&D investment priority ordering. Among the available R&D LCM strategies, the priority ordering by expected ROI is: pediatric exclusivity (highest ROI per dollar invested for eligible assets), indication expansion in orphan or biomarker-defined populations (highest NPV from new method-of-use patents), SC reformulation of IV biologics (highest commercial defensibility from site-of-care transition), fixed-dose combinations (new patentable entity with independent formulary value), and extended-release reformulation (significant IP value but antitrust risk if paired with original formulation withdrawal).
Biologic technology roadmap. All five dimensions of the biologic LCM technology roadmap must be executed concurrently: formulation optimization, device integration, SC reformulation, biomarker-stratified indication expansion, and next-generation biobetter development. Executing on two or three dimensions leaves years of potential exclusivity protection unrealized. The overlap interval between reference product peak revenues and biobetter Phase III development requires a minimum of 5 years to achieve meaningful revenue curve continuity.
PBM dynamics. Biosimilar market penetration is driven more reliably by PBM formulary positioning than by list price or clinical data. The rebate wall can hold biosimilar market share at 2% for 12 months despite 85% list price discounts. A single formulary decision by a PBM covering 100 million lives produces a market share inflection of 20 percentage points within two quarters. Tracking PBM formulary committee timelines and annual formulary update announcements is the highest-signal activity for forecasting biosimilar penetration timing.
IRA implications. The IRA’s 9-year negotiation-free window for small molecules and 13-year window for biologics requires explicit modeling in any LCM investment decision with a payoff horizon beyond year 9 for small molecules. Indication expansion programs targeting later-in-life approvals face a growing probability that their revenue will be subject to the negotiated price before development cost recovery is complete.
PTAB as a systematic discount. Secondary pharmaceutical patents carry a survival probability of approximately 25% through a full PTAB IPR proceeding. Every IP valuation model, M&A analysis, and LOE revenue forecast that treats secondary patent thicket protection at face value without applying this discount is systematically overestimating the duration of effective market exclusivity.
Organizational execution. The LCM programs that produced the most commercially significant outcomes, Lipitor’s 18% branded volume retention, Humira’s seven-year biosimilar delay, Lynparza’s indication expansion from one tumor type to five, were each characterized by cross-functional integration starting 6 to 10 years before the terminal LOE event. The organizational enabler is a standing cross-functional LCM steering committee with tactical authorization authority meeting at least quarterly, staffed by representatives from IP, R&D, regulatory affairs, commercial, and medical affairs, operating against a KPI dashboard that covers commercial, patient, HCP, safety, and competitive intelligence metrics simultaneously.
Appendix: Analyst Checklist for LOE Assessment
IP Position
What is the composition-of-matter patent expiry date, inclusive of any PTE or PTA?
How many secondary patents are Orange Book-listed, and what are their expiry dates?
Has any PTAB IPR petition been filed against a listed patent? What is the institution and outcome status?
Have any Paragraph IV certification notices been received? How many distinct filers?
Are there pending sNDA applications that would generate new 3-year clinical investigation exclusivity?
Has the company disclosed any reverse payment or settlement agreements with generic or biosimilar challengers?
Commercial Structure
What percentage of the drug’s U.S. revenues come from Medicare Part D patients (IRA negotiation risk)?
What is the branded drug’s current formulary tier across the top three PBMs?
Has the company executed any value-based contracts with major payers for this drug?
Does the company have an authorized generic strategy disclosed or implied?
Pipeline Readiness
What successor assets are in Phase II or Phase III for the same patient population?
What is the earliest date at which a successor product could receive FDA approval?
Is the revenue overlap interval between the declining reference product and the ascending successor at least 3 years?
Competitive Intelligence
Have any biosimilar or generic ANDA applications been publicly disclosed or inferred from Paragraph IV notices?
Have any competitors filed patents in the same disease area that suggest a competing next-generation formulation program?
Has any competitor’s device patent or combination product filing created a potential substitution risk for the reference product’s device component?
This analysis is prepared for pharmaceutical IP professionals, R&D strategists, business development leads, and institutional investors. Patent expiry dates, regulatory exclusivity periods, and clinical development timelines are subject to change based on USPTO decisions, FDA administrative actions, and litigation outcomes. All revenue and financial data referenced are derived from publicly available company filings and published research reports. Nothing in this document constitutes legal advice or investment advice.