Drug development is a decade-plus, multi-billion-dollar bet made in almost complete informational darkness. The traditional model asks R&D teams to commit capital across 10-15 years of development using static project plans, deterministic milestone assumptions, and patent landscapes that are out of date before the ink dries. The result: an industry-wide Phase I-to-approval probability of 7.9%, capitalized development costs that have reached $2.6 billion per approved drug, and a structural inability to forecast when a competitor’s key exclusivity period will end.
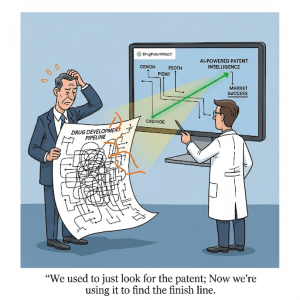
Artificial intelligence, applied specifically to the corpus of global patent data, changes the informational equation. The shift is not incremental. When NLP models parse the full text of a competitor’s provisional application filed years before a product reaches clinical trials, when machine learning classifiers score a portfolio’s vulnerability to Paragraph IV challenge, and when unsupervised clustering maps the precise coordinates of low-competition chemical space, patent data stops being a legal archive and becomes a real-time intelligence feed.
This guide covers the full technical and strategic architecture of that transition: how the drug development clock and the patent clock interact, how to build IP valuation models that quantify exclusivity as a financial asset, what specific AI methodologies are production-ready versus experimental, how to forecast a competitor’s loss-of-exclusivity date, how to structure an AI-augmented Freedom-to-Operate workflow, and how the emergence of generative AI is rewriting both the patent drafting process and the legal standards of inventorship. It also addresses what institutional investors should look for when assessing a company’s AI-driven patent intelligence capability as a proxy for R&D execution quality.
Key Takeaways from Section 1
The core argument of this guide is that patent intelligence has crossed a threshold from a legal support function to a core R&D planning discipline. Companies that treat their patent portfolio as a dynamic financial asset, model it with AI, and integrate its signals into go/no-go decisions at every clinical stage gate will compress their development timelines, reduce late-stage capital destruction, and extract materially more commercial value from each patent term. Companies that do not will face a growing informational disadvantage against rivals who do.
Section 2: Deconstructing the Drug Development Timeline: Risk, Cost, and Attrition by the Numbers
2.1 The Five-Stage Architecture and Where Time Is Lost
The FDA’s regulated drug development framework has five stages: Discovery and Development, Preclinical Research, Clinical Research (Phases I, II, and III), FDA Review, and Post-Market Safety Monitoring. This structure is well understood at a conceptual level. What is less well understood is the distribution of time loss within it, and how that distribution creates predictable, exploitable patterns in competitor patent filing behavior.
Preclinical research typically runs 1-2 years. The IND application gives the FDA 30 days to respond before human trials can begin. The clinical phase, taken as a whole, averages approximately 95 months, nearly 8 years. The Biotechnology Innovation Organization’s analysis of 10 years of data found that Phase I averages 2.3 years, Phase II 3.6 years, Phase III 3.3 years, and the final regulatory review 1.3 years. Total: roughly 10.5 years from first-in-human dosing to approval. Research from the Tufts Center for the Study of Drug Development found that average clinical trial duration increased from 83.1 months in the 2008-2013 cohort to 89.8 months in the 2014-2018 cohort, a 8% increase in cycle time with no corresponding improvement in success rates.
Phase II is the single largest time sink relative to the information it generates. It runs 3.6 years on average, delivers the first evidence of human efficacy, and fails 60-71% of the time. Every dollar committed to Phase III is preceded by a binary Phase II go/no-go decision made on probabilistically thin data. This is the structural weakness AI-driven patent intelligence is best positioned to address, not by replacing clinical judgment, but by enriching the competitive and IP context in which that judgment is made.
2.2 Capitalized Cost: Why $2.6 Billion Is the Right Number to Use
Cost estimates for drug development span a wide range, which confuses strategic planning conversations. The correct figure to use for capital allocation modeling is not the out-of-pocket cost per drug, which one HHS analysis placed at approximately $172.7 million, but the capitalized cost, which accounts for the time value of capital across a 10+ year investment horizon and the cost of all failed programs that must be absorbed by successful ones. On that basis, the Tufts CSDD estimate of $2.6 billion per approved drug is the appropriate benchmark.
Clinical trials account for approximately 68-69% of total out-of-pocket R&D expenditure. The non-clinical phase accounts for the remainder, with an estimated average of $43 million. The financial consequence is that a one-year delay in Phase III, where a sponsor has already committed hundreds of millions of dollars and where manufacturing scale-up costs are accumulating, has a compounding effect on the capitalized cost that is disproportionately larger than a one-year delay in Phase I. Any tool that reduces Phase III attrition or compresses Phase III duration generates a non-linear return on its implementation cost.
2.3 Attrition Rates by Phase and Therapeutic Area: Where the Math Fails Most Programs
The overall likelihood of approval for a drug entering Phase I is 7.9%. That figure alone drives the capitalized cost calculation. Phase-by-phase, the transition probabilities are: Phase I to Phase II, approximately 52-70% (primary failure mode: unmanageable toxicity); Phase II to Phase III, approximately 29-40% (primary failure mode: lack of clinical efficacy, accounting for 40-50% of all clinical failures); Phase III to approval, approximately 58-65%; and regulatory approval itself, approximately 91% of drugs that submit an NDA or BLA receive approval.
The therapeutic-area variance in these figures is large enough to alter investment theses. Hematology drugs achieve a Phase I-to-approval likelihood of 23.9%. Urology drugs achieve 3.6%. Oncology, the most heavily funded therapeutic area, sits at roughly 5.3% overall, though this number improves substantially for targeted therapies with validated biomarker strategies. Psychiatry and neurology remain stubbornly low at 7-9%, partly because biomarker-defined patient selection is less mature.
For patent strategy, the therapeutic-area probability distribution matters because it determines how much of a patent term is statistically likely to be consumed before a drug reaches the market. A hematology program with a 23.9% LOA has a much higher expected present value from a given patent filing than a urology program with a 3.6% LOA, all else equal.
2.4 The Phase II Leverage Point: Maximum ROI for AI Intervention
The go/no-go decision at the Phase II/III stage gate is the single highest-leverage intervention point in drug development. Moving a program from Phase II to Phase III commits a company to an average incremental expenditure of at least $100-300 million, often significantly more for large oncology trials. A wrong decision at this gate, advancing a drug that ultimately fails Phase III on efficacy grounds, destroys more capital than any other single decision in the development cycle.
AI-driven patent intelligence improves this decision in two distinct ways. First, a real-time competitive landscape analysis at the Phase II gate reveals whether a competitor has already filed patents on the same mechanism, formulation, or indication, which would complicate the IP position of a Phase III program. Second, predictive models trained on Phase II outcome data and patent characteristics can generate a probability-adjusted likelihood of regulatory approval that is more granular than the flat 29-40% historical average. That granularity changes capital allocation decisions.
Key Takeaways from Section 2
Phase II is the highest-priority stage gate for AI intervention because it sits at the maximum point of capital commitment uncertainty. Capitalized development cost, not out-of-pocket cost, is the correct metric for evaluating the ROI of patent intelligence investment. Therapeutic-area LOA variance means that IP valuation models must be disease-area-specific rather than industry-averaged.
Section 3: The Patent as a Core Financial Asset: IP Valuation Across the R&D Lifecycle
3.1 The 20-Year Clock and Effective Market Exclusivity: A Shrinking Numerator
A U.S. utility patent grants exclusivity for 20 years from the filing date of the non-provisional application. Because the first-to-file system incentivizes early filing, and because discovery-phase patent applications are routinely filed 10-15 years before a drug reaches the market, the effective market exclusivity period available to recoup the $2.6 billion capitalized development cost is typically 7-12 years. The math is straightforward: 20 years minus 10-15 years of development equals a shrinking window.
The Hatch-Waxman Act provides two mechanisms that partially compensate for this erosion. Patent Term Extension (PTE) allows a sponsor to recover up to 5 years of patent term lost during the FDA regulatory review process, subject to a ceiling of 14 years of post-approval exclusivity. New Chemical Entity (NCE) exclusivity provides 5 years of data exclusivity that prevents generic ANDA filings regardless of patent status. Pediatric exclusivity adds 6 months to any existing patent or exclusivity period. These statutory mechanisms are valuable but their application is fixed; they cannot compensate for delays created by clinical failures or poor development planning.
3.2 Quantifying Patent IP Value: Discounted Exclusivity Cash Flow Modeling
For pharma IP teams and the investment analysts who cover them, a patent is not simply a legal instrument; it is a cash-flow-generating asset with a deterministic expiration date and a probabilistic enforcement profile. The standard IP valuation method for pharmaceutical patents applies a Discounted Cash Flow (DCF) framework to projected exclusivity revenues.
The core model has four inputs. The first is projected peak annual sales under exclusivity, which requires a revenue forecast for the protected period. The second is the effective exclusivity window, measured from approval date to the earliest relevant patent expiration or loss of exclusivity event (LOE). The third is a Paragraph IV litigation probability discount, which reduces expected revenues based on the modeled likelihood of generic challenge and successful invalidation. The fourth is a discount rate that reflects the cost of capital and development risk, typically 10-15% for late-stage assets and higher for earlier-stage compounds.
For a drug with projected peak sales of $2 billion per year, a 10-year effective exclusivity window, a 20% Paragraph IV challenge probability with a 50% success rate for the generic challenger (a common assumption for composition-of-matter patents with strong prosecution histories), and a 12% discount rate, the net present value of the patent IP asset is materially different from a simple multiplication of revenue by years. The litigation discount alone, applied probabilistically across the exclusivity period, can reduce apparent asset value by 15-25% in pre-deal IP due diligence.
AI changes this calculation by improving the precision of each input, particularly the Paragraph IV litigation probability. Machine learning classifiers trained on historical ANDA filing data, Orange Book patent characteristics, and claim language features can generate a litigation probability estimate that is drug-specific rather than sector-averaged, substantially improving the accuracy of the valuation model.
3.3 IP Valuation by Patent Layer: Composition of Matter vs. Secondary Patents
Within a multi-patent portfolio, different patent types carry different IP valuations. A composition-of-matter patent covering the active pharmaceutical ingredient is the highest-value asset because it provides broad exclusivity over any use of the molecule. Its valuation should reflect the full peak-sales potential of all approved indications, discounted for LOE and litigation risk.
A formulation patent, by contrast, protects a specific delivery mechanism: extended-release, subcutaneous injection, transdermal patch. Its IP value is bounded by the incremental commercial premium that the formulation commands over a basic dosage form. If the extended-release version captures 30% of market share at a 20% price premium, and the formulation patent expires 3 years after the composition-of-matter patent, its standalone IP value is modest. Its strategic value, as a tool for delaying generic formulation entry, is substantially higher and is captured in the lifecycle management model rather than the standalone patent DCF.
Method-of-use patents covering new therapeutic indications have IP valuations that track the revenue potential of the indication they protect. A method-of-use patent covering a second oncology indication for an existing drug, where that indication represents an incremental $500 million annual market, is a material asset. A method-of-use patent covering a rare disease indication with limited commercial potential has low standalone IP value but may be valuable for its protective function, preventing a generic manufacturer from labeling a product for that use under carve-out labeling strategies.
3.4 Orange Book Listing as an IP Valuation Signal
For small-molecule drugs regulated under Hatch-Waxman, Orange Book listing is a prerequisite for a patent to trigger the 30-month stay of a generic ANDA approval upon Paragraph IV certification. A patent that is not listed in the Orange Book provides exclusivity but no statutory litigation mechanism against generics. Orange Book eligibility criteria limit listings to drug substance patents, drug product (formulation) patents, and method-of-use patents for approved indications. Process patents are not eligible.
The number and character of Orange Book listings for a given product is therefore a direct indicator of the patent portfolio’s litigation leverage. A product with a composition-of-matter patent expiring in 2027 and six secondary patents listed in the Orange Book with expirations ranging to 2035 has a complex but theoretically defensible exclusivity position. Each listed secondary patent forces a generic challenger to file a Paragraph IV certification against every listed patent, triggering individual 30-month stays (subject to limits on sequential stays) and creating a multi-front litigation burden designed to delay generic entry. AI-powered Orange Book monitoring that tracks the addition and removal of patent listings in real time is an underutilized tool for both brand sponsors modeling their own exclusivity position and generic sponsors planning ANDA filing strategies.
Key Takeaways from Section 3
Patent IP valuation requires a probabilistic DCF model, not a simple revenue-times-years calculation. Paragraph IV litigation probability is the most consequential uncertainty variable in the model, and AI classifiers trained on historical challenge data substantially improve its precision. Orange Book listing status is a real-time proxy for a brand sponsor’s litigation leverage and should be monitored continuously by both sides of the generic entry equation.
Investment Strategy Note for Section 3
Institutional investors evaluating pharma companies should extract the effective exclusivity window for each lead asset, the Orange Book patent count and expiration distribution, and the Paragraph IV litigation history of analogous patents in the same drug class. A company with a composition-of-matter patent on its top-selling drug expiring in 24 months and no successfully defended secondary patents in its therapeutic area is a structurally weaker investment than its top-line revenue suggests. An AI-driven patent intelligence platform that models the LOE date distribution for a portfolio is a more reliable input to a pharma equity valuation than consensus sell-side estimates, which frequently underestimate the speed of generic erosion post-LOE.
Section 4: Evergreening Roadmaps: Small Molecule Tactics vs. Biologic Lifecycle Strategies
4.1 The Small Molecule Evergreening Toolkit
Evergreening refers to the practice of filing secondary patents that extend market exclusivity beyond the expiration of the primary composition-of-matter patent. For small-molecule drugs, the toolkit is extensive, well-established, and increasingly scrutinized by antitrust regulators and payers.
The primary composition-of-matter patent, once issued, becomes the anchor around which secondary layers are constructed. The first secondary layer typically targets formulation: an extended-release or modified-release version that delivers a clinical benefit (once-daily dosing, reduced peak-trough variability, improved tolerability) sufficient to support a separate NDA and independent patent prosecution. The clinical benefit must be real; regulators and courts both apply heightened scrutiny to formulation patents that deliver only incremental changes without measurable patient benefit.
The second secondary layer targets polymorphs and salt forms. A drug molecule can exist in multiple crystalline forms, each with potentially different stability, solubility, and bioavailability characteristics. If a specific polymorph has demonstrably superior pharmaceutical properties and was not described in the original composition-of-matter patent (or was insufficiently described to anticipate), it is patentable. Polymorph patents have a mixed litigation record because competitors routinely design around them by identifying alternative polymorphs or amorphous forms that fall outside the claim scope.
The third secondary layer targets new therapeutic indications through method-of-use patents. A drug approved for hypertension that is later found effective for heart failure protection generates a patentable method-of-use claim for the cardiac indication. These patents are often narrower in scope than composition-of-matter claims and can be circumvented by generic carve-out labeling, which omits the patented indication from the generic prescribing information. Carve-out labeling is a legally recognized mechanism under Hatch-Waxman but creates a patchwork prescribing environment that limits its commercial effectiveness.
The fourth secondary layer, combination patents, is increasingly important in therapeutic areas like oncology, HIV, and cardiovascular disease, where multi-drug regimens are standard of care. A patent on a fixed-dose combination of two drugs, each already approved individually, can extend exclusivity on the combination product even after the individual composition-of-matter patents expire. AbbVie’s Humira (adalimumab) portfolio, which at peak contained over 100 granted or pending patents filed across multiple jurisdictions, is the most cited example of a systematic secondary patent strategy, though it has also drawn extensive antitrust litigation and regulatory scrutiny.
For a small-molecule evergreening roadmap to be viable, the R&D timeline must be designed from the initial IND filing to include parallel tracks for each secondary patent category. A formulation improvement that requires a 2-year bioavailability study must be initiated early enough that the resulting patent can be granted and Orange Book-listed before the primary patent expires. This means the lifecycle management plan cannot be developed after Phase III approval; it must be integrated into the Phase I/II development protocol design.
4.2 The Biologic Lifecycle Strategy: A Structurally Different Problem
Biologics, including monoclonal antibodies, fusion proteins, recombinant proteins, and cell and gene therapies, face a different IP structure than small molecules. The core IP protection for a biologic comes from both patent law and the regulatory exclusivity framework established by the Biologics Price Competition and Innovation Act (BPCIA), which provides 12 years of data exclusivity from the date of reference product approval. This 12-year data exclusivity window is substantially longer than the 5-year NCE exclusivity available to small molecules and operates independently of patent status.
The BPCIA also establishes the “patent dance,” a structured information-exchange process between a biosimilar applicant and the reference product sponsor that determines which patents will be litigated before biosimilar approval. The patent dance requires the biosimilar applicant to disclose its manufacturing process, which the reference product sponsor can compare against its own process patents. This mechanism makes process patents, which are not Orange Book-listable for small molecules, strategically central to biologic exclusivity defense.
The biologic evergreening toolkit therefore looks different from the small-molecule version. Manufacturing process patents covering cell culture conditions, purification steps, and formulation buffers are the primary secondary layer. Dosing regimen patents covering specific administration schedules (loading dose plus maintenance dose, subcutaneous versus intravenous) constitute a second layer. Biomarker patents that protect companion diagnostic methods for patient selection are a third layer. Device patents covering auto-injector or pre-filled syringe designs are a fourth layer, particularly relevant for self-administered biologics.
For biosimilar entry, the relevant analytical question for a generic/biosimilar sponsor is not just when the composition-of-matter patent expires but when the last relevant process patent expires, when the 12-year data exclusivity period ends (which may be earlier or later than the patent cliff), and how many patents are listed in the FDA’s Purple Book equivalent and what their expiration distribution looks like.
4.3 The Technology Roadmap for Biologic IP Defense: ADCs, Bispecifics, and Cell Therapy
Three classes of biologics currently generating the most aggressive patent filing activity are antibody-drug conjugates (ADCs), bispecific antibodies, and cell/gene therapies (CAR-T, AAV gene delivery). Each has a distinct technology roadmap with a corresponding IP protection strategy.
For ADCs, the IP stack covers four components: the antibody itself (antigen specificity, binding epitope), the linker chemistry (cleavable vs. non-cleavable, stability profile), the payload (cytotoxic small molecule, drug-to-antibody ratio range), and the conjugation site. A competitor attempting to design around an ADC patent portfolio must navigate all four layers simultaneously. Platform ADC developers like AstraZeneca (through its Daiichi Sankyo collaboration), Roche/Genentech, and Seagen (acquired by Pfizer in 2023 for $43 billion, a transaction in which ADC IP assets were a primary valuation driver) have built multi-hundred-patent portfolios that cover not just specific ADC products but the underlying platform technologies.
For bispecific antibodies, IP protection covers the molecular architecture (IgG format, tandem scFv, bispecific T cell engager), the specific antigen pair, the binding domain sequences, and the manufacturing process for assembling the heterodimeric structure. The Knobs-into-Holes technology developed by Genentech for producing asymmetric bispecific IgG formats is a foundational platform patent with broad claim coverage; its expiration schedule directly affects the biosimilar entry timing for bispecific products built on that format.
For CAR-T and AAV-based gene therapies, IP protection is multi-layered across the vector design, the transgene construct, the manufacturing process (ex vivo versus in vivo, viral vector production), and the clinical protocol (conditioning regimen, dosing). The patent positions of Novartis (CTL019/Kymriah, licensed from the University of Pennsylvania), Kite Pharma/Gilead (Yescarta, derived from NCI-licensed technology), and bluebird bio (lentiviral vector manufacturing) illustrate how early academic-origin patents can create both foundational blocking positions and complex licensing obligations. AI-driven freedom-to-operate analysis for cell therapy programs must track not just granted patents but pending applications at WIPO, the EPO, and individual national offices, because the cell therapy patent landscape is still being written in real time.
Key Takeaways from Section 4
Small-molecule evergreening requires a parallel R&D track for formulation, polymorph, and method-of-use innovations that must begin during Phase I/II to generate viable secondary patents before the primary composition-of-matter patent expires. Biologic IP defense is structurally more complex because it integrates BPCIA data exclusivity (12 years), manufacturing process patents (accessible through the patent dance), and device/delivery patents. ADC, bispecific, and cell/gene therapy platforms have layered, multi-component IP stacks where AI-powered landscape analysis is the only scalable tool for tracking the full patent map across all components simultaneously.
Investment Strategy Note for Section 4
For investors, the quality of a company’s evergreening roadmap is a leading indicator of long-term revenue sustainability. A biologic with a 12-year data exclusivity period and a robust manufacturing process patent portfolio has a structurally more defensible revenue profile than a biologic whose only protection is the composition-of-matter patent. For small molecules, count the number of secondary patents with Orange Book listing and model their expiration dates relative to the primary LOE; the resulting revenue decay curve is a better forecast of post-LOE performance than market consensus typically reflects.
Section 5: AI-Powered Patent Intelligence: Technical Methodologies and Architecture
5.1 The Data Problem: Why Raw Patent Data Is an Unreliable Input
The global patent system contains roughly 120 million patent documents across more than 150 jurisdictions, with approximately 3 million new applications filed annually. For pharmaceutical analysis, the relevant population is smaller but still orders of magnitude larger than any human team can process manually. The USPTO’s Patent Full-Text Database, the EPO’s Espacenet, and WIPO’s PATENTSCOPE together provide primary access to this data, but raw patent office feeds have significant quality problems that make them inadequate as direct AI training inputs.
Assignee name inconsistency is the most pervasive problem. A single company may appear under dozens of variants across different jurisdictions: “Pfizer Inc.,” “Pfizer Incorporated,” “Pfizer GmbH,” “Pfizer Ltd.,” historical predecessors after M&A, and subsidiary names. Training a competitive intelligence model on uncleaned assignee data will misattribute filings and distort competitor analysis. Legal status data (granted, abandoned, lapsed, in opposition) is often delayed or incomplete in public feeds, creating the risk that an analyst treats an abandoned patent as a live blocking position.
Pharmaceutical-specific patent structures add additional complexity. Markush structures, the chemical notation system used in pharmaceutical composition claims that defines a genus of compounds through a variable substituent syntax, are not parseable by standard text extraction tools. A Markush claim can cover billions of distinct chemical entities in a single claim element, and determining whether a specific compound falls within a Markush claim requires specialized computational chemistry tools working in conjunction with NLP. General-purpose patent search engines, including Google Patents, cannot perform this analysis and therefore cannot provide reliable prior art or infringement assessments for pharmaceutical compound patents.
5.2 NLP Architecture for Pharmaceutical Patent Analysis
The NLP technology stack for pharmaceutical patent intelligence has three functional layers. The first is document parsing and entity extraction. The second is relation extraction and knowledge graph construction. The third is semantic similarity and prior art detection.
At the entity extraction layer, Named Entity Recognition models identify and classify key information within patent text: chemical compounds (with CAS number resolution where possible), gene targets and protein families, disease states and ICD codes, dosage ranges, administration routes, manufacturing process parameters, and inventor and assignee names. Domain-specific transformer models fine-tuned on pharmaceutical and chemical patent corpora, including variants of BERT trained on patent text (Patent-BERT) and scientific literature (SciBERT, ChemBERT), substantially outperform general-purpose language models on pharmaceutical NER tasks, achieving precision and recall scores in the 85-92% range on benchmark datasets for drug-entity recognition.
At the relation extraction layer, the model maps relationships between extracted entities: “Compound X inhibits Target Y,” “Formulation A achieves bioavailability B at dose C,” “Process D is used to manufacture Compound X with purity E.” These relational triples populate a knowledge graph that links across patent documents, creating a machine-readable map of how innovations in one filing relate to innovations in others. This knowledge graph is the foundation for both competitive intelligence (tracking how a competitor’s innovation strategy evolves across filing generations) and freedom-to-operate analysis (determining whether a proposed compound or process falls within the claims of existing patents).
At the semantic similarity layer, embedding models convert patent claims into dense vector representations. Two claims with high semantic similarity score (measured by cosine similarity between their vector representations) describe overlapping technical territory, even if they use different terminology. This is the capability that makes AI-powered prior art detection meaningfully better than keyword search: a drug patent that describes a compound’s mechanism using the language of 2010 may be prior art to a 2024 patent that describes an identical mechanism using updated scientific terminology. Keyword search misses this overlap; semantic similarity analysis catches it.
5.3 Machine Learning Models for Predictive Patent Analytics
The predictive layer of an AI patent intelligence system uses supervised machine learning models trained on historical outcome data. The training datasets link patent characteristics (claim scope, prosecution history, citation network, technology classification, assignee litigation history, Orange Book listing status) to observed outcomes (Paragraph IV challenge frequency, litigation win/loss ratios, patent renewal rates, LOE actual versus projected).
Gradient boosting models (XGBoost, LightGBM) currently achieve the best performance on tabular patent metadata classification tasks, including litigation probability prediction, where they consistently outperform logistic regression and random forest baselines. Deep learning architectures (transformer-based models) perform better on tasks that require reading and interpreting the actual patent text, such as patentability scoring of draft claims or semantic prior art detection. Ensemble approaches that combine gradient boosting on metadata features with transformer-based text features achieve the highest overall accuracy on pharmaceutical patent outcome prediction benchmarks.
Published research has demonstrated that machine learning models incorporating patent-related features alongside molecular and clinical trial data can predict the probability of drug approval at levels that outperform models using clinical data alone. A 2022 study in a peer-reviewed journal found that a model combining molecular physicochemical properties, clinical trial phase transition history, and patent characteristics (including claim breadth measures and litigation history) achieved an AUC of 0.76 for approval prediction, compared to 0.68 for a clinical-data-only baseline. The patent features with the highest feature importance in the model were the number of independent claims (broader patents are more litigated and potentially more vulnerable), the time elapsed since the earliest priority date (a proxy for effective patent life remaining), and the presence of a Paragraph IV litigation history for related patents from the same assignee.
5.4 Knowledge Graph Integration and Cross-Source Data Fusion
The highest-fidelity patent intelligence systems integrate patent data with four additional data streams: clinical trial registries (ClinicalTrials.gov, EU Clinical Trials Register), FDA regulatory databases (Orange Book, Purple Book, ANDA and BLA approval records), litigation databases (PTAB inter partes review decisions, district court Hatch-Waxman litigation outcomes), and scientific literature (PubMed, bioRxiv preprints). The integration of these streams into a unified knowledge graph allows for cross-source inference that no single data source can support.
A concrete example: a new patent application assigned to Company X covers a specific formulation of a known compound. The knowledge graph links this filing to an open Phase II trial registered by Company X on ClinicalTrials.gov for the same compound in a new indication. It also links both to a recent publication from Company X’s research group characterizing the compound’s extended-release pharmacokinetics. And it links all three to an existing Orange Book listing for the compound’s primary indication with a primary composition-of-matter patent expiring in 14 months. The integrated picture, which no individual database would reveal, is that Company X is executing a classic pre-LOE lifecycle extension strategy: filing a formulation patent, building clinical evidence for a new indication, and preparing to defend market position before the primary patent cliff. This inference, available in near real time if the knowledge graph is continuously updated, gives a competitor or generic sponsor 2-3 years of warning to plan a counter-strategy.
Key Takeaways from Section 5
Raw patent office data is too inconsistent and incomplete for direct AI training without substantial preprocessing, entity resolution, and legal status harmonization. NLP models for pharmaceutical patents must handle Markush structure parsing, domain-specific chemical entity recognition, and semantic similarity search, capabilities that general-purpose AI tools do not have. The highest-fidelity competitive intelligence comes from knowledge graphs that fuse patent data with clinical trial registries, FDA databases, and litigation records, enabling cross-source inferences that individual data streams cannot support.
Section 6: Competitive Milestone Forecasting with NLP: How to Read a Competitor’s R&D Calendar
6.1 The Patent Filing as an Unintentional Progress Report
Pharmaceutical companies rarely announce their pre-clinical research programs. Early-stage R&D is proprietary, and competitive sensitivity prevents disclosure until a program is mature enough to benefit from partnership visibility or public investor attention. But every company is legally required to disclose the technical content of their inventions when they file for patent protection, and this disclosure creates a systematic, exploitable intelligence gap.
A provisional patent application filed with the USPTO becomes publicly available 18 months after its filing date. A non-provisional application filed during Phase I or II of a clinical program, which is common practice for formulation and method-of-use innovations, discloses technical details about the clinical-stage compound: its dosage range, its preferred route of administration, its manufacturing characteristics, and often the specific patient population being targeted. An NLP system that monitors new patent publications in real time can extract these signals within days of publication, years before a competitor’s Phase III press release.
The filing sequence itself carries information beyond the text. A provisional application followed 12 months later by a non-provisional filing indicates that the company evaluated the early-stage discovery sufficiently to commit to full prosecution costs, a signal of increased internal confidence in the program. A non-provisional application followed by a continuation-in-part (CIP) filing typically indicates that the scope of the original invention has been extended to cover new data generated during clinical trials, often including new indications or formulations discovered during Phase II. A series of method-of-use continuation applications filed in a 12-18 month window following Phase III completion suggests an active lifecycle extension program aimed at capturing additional indication-specific claims before the primary LOE.
6.2 Building a Competitor Patent Filing Timeline: Methodology
A structured competitive milestone forecast requires four analytical steps. The first is portfolio segmentation: group a competitor’s patent portfolio by therapeutic area, compound class, and development stage using CPC classification codes, NLP-extracted disease and target entities, and clinical trial cross-referencing. This creates a map of where the competitor is actively innovating versus where they are filing defensively.
The second step is filing velocity analysis: measure the rate of new application filings per therapeutic area per quarter, weighted by claim breadth scores from NLP analysis. Accelerating filing velocity in a specific area, even without public clinical announcements, is a leading indicator of increased R&D investment in that area. AstraZeneca’s ADC filing velocity accelerated substantially in the 2019-2021 period before the scale of its Daiichi Sankyo partnership became fully apparent from public disclosures.
The third step is priority date mapping: identify the earliest priority dates for patents covering a competitor’s lead programs. Because clinical programs typically begin after a priority date is established (the composition-of-matter patent is usually filed before the IND), the priority date distribution provides an inferred timeline of when R&D programs were initiated. Comparing priority date distributions across a competitor’s portfolio reveals the historical cadence of their discovery engine, which can be used to forecast when the next generation of programs will likely enter clinical development.
The fourth step is clinical trial cross-referencing: match patent entities (compound names, target names, formulation descriptors) against ClinicalTrials.gov to identify which patent-protected programs have already entered clinical development, which are pre-IND (no matching trial found), and which patents appear to have been abandoned (no trial, no continuation filings, maintenance fees lapsed). The residual pre-IND programs are the most interesting for competitive forecasting because they represent active R&D investment that has not yet generated public clinical signals.
6.3 Case Study Architecture: Monitoring a Biosimilar Entry Strategy
For a biosimilar sponsor, the intelligence question is precisely defined: when does each patent protecting the reference product expire, what is the vulnerability of each patent to Paragraph IV challenge or IPR petition, and what is the realistic first date of biosimilar market entry? NLP-driven patent monitoring answers each element of this question.
First, the tool identifies all patents associated with the reference product through Orange Book or Purple Book listings, plus any unlisted patents that could be asserted in patent dance litigation under the BPCIA. Second, for each listed patent, the system applies a patent vulnerability scoring model that evaluates claim breadth (broader claims are more vulnerable to invalidity challenges on obviousness and written description grounds), prosecution history (extensive amendments and rejections during examination suggest a narrower effective scope than the issued claims imply), citation density (heavily cited patents have been more thoroughly reviewed by prior art), and prior IPR petitions (a patent that has already survived an IPR challenge is statistically less likely to be successfully challenged again).
Third, the system tracks the actual patent dance timeline for any pending biosimilar applications, including the 60-day information exchange window, the 45-day patent identification window, and the negotiation period, and flags any departures from the statutory schedule that could indicate strategic maneuvering by either party. This tracking, combined with the vulnerability model, generates a probability distribution of biosimilar approval dates that is substantially more precise than a simple “earliest composition-of-matter expiry” estimate.
Key Takeaways from Section 6
Patent filing sequences are an unintentional disclosure of competitor R&D calendar milestones. Filing velocity, priority date distribution, and clinical trial cross-referencing together generate a competitor R&D timeline that extends 2-5 years before public clinical announcements. For biosimilar sponsors, NLP-driven patent vulnerability scoring combined with patent dance timeline monitoring produces LOE probability distributions that are more precise than simple patent expiry date analysis.
Section 7: Litigation Risk Prediction: Modeling the Paragraph IV Threat Vector
7.1 The Mechanics of a Paragraph IV Challenge
Under Hatch-Waxman, a generic sponsor filing an ANDA must certify the status of each patent listed in the Orange Book for the reference drug. A Paragraph IV certification asserts that the listed patent is invalid, unenforceable, or will not be infringed by the generic product. This certification is treated as an act of patent infringement, which allows the brand sponsor to sue immediately under 35 U.S.C. 271(e)(2) and automatically triggers a 30-month stay of FDA’s ANDA approval decision, regardless of the merits of the challenge. The 30-month stay is one of the most powerful litigation tools available to brand pharmaceutical companies: it guarantees a minimum 2.5-year delay of generic entry from the date of the first Paragraph IV suit, without any preliminary injunction showing.
The strategic and financial stakes of Paragraph IV litigation are substantial on both sides. Brand sponsors have invested in the patented drug’s R&D and commercial infrastructure; a successful generic challenge erodes revenue by 80-90% within the first year of generic entry. Generic sponsors, who must certify each listed patent and pay substantial litigation costs, receive a 180-day exclusivity period as the “first filer” if they successfully challenge a patent. For a blockbuster drug with $2 billion in annual revenue, the 180-day generic exclusivity period is worth roughly $300-500 million in generic revenue, making the litigation investment economically compelling even against a long-shot patent challenge.
7.2 Predictive Features for Paragraph IV Litigation Models
Machine learning classifiers for Paragraph IV litigation prediction draw on features from four categories. Patent-level features include: independent claim count (more independent claims correlates with more Paragraph IV filings because there is more claim surface for a challenger to attack), claim breadth score (narrow claims with many limitations are less likely to be both infringed and invalid), the patent’s prosecution history length (extended prosecution with many rejections may indicate claim scope restrictions that limit infringement exposure), and the patent’s citation count from subsequent filers (high forward citation suggests the patent covers foundational technology, which attracts challenge).
Drug-level features include: annual net revenue of the reference product (higher-revenue drugs attract more Paragraph IV challenges, as the 180-day generic exclusivity is worth more), the number of existing generic competitors (some generic market saturation reduces the economic incentive for additional challengers), and the therapeutic area (some areas, particularly cardiovascular and CNS drugs, have historically higher Paragraph IV challenge rates than others).
Sponsor-level features include: the brand sponsor’s litigation win rate in prior Paragraph IV cases (a high historical win rate deters some challengers), the brand sponsor’s patent portfolio density for the reference product (more listed patents mean more certifications required, increasing challenger cost), and the sponsor’s history of settling Paragraph IV litigation versus going to trial (sponsors with a history of authorized generic settlements may attract challenges from sophisticated generic sponsors who expect settlement value).
Published models trained on historical ANDA filing data have achieved accuracy rates of 70-80% in predicting which drugs will face a Paragraph IV challenge within 3 years of LOE, and 65-70% accuracy in predicting which challenged patents the brand sponsor will ultimately win. These accuracy rates are sufficient to materially improve capital allocation decisions: a generic sponsor can rank its ANDA filing targets by predicted challenge success probability, concentrating litigation resources on the cases with the highest expected value.
7.3 Inter Partes Review as a Parallel Threat Vector
The America Invents Act (2012) created the inter partes review (IPR) process at the USPTO Patent Trial and Appeal Board (PTAB), providing an administrative mechanism for third parties to challenge the validity of an issued patent. IPR petitions can be filed by any party, not just ANDA filers, and the proceedings are faster and cheaper than district court litigation. The invalidation rate for pharmaceutical patents in completed IPR proceedings has been approximately 60-70% for claims that reach final written decision, making PTAB a highly effective tool for patent challengers.
For brand sponsors, IPR filing patterns against their patents are a direct signal of competitive threat. AI monitoring of PTAB filings, which are publicly available through the PTAB’s electronic filing system, allows a brand sponsor to detect new IPR petitions within days of filing and immediately assess whether the petition’s prior art grounds are novel or duplicative of arguments already considered during prosecution. For generic sponsors, AI-powered IPR strategy tools can identify the closest prior art references using semantic similarity search, score their strength as obviousness or anticipation grounds, and model the PTAB’s likely institution decision based on historical institution rate patterns for the relevant claim type and technology area.
Key Takeaways from Section 7
Paragraph IV litigation probability is a deterministic function of patent characteristics, drug revenue levels, and sponsor behavior patterns that machine learning models can score with 70-80% historical accuracy. IPR proceedings at PTAB have a 60-70% patent claim invalidation rate, making them the higher-efficacy challenge vehicle for generic sponsors with strong prior art. AI monitoring of both ANDA filings and PTAB petition activity provides brand sponsors with early warning of challenges weeks to months before they are publicly announced in press releases.
Investment Strategy Note for Section 7
Equity analysts covering branded pharmaceutical companies should model the Paragraph IV challenge probability for each of a company’s top products as a standard component of revenue forecast risk analysis. A brand company with two products generating 60% of revenue, both facing LOE in 36 months and both carrying high Paragraph IV challenge probability scores, has materially greater revenue risk than a simple LOE calendar analysis suggests. Conversely, a company with a diversified LOE schedule and demonstrably narrow, well-prosecuted secondary patent portfolios may face less generic erosion than consensus estimates predict.
Section 8: Freedom-to-Operate in the AI Era: From Quarterly Audits to Continuous Monitoring
8.1 The Traditional FTO Workflow and Its Structural Deficiencies
A Freedom-to-Operate analysis determines whether the manufacture, use, or sale of a proposed product or process infringes any valid, enforceable patent claims in a target jurisdiction. In traditional practice, an FTO is a discrete project: a patent attorney assembles a search team, defines the search landscape, conducts keyword and classification-based searches across patent databases, reviews candidate patents for infringement analysis, and delivers a written opinion. This process typically takes 6-12 weeks, costs $30,000-$150,000 per jurisdiction depending on complexity, and is valid only as of its report date. New patents publish every week; an FTO conducted at the start of Phase II may miss a key patent filed during Phase III.
The point-in-time nature of traditional FTO is its central limitation. Drug development runs for 10+ years, and the patent landscape in any active therapeutic area changes continuously. A company that conducts an FTO at the pre-IND stage and then again at pre-NDA filing has a significant blind spot for the intervening decade. A competitor that published a patent application during Phase III trials, which the company missed, can represent a blocking position that derails market launch, triggers expensive litigation, or forces a royalty-bearing license at a moment of maximum commercial vulnerability.
8.2 Continuous AI-Powered FTO Monitoring: Architecture and Workflow
The AI-era alternative replaces the periodic FTO project with continuous, automated monitoring. The architecture has three components. The first is a defined product fingerprint: a structured technical description of the drug candidate including its chemical structure (or biologic sequence), intended therapeutic use, proposed formulation, and key manufacturing process steps. This fingerprint is expressed in a format that the monitoring system can use as a query vector.
The second component is a semantic similarity monitoring engine: an NLP system that continuously indexes new patent publications from all relevant jurisdictions and runs them against the product fingerprint using vector similarity scoring. Patents above a configurable similarity threshold are flagged for human review. The threshold is set conservatively during development (high sensitivity, accepting false positives) and tightened as the product approaches launch (higher specificity). AI-powered semantic search reduces FTO project timelines by an estimated 40% compared to keyword-based approaches, and continuous monitoring fills the temporal gap that periodic FTO leaves open.
The third component is an infringement analysis scoring model: a classification model that, for flagged patents, scores the probability that the proposed product falls within the scope of the patent’s claims based on claim language, prosecution history, and prior claim scope interpretations. This is not a legal opinion and cannot replace attorney review, but it prioritizes the human attorney’s review queue, ensuring that the highest-risk patents receive immediate attention while lower-risk flags are batched for periodic review.
8.3 FTO in Biologic and ADC Development: Additional Complexity Layers
FTO analysis for biologics and complex molecules involves several layers of complexity that do not apply to small-molecule drugs. For monoclonal antibodies, the FTO must cover the antibody sequence itself (checked against patent claims that define binding epitopes through sequence identity thresholds or CDR region specifications), the target antigen’s patent status (some antigen patents claim therapeutic antibodies that bind a specific antigen broadly, without sequence limitation), and the manufacturing process (cell line choice, upstream bioprocess parameters, downstream purification steps).
For ADCs, the FTO covers four independently protectable components: the antibody, the linker, the payload, and the conjugation method. A clear FTO on the antibody component does not provide freedom to operate with a specific linker-payload combination if that combination is separately claimed. AI-powered ADC FTO tools that maintain knowledge graphs of the multi-component IP landscape, linking antibody patents to linker patents to payload patents with the ability to query at each node independently, represent the current state of the art for this analysis.
For gene therapy, FTO analysis must cover vector design patents (AAV capsid sequences, promoter choices), transgene construct patents (gene sequence, expression cassette design), manufacturing process patents (production cell line, purification method), and administration route patents (surgical delivery approaches, guided needle techniques). The vector capsid patent landscape is particularly complex because AAV capsid engineering has generated hundreds of patents covering both natural capsid variants and engineered variants, with significant claim scope overlap and ongoing IPR proceedings that are actively changing the enforceability landscape.
Key Takeaways from Section 8
Traditional periodic FTO analysis has a structural temporal gap that creates discovery risk during long development programs. Continuous AI-powered semantic similarity monitoring, updating against all new patent publications in real time, fills this gap. For biologics, ADCs, and gene therapies, FTO analysis must address multi-component IP stacks where each component has independent patent coverage, requiring knowledge-graph-based tools rather than single-query search approaches.
Section 9: White Space Analysis: Mapping Low-Density Innovation Corridors
9.1 What White Space Analysis Measures and Why It Matters for R&D Planning
White space analysis maps the density of patent coverage across a defined technology domain to identify areas where innovation can proceed with minimal IP conflict. It is the offensive counterpart to FTO analysis: where FTO asks “can we do what we are already planning,” white space analysis asks “where could we innovate with the fewest constraints.” The two analyses are complementary inputs to early-stage R&D target selection.
The practical output of a white space analysis is a technology map that partitions a therapeutic area or chemical space into zones of high patent density (where multiple assignees hold overlapping claims, creating a potential thicket and high FTO risk), moderate patent density (where some prior art exists but clear design-around pathways are available), and low patent density (where a company could build a dominant, defensible IP position without navigating existing exclusivity). Directing discovery programs toward low-density zones is a risk-reduction strategy: it reduces the probability of a late-stage FTO failure and increases the probability of achieving broad composition-of-matter claims on a genuinely novel compound.
9.2 Computational Methods for White Space Mapping
The computational approach to white space analysis has three stages. The first stage is landscape mapping: use AI to extract all patents in a defined technology domain (defined by a combination of therapeutic area classification, target class, and chemical structure filters) and represent each patent as a vector in a high-dimensional embedding space based on its claim content. The resulting vector space represents the current structure of the innovation landscape.
The second stage is density mapping: apply unsupervised clustering algorithms (k-means, DBSCAN, or hierarchical clustering, depending on the structure of the patent space) to identify regions of high and low vector density. High-density clusters represent heavily patented technical territories. Low-density regions, and particularly regions that are adjacent to high-density clusters but separated by a gap in patent coverage, represent white spaces where innovation may be possible without entering an existing patent thicket.
The third stage is opportunity scoring: rank white spaces by the combination of their scientific accessibility (can a drug candidate realistically be designed to operate in this chemical or biological space?), their commercial relevance (does the white space represent a therapeutically meaningful area, or is it sparsely patented because it is also scientifically unproductive?), and their strategic defensibility (could the company file broad composition-of-matter claims in this space, or would existing prior art limit claim scope?). The scientific accessibility assessment requires integration of medicinal chemistry expertise and target biology data beyond what patent data alone can provide, which is why white space analysis is most effective as a human-AI collaborative exercise.
9.3 White Space Analysis in Practice: Kinase Inhibitors and GPCRs
The kinase inhibitor space is the most frequently cited example of a heavily patented, high-density pharmaceutical landscape. The human kinome contains approximately 538 kinase domains, and over the past two decades, thousands of patents have been filed covering ATP-binding site inhibitors across the kinome. For a company entering this space today, a naive approach of targeting the most well-validated kinases (EGFR, VEGFR2, BTK, CDK4/6) would encounter a dense patent thicket with little room for novel, broad IP. White space analysis of the kinome reveals that less-explored kinase families, particularly in the kinase orphanome (kinases with validated disease relevance but no approved inhibitors), offer substantially more room for defensible innovation.
GPCR-targeted drugs represent a parallel example. GPCRs are the most drugged target class in human pharmacology, with approximately 34% of approved drugs acting at GPCRs. The most commercially successful GPCR subfamilies (beta-adrenergic receptors, serotonin receptors, dopamine receptors) are densely patented. White space analysis of the GPCR landscape identifies allosteric binding site patents as an area of lower density relative to orthosteric site patents, and biased GPCR agonism (compounds that selectively activate G protein pathways over beta-arrestin pathways) as an area where the patent landscape is less crowded than the validated clinical potential of the approach would suggest.
Key Takeaways from Section 9
White space analysis is an R&D target selection tool that directs discovery investment toward areas of low patent density, reducing the probability of IP conflicts that could terminate programs during late-stage development. Computational white space mapping combines NLP-based patent embedding, unsupervised clustering, and scientific data integration. It is most effective as a human-AI collaborative exercise where the AI maps the patent landscape and human experts evaluate the scientific accessibility and commercial relevance of identified opportunities.
Section 10: The Generative AI Frontier: De Novo Molecular Design, Claims Drafting, and the Inventorship Crisis
10.1 Generative AI in Drug Discovery: Technical Capabilities and Patent Implications
Generative AI models applied to drug discovery perform three distinct functions that have direct IP implications. The first is de novo molecular design: given a target protein structure or a desired pharmacological profile, a generative model produces candidate molecules that have never been synthesized before. Models in this category include variational autoencoders trained on chemical structure databases, generative adversarial networks optimized for molecular property prediction, and transformer-based language models (chemical language models) that treat molecular SMILES strings as a vocabulary and generate novel molecular structures as sequences.
The IP implication of generative molecular design is profound and unresolved. If an AI model generates a novel molecule that is subsequently found to have therapeutic activity, the patent law question is: who invented it? The USPTO guidance issued in February 2024 requires a significant human contribution to an AI-assisted invention for it to be patentable, and the Federal Circuit affirmed in Thaler v. Vidal (2022) that an AI system cannot be named as an inventor under 35 U.S.C. 101. Companies must therefore structure their generative AI workflows to ensure that human scientists make material inventive contributions that go beyond simply prompting a model and accepting its output: selecting training data, defining optimization objectives, evaluating candidate molecules against biological data, choosing which candidates to advance based on scientific reasoning, and designing and interpreting the confirmatory experiments that demonstrate the compound’s utility.
The second generative AI function is patent claims drafting. Large language models can draft initial patent claim sets from a technical disclosure, suggest dependent claim variations that could broaden scope or add fallback positions, and identify potential claim language that might create prosecution history estoppel or enable-ment problems under 35 U.S.C. 112. Law firms and corporate IP departments are rapidly integrating these tools into prosecution workflows, with AI handling the initial draft and a registered patent attorney reviewing, revising, and signing the final application. The efficiency gain is real: pilot programs have reported 30-50% reductions in initial claims drafting time. The risk, equally real, is that LLM-generated claim language may contain subtle scope limitations or use terminology inconsistent with established case law in ways that a non-specialist reviewer misses.
The third generative AI function is prior art landscape generation: given a proposed invention, a generative model synthesizes a summary of the closest prior art, identifies potential obviousness combinations, and flags technical disclosures that could anticipate specific claim limitations. This function is directly useful for pre-filing patentability assessment and for preparing IPR petitions.
10.2 The Inventorship Documentation Imperative
Given the USPTO’s human contribution requirement and the likelihood that patent courts will increasingly scrutinize AI-assisted inventions, companies that use generative AI in drug discovery must implement structured inventorship documentation protocols before filing any patent application on an AI-assisted compound.
The protocol should record, at minimum, the following at each stage of the AI-assisted discovery process. At the model design stage: who designed the training dataset, who selected or designed the model architecture, who defined the optimization objective function, and what scientific reasoning guided those choices. At the molecular generation stage: which generated candidates did human scientists select for synthesis and evaluation, and what scientific criteria (not just model-predicted scores) guided that selection. At the experimental validation stage: who designed the confirmatory assays, who interpreted the results, and what scientific judgment led to the decision to advance the compound. And at the filing stage: which human scientists can articulate an independent inventive contribution that goes beyond mechanical operation of the AI tool.
This documentation is not merely a legal formality. It is the primary evidence a company will rely on if a patent covering an AI-generated drug compound is challenged on inventorship grounds, either by a competitor asserting invalidity in Paragraph IV litigation or by an IPR petitioner. A company that cannot produce contemporaneous inventorship documentation for an AI-assisted compound faces a materially higher risk of inventorship invalidity.
10.3 Generative AI and the Risk of Automated Patent Thickets
One structural risk of generative AI in pharmaceutical IP strategy deserves direct analysis. If generative AI makes it 10-50 times cheaper to draft and file secondary patent applications, sophisticated brand pharmaceutical companies can be expected to use this capability to file substantially larger numbers of secondary patents around their blockbuster products. A lifecycle management program that previously filed 20-30 secondary patents around a primary compound might, with AI-assisted drafting, file 100-200 secondary patents covering a broader range of formulation variations, dosing regimens, polymorph forms, combination partners, and method-of-use sub-claims.
This outcome would have several consequences. For generic and biosimilar sponsors, it increases the cost and complexity of Paragraph IV certification strategies by expanding the number of patents requiring certification and potentially litigating. For regulators and antitrust authorities, it creates a target for enforcement action: the European Competition Network and the FTC have both brought enforcement actions against secondary patent thickets that they determined were not backed by genuine innovation and were primarily designed to delay generic entry. The FTC’s action against AbbVie regarding Humida’s patent portfolio, and the European Commission’s investigation into secondary patents in the pharmaceutical sector under Article 101 TFEU, signal increasing regulatory tolerance for aggressive evergreening.
For AI tools themselves, the proliferation of AI-drafted patent applications could saturate the USPTO’s examination resources, increase pendency times, and contribute to a larger number of low-quality granted patents that will eventually be challenged at PTAB. This dynamic creates a feedback loop: more AI-generated filings increase the economic case for AI-powered IPR petition tools, which in turn increase PTAB petition volumes.
Key Takeaways from Section 10
Generative AI in drug discovery requires structured inventorship documentation protocols at each stage of the AI-assisted workflow, or the resulting patents face invalidation on inventorship grounds. LLM-based claims drafting tools offer genuine efficiency gains but require attorney review that is substantively expert, not merely cosmetic. The automated scaling of secondary patent filing could accelerate antitrust scrutiny and increase PTAB petition activity, creating a system-level risk that offsets some of the portfolio-level benefits.
Section 11: Implementation Framework: Building an AI-Ready Patent Intelligence Function
11.1 Data Infrastructure: The Prerequisite That Comes Before the Algorithm
The most common failure mode in pharmaceutical AI patent intelligence programs is implementing sophisticated algorithms on inadequate data. The “garbage in, garbage out” principle applies with particular force to patent data because the consequences of acting on incorrect IP information range from missed competitive signals to misassessed LOE dates to FTO opinions based on patents that have actually been abandoned or invalidated.
A production-quality pharmaceutical patent intelligence data infrastructure requires five capabilities. The first is multi-jurisdictional patent data ingestion from USPTO, EPO, WIPO, CNIPA (China), JPO (Japan), and the major national patent offices in markets relevant to the company’s commercial footprint, updated with a latency of no more than 14 days from publication date. The second is assignee entity resolution: a canonical entity database that maps all name variants of each pharmaceutical company to a single identifier, updated to reflect corporate M&A events. The third is legal status harmonization: a process for classifying each patent as active, abandoned, lapsed, in opposition, or involved in litigation, drawn from multiple authoritative sources and reconciled where they conflict. The fourth is Orange Book and Purple Book integration: daily monitoring of FDA database updates that add or remove patent listings for approved drugs. The fifth is litigation database integration: PTAB petition status, district court Hatch-Waxman case status, and Federal Circuit appeal outcomes, linked back to the specific patents they concern.
Building this infrastructure from raw public data sources is feasible but requires substantial engineering and data science investment. Many companies find it more efficient to acquire a commercial platform that provides curated, analysis-ready datasets (DrugPatentWatch, Patsnap, Derwent Innovation, Questel) and layer their own AI models on top of the platform’s data layer. The choice between build-and-buy and vendor partnerships depends on the company’s data science capabilities, the scale of its patent monitoring requirements, and whether its competitive advantage lies in the intelligence derived from the data (which argues for building proprietary models) or simply in having access to the data (which argues for purchasing platform access).
11.2 The Human-in-the-Loop Model: How to Structure AI-Attorney Collaboration
AI patent intelligence tools produce outputs that must be reviewed and validated by humans before they drive high-stakes decisions. The appropriate implementation model is human-in-the-loop at every stage where the output influences a capital allocation decision, a go/no-go stage gate, or a legal filing.
For competitive intelligence applications (monitoring competitor filings, building R&D timeline forecasts), AI can operate with minimal human review at the data ingestion and initial flagging stages, with human review focused on the subset of flagged signals above a confidence threshold. A patent attorney and competitive intelligence analyst working together can efficiently review 20-30 flagged competitor filings per week and derive strategic insights that would take months to generate manually. The AI’s role is to ensure that the human reviewers are looking at the right documents; the humans’ role is to interpret what the documents mean in strategic context.
For FTO and patentability applications, human attorney review is mandatory before any opinion is communicated to decision-makers or acted upon. AI dramatically reduces the initial search workload and prioritizes the review queue, but the legal opinion on infringement and validity requires attorney professional judgment that cannot be delegated to an algorithm. Companies that attempt to shortcut attorney review for FTO decisions, relying instead on AI-generated infringement probability scores, face both professional responsibility risks and the practical risk of acting on incomplete analysis.
For litigation risk prediction applications, AI models that score Paragraph IV challenge probability or IPR success likelihood should be treated as directional indicators that inform resource allocation, not as definitive forecasts. A model that scores a patent as having a 75% probability of surviving Paragraph IV challenge does not mean it will survive; it means that historically, patents with similar characteristics have survived at that rate. Litigation outcomes are influenced by judge assignment, specific prior art arguments, expert witness quality, and jury composition in a way that no historical model can fully predict.
11.3 Integration into R&D Stage Gates: A Decision Framework
AI-driven patent intelligence adds the most value when it is embedded into the formal go/no-go decision process at each R&D stage gate, not treated as an ad hoc analytical exercise. A practical stage-gate integration framework has six decision points.
At the target identification stage, white space analysis informs which disease mechanisms and molecular targets offer the best combination of scientific novelty and IP defensibility. At the lead selection stage, an automated patentability prescreening identifies whether proposed lead compounds have prior art that would limit composition-of-matter claim scope, allowing medicinal chemists to design around known prior art before committing to lead optimization. At the candidate selection/IND enabling stage, a preliminary FTO analysis for the lead candidate is conducted across the primary commercial markets (US, EU, Japan, China), with continuous monitoring initiated from this point forward. At the Phase II entry stage, a full competitive landscape NLP analysis identifies all competitors in the indication, maps their patent portfolios, models their estimated development timelines, and updates the regulatory approval probability estimate for the candidate based on the current competitive context.
At the Phase II/III decision gate, the AI-assisted analysis provides three inputs: an updated LOA probability incorporating the Phase II data and the current competitive landscape, a litigation risk model for the candidate’s IP portfolio scoring its vulnerability to Paragraph IV challenge, and a lifecycle management opportunity assessment identifying secondary patent candidates that should be initiated in parallel with Phase III. At the pre-NDA/pre-launch stage, the competitive landscape analysis is updated, the Orange Book listing strategy is finalized, and the continuous FTO monitoring system is placed in maximum-sensitivity mode to catch any late-stage competitive filings that could affect launch planning.
11.4 Organizational Integration: Dissolving the IP Silo
Pharmaceutical companies that have successfully integrated AI-driven patent intelligence into R&D planning share a common organizational pattern: they have dissolved the traditional separation between the IP/legal function and the R&D function. In the siloed model, patent attorneys work reactively, providing FTO opinions and filing applications when scientists bring them new data. In the integrated model, patent intelligence data (competitor filing monitoring, white space maps, LOE forecasts, litigation risk scores) is shared directly with R&D project teams, clinical development leaders, and business development executives as a routine input to strategic planning, not as a legal support function.
This integration requires investment in two capabilities beyond the AI tools themselves. The first is IP literacy training for R&D and business development staff: teaching scientists and commercial leaders to read and interpret patent data, understand claim scope, and recognize IP signals in competitor filings without requiring attorney interpretation for every data point. The second is an IP function that trains its practitioners in data science fundamentals: at minimum, the ability to commission and interpret AI model outputs, design training datasets, and evaluate vendor platform capabilities critically. The title “AI Wrangler,” used informally in some pharma IP departments, describes a practitioner who can fluently operate at the intersection of patent law, pharmaceutical science, and machine learning.
Key Takeaways from Section 11
Production-quality AI patent intelligence requires a multi-jurisdictional data infrastructure with legal status harmonization and litigation database integration before algorithms can produce reliable outputs. Human-in-the-loop review is mandatory for any AI output that feeds a capital allocation decision, FTO opinion, or legal filing. Stage-gate integration, where patent intelligence analysis is a required input at each formal go/no-go decision, is the highest-ROI implementation pattern.
Section 12: Legal and Regulatory Evolution: PHOSITA, XAI Compliance, and the Inventorship Dilemma
12.1 The Evolving PHOSITA Standard in an AI-Native R&D Environment
The Person Having Ordinary Skill in the Art (PHOSITA) is the legal benchmark against which patent claims are assessed for obviousness under 35 U.S.C. 103. A claimed invention is obvious, and therefore not patentable, if a PHOSITA would have found it obvious to arrive at the claimed invention given the prior art at the time of filing. The PHOSITA standard is supposed to reflect the ordinary competence of practitioners in a field, not the extraordinary capabilities of leading researchers.
As AI tools become standard equipment in pharmaceutical R&D, with more than 90% of major pharma companies having invested in AI for drug discovery as of 2025, the effective capability of the ordinary skilled artisan is changing. A PHOSITA in medicinal chemistry now routinely uses generative molecular design tools, AI-powered ADMET prediction models, and automated synthesis planning software. As the courts and USPTO update their conception of PHOSITA capability to reflect this reality, the effective obviousness bar for pharmaceutical patents will rise.
The practical consequence: inventions that would have been non-obvious before 2020, when AI tools were exotic research instruments rather than routine design software, may be obvious today because a PHOSITA with access to a generative molecular design platform could have arrived at the same compound through routine optimization. Patent applicants must therefore document not just what they invented but why a PHOSITA operating with standard AI tools could not have trivially reached the same endpoint. This documentation is most persuasive when it captures unexpected properties or results that the AI optimization objective did not predict, because unexpected results are the most durable defense against an obviousness challenge.
12.2 Explainable AI (XAI) as a Regulatory Compliance Requirement
The FDA’s guidance on AI in drug development, including its 2021 Action Plan for AI/ML-based Software as a Medical Device and its ongoing engagement with AI-assisted clinical trial design, has established a clear preference for AI systems whose decision logic can be explained to regulators. The FDA does not require explainability for all AI applications in drug development, but for AI systems whose outputs influence regulatory submissions (clinical trial site selection, patient eligibility determination, adaptive trial design parameters), the FDA expects sponsors to be able to explain how the system works and why its outputs are reliable.
In the patent intelligence context, XAI requirements apply most directly when AI model outputs are used to support arguments in patent prosecution or litigation. An AI-generated prior art similarity score used to argue that a challenged patent claim was not anticipated requires that the similarity metric and the underlying model be explainable and reproducible. A Paragraph IV litigation risk prediction model used to inform a board-level go/no-go decision on a generic challenge must be auditable: the input features must be documented, the training data disclosed (at least internally), and the model’s limitations acknowledged.
XAI techniques used in pharmaceutical patent intelligence applications include SHAP (SHapley Additive exPlanations) values for feature importance attribution in gradient boosting models, attention weight visualization for transformer-based NLP models (showing which patent text passages drove a similarity score), and model induction methods that approximate the behavior of a complex model with a simpler, interpretable rule set. None of these techniques make a black-box model fully transparent, but they provide sufficient interpretability for regulatory and legal purposes if applied consistently and documented rigorously.
12.3 Data Confidentiality and the Proprietary R&D Data Exposure Risk
The adoption of cloud-based AI patent intelligence platforms creates a category of risk that on-premises deployments do not: the potential exposure of proprietary R&D data to the platform vendor or to the platform’s training processes. When a company uses a third-party AI platform to analyze its own internal patent applications, draft claims, or assess the patentability of an unpublished invention, it is providing the platform with detailed technical information about compounds or processes that may not yet be publicly disclosed.
If the platform vendor’s terms of service permit using user-provided data to retrain models, the company’s confidential technical information could, in principle, leak into a shared model’s weights and influence outputs generated for other users. This risk is not theoretical: several AI tool providers have faced controversy over data use practices. Companies should require, at minimum, contractual assurances that their data will not be used for model training without explicit consent, that data transmission and storage is end-to-end encrypted, and that vendor employees cannot access submitted documents without a documented access control process. For the highest-sensitivity applications (analyzing unpublished compounds, assessing trade secret manufacturing processes), an on-premises or private-cloud deployment is more appropriate than a shared SaaS platform.
Key Takeaways from Section 12
The PHOSITA standard is moving upward as AI tools become routine in pharmaceutical R&D, raising the effective obviousness bar for AI-assisted inventions. Documentation of unexpected results and human creative judgment in AI-assisted workflows is the primary defense against future obviousness challenges. XAI techniques (SHAP values, attention weight visualization) are necessary, not optional, for AI outputs used in regulatory submissions or patent litigation arguments. Data confidentiality on third-party AI platforms is a material IP risk that requires contractual and technical safeguards.
Section 13: Investment Strategy: How Institutional Investors Should Use Patent Intelligence as a Valuation Signal
13.1 Patent Intelligence as a Leading Financial Indicator
Pharmaceutical equity valuations are predominantly driven by peak sales estimates for lead pipeline candidates and by LOE dates for marketed products. Both of these inputs are substantially improved by patent intelligence data, yet most sell-side models treat them as point estimates rather than probability distributions.
The LOE date for a marketed drug is rarely the composition-of-matter expiration date listed in a company’s 10-K. It is the date on which the first generic or biosimilar product with regulatory approval actually enters the market, which depends on the outcome of Paragraph IV litigation, the strength of secondary patent defenses, the regulatory review timeline for the ANDA or biosimilar application, and the strategic behavior of the generic sponsor. A patent intelligence model that generates a probability distribution of generic entry dates, rather than a single LOE date, produces a more accurate revenue forecast, typically showing a wider range of outcomes and a higher expected-case revenue in the medium term if secondary patents are strong, or a lower expected-case revenue if they are weak.
13.2 Patent Portfolio Quality Metrics for Investment Screening
Investors evaluating pharma companies can use patent portfolio quality metrics as a screening tool for R&D execution quality. These metrics are available from commercial patent intelligence platforms or can be constructed from public data.
The effective exclusivity duration ratio measures the average remaining effective patent life for a company’s top revenue-generating products relative to the remaining time to LOE. A company with several products at LOE risk within 36 months, and no FDA-approved line extensions or secondary patents that have survived challenge, has a structurally deteriorating exclusivity position that near-term pipeline catalysts may not fully offset.
The Paragraph IV challenge density metric measures the number of Paragraph IV certifications received per marketed product in the past 36 months relative to industry peers. A company consistently receiving above-average Paragraph IV challenge rates suggests either that its patent portfolios are broadly written (making them high-value but also high-challenge-attracting targets) or that they have a historical pattern of weak patent prosecution that makes them relatively easy to challenge. These two interpretations are distinguishable by examining the company’s win rate in completed Paragraph IV litigation.
The secondary patent density and expiration spread metric assesses whether a company’s secondary patent portfolio (formulation, method-of-use, polymorph) has substantial expiration staggering beyond the primary LOE date. A company with 8 secondary patents expiring in a tight 18-month window following the primary LOE has limited incremental protection; the generic manufacturer challenges all of them simultaneously. A company with secondary patents staggered across a 10-year window after primary LOE has a more defensible revenue protection structure.
The AI investment signal: companies that publicly disclose AI-driven patent intelligence capabilities in R&D planning, that have quantifiable reductions in FTO project timelines, and that have demonstrated white-space-directed discovery programs (identifiable through their patent filing patterns in low-density IP zones) are more likely to execute their R&D timelines with higher precision than comparable companies that do not.
13.3 Biosimilar Entry Timing as an Investment Catalyst
For investors evaluating generic and biosimilar sponsors, AI-derived LOE probability distributions for reference products are a source of investment timing signals that are not available from traditional financial analysis. A biosimilar sponsor whose pipeline product targets a reference biologic with a high patent vulnerability score, a thin secondary patent portfolio, and a 12-year data exclusivity period expiring within 18 months has a structurally favorable entry window that should accelerate the timeline between regulatory approval and revenue generation.
For investors in reference product sponsors, an AI-modeled increase in the expected probability of biosimilar entry for a top-selling biologic in the next 24 months, driven by deteriorating patent portfolio quality scores or an accumulation of PTAB petitions, is a leading indicator of revenue erosion that may not yet be reflected in sell-side consensus estimates. Incorporating patent intelligence signals into pharmaceutical equity models typically produces a divergent valuation: upward revisions for companies with strong, staggered secondary patent portfolios in high-probability LOA therapeutic areas, and downward revisions for companies with concentrated LOE risk and thin secondary patent coverage.
Key Takeaways from Section 13
Patent intelligence converts LOE dates from point estimates to probability distributions, producing more accurate revenue forecasting models. Effective exclusivity duration ratio, Paragraph IV challenge density, and secondary patent expiration spread are quantifiable metrics that institutional investors can use to screen pharmaceutical companies for IP quality risk. For biosimilar investors, AI-derived patent vulnerability scoring is a more precise entry timing signal than simple composition-of-matter expiry date analysis.
Section 14: Data Sources and Platform Landscape
14.1 Public Data Sources
The primary public data sources for pharmaceutical patent intelligence are the USPTO Patent Full-Text and Image Database (updated weekly, accessible via PatentsView and Google Patents APIs), the EPO’s Espacenet and Open Patent Services API (provides European and global PCT data), WIPO’s PATENTSCOPE (PCT applications and national filings from WIPO member states), the FDA Orange Book and Purple Book (updated monthly, downloadable in structured format), the USPTO PTAB API (inter partes review and post-grant review proceedings), and PACER (U.S. federal court litigation records, including Hatch-Waxman district court cases). ClinicalTrials.gov provides clinical trial registration data under a CC0 public domain license and supports API-based queries for cross-referencing patent entities with clinical programs.
The limitations of public sources are well-documented: assignee name inconsistency, legal status lag, and the absence of harmonized, multi-jurisdictional data in a single queryable format. Using these sources directly requires significant data engineering investment.
14.2 Commercial Platform Landscape
The commercial platform landscape for pharmaceutical patent intelligence has three tiers, differentiated by data breadth, AI capability depth, and pharmaceutical-domain specialization.
Domain-specialized platforms built specifically for pharmaceutical IP include DrugPatentWatch (Orange Book integration, LOE forecasting, Hatch-Waxman litigation tracking, drug-specific patent search), IPD Analytics (biologic and branded drug IP lifecycle analysis, focused on formulary and payer-facing IP strategy), and LifeSci IP Advisors (boutique advisory using proprietary patent analytics for institutional investor clients). These platforms prioritize depth of pharmaceutical-specific data over breadth of technology domain coverage.
Broad patent analytics platforms with pharmaceutical modules include Patsnap (global patent database, chemical structure search, AI-powered prior art analysis, R&D workflow integration), Derwent Innovation / Clarivate (Derwent World Patents Index with enhanced titling and abstracting for pharmaceutical compounds, patent analytics, and competitive intelligence tools), and Questel (FTO acceleration tools, AI-assisted patent search, portfolio management). These platforms provide wider cross-industry benchmarking capability at the cost of some pharmaceutical-domain specificity.
Legal-intelligence-focused platforms include Lex Machina (federal court patent litigation analytics, including judge analytics, case duration modeling, and outcome prediction) and Docket Navigator (Hatch-Waxman litigation tracking, claim construction analysis). These platforms do not provide upstream patent search or landscape analysis but provide the highest fidelity data on litigation outcomes.
The optimal platform selection depends on primary use case: brand sponsors focused on lifecycle management prioritize Orange Book monitoring and LOE forecasting (DrugPatentWatch, IPD Analytics); R&D teams focused on competitive intelligence and white space analysis prioritize broad patent landscape tools with strong NLP capabilities (Patsnap, Derwent); IP litigation teams prioritize litigation analytics platforms (Lex Machina, Docket Navigator); and generics sponsors require a combination of FTO tools and litigation analytics. For most organizations above a certain asset scale, a multi-platform strategy combining a pharmaceutical-domain specialist with a broad patent analytics platform produces the highest-quality intelligence output.
Key Takeaways from Section 14
Public patent data sources are adequate for low-stakes research but require substantial engineering investment and data quality work before they can power production AI models. Commercial platforms differ meaningfully by pharmaceutical-domain specificity, AI capability depth, and use-case orientation (R&D intelligence versus lifecycle management versus litigation analytics). Most sophisticated pharma IP functions require a multi-platform strategy rather than a single vendor relationship.
Final Summary: The Case for AI-Driven Patent Intelligence as a Core R&D Discipline
The drug development timeline is not primarily an R&D execution problem. It is an information problem. Companies that know where their competitors are in their R&D calendars, which of their own patents are vulnerable to Paragraph IV challenge, which areas of chemical and biological space offer the best combination of scientific novelty and IP defensibility, and how their own patent portfolio’s LOE schedule maps against their commercial revenue horizon will consistently make better capital allocation decisions than companies operating without that information.
AI-driven patent intelligence makes that information available at the speed, scale, and precision that the complexity of modern pharmaceutical development requires. NLP models that extract competitive signals from patent filings in near real time, machine learning classifiers that score Paragraph IV litigation probability with 70-80% historical accuracy, unsupervised clustering algorithms that map white space in a therapeutic area’s patent landscape, and continuous FTO monitoring systems that catch blocking patents within days of publication: these are not experimental research tools. They are production-ready capabilities that leading pharma and biotech organizations are deploying now.
The remaining barriers to adoption are not technological but organizational: data infrastructure investment, IP function organizational redesign, attorney and scientist training, and the cultural shift required to treat patent data as a strategic planning input rather than a legal record. Organizations that clear these barriers will build a compounding informational advantage over those that do not, an advantage that will manifest in shorter effective development timelines, fewer late-stage IP surprises, more defensible patent portfolios, and a higher proportion of R&D capital reaching commercial returns.
This guide was produced for informational and strategic planning purposes. Nothing in this document constitutes legal advice. Specific patent prosecution strategies, FTO opinions, and litigation decisions require consultation with qualified patent counsel.