Who actually controls what a drug costs at the pharmacy counter? It is not the manufacturer who sets the list price, and it is not the insurer who writes the check. It is the pharmacy benefit manager sitting between them, extracting margin from both directions while remaining almost entirely invisible to the patient. This pillar page is a complete, analyst-grade breakdown of PBM mechanics, IP implications, vertical integration economics, and the legislative pressure that is reshaping every major contract in the space.
1. What Is a Pharmacy Benefit Manager? The Structural Definition
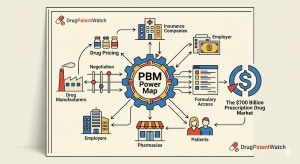
A pharmacy benefit manager is a third-party administrator that manages prescription drug benefits on behalf of health insurers, self-insured employers, Medicare Part D plan sponsors, and Medicaid managed care organizations. The PBM’s core contractual function is to adjudicate pharmacy claims in real time, but that technical description obscures the degree of pricing authority these entities hold.
PBMs negotiate rebate contracts with drug manufacturers. They build and maintain formularies — the tiered lists of covered drugs that determine patient cost-sharing. They contract with pharmacy networks and set the reimbursement rates those pharmacies receive. They manage specialty pharmacy distribution, mail-order programs, and, in many cases, own the pharmacies themselves. The claim processing function is the entry point; the value extraction happens across every subsequent layer.
The U.S. prescription drug supply chain moves roughly $700 billion in annual spending through this architecture. PBMs touch virtually all of it. According to the Drug Channels Institute’s 2025 analysis, the three largest PBMs — Express Scripts (a Cigna company), CVS Caremark, and OptumRx (UnitedHealth Group) — processed approximately 80% of all U.S. prescription claims in 2024. That concentration is not incidental. It is the product of three decades of horizontal and vertical consolidation that has made the PBM function structurally essential and commercially irreplaceable for most payers.
Key Takeaways: Section 1
PBMs control formulary design, rebate flows, pharmacy reimbursement, and specialty drug distribution simultaneously.
The three largest PBMs collectively handle roughly 80% of U.S. prescription claim volume.
PBM influence extends well beyond claims processing into IP-adjacent pricing decisions that determine which drugs generate sustainable commercial revenue.
2. The Drug Manufacturer as Catalog Owner: IP Valuation at the Formulary Gate
In the music industry analogy, a drug manufacturer is the artist who creates the underlying work. That framing is useful but incomplete. A more precise analogy is this: the drug manufacturer is the rights holder to a catalog, and the catalog’s commercial value depends almost entirely on whether the rights holder can secure preferred placement on the platforms that control distribution.
For pharmaceutical IP teams, this means the financial value of a patent estate is not a fixed quantity. It is conditional on formulary access.
How Patent Life Intersects with Formulary Positioning
A branded small molecule drug typically carries a primary composition-of-matter patent with 20 years from filing, reduced by prosecution time and extended (if applicable) by a patent term extension of up to 5 years under the Hatch-Waxman Act. The effective commercial exclusivity window is shorter — often 10 to 14 years from launch. During that window, the manufacturer must negotiate formulary placement to generate the revenue needed to justify the original R&D investment, which the Tufts Center for the Study of Drug Development estimated at approximately $2.6 billion per approved drug (2023 update, including cost of capital).
The formulary placement negotiation happens through rebate contracts. A manufacturer that refuses to pay rebates in a therapeutic class with multiple competitors risks non-preferred or excluded tier status. An excluded drug is, for practical purposes, commercially dead in that plan’s population: patients face either full out-of-pocket costs or, more commonly, simply use whatever the PBM placed on preferred tier.
IP Valuation Methodology for Formulary-Dependent Assets
IP valuation in pharma has historically relied on discounted cash flow models that treat peak sales projections as a fixed input. That approach misunderstands the PBM dynamic. A more accurate model adjusts the projected net price (list price minus rebates, minus PBM administrative fees, minus any patient assistance program costs) by the estimated probability of preferred formulary placement in each major plan type: commercial, Medicare Part D, and Medicaid managed care.
For a drug in a crowded class — proton pump inhibitors, statins, GLP-1 receptor agonists — formulary placement probability is low without substantial rebate offers. For a drug with no therapeutic alternatives, formulary leverage inverts: the PBM cannot exclude it without clinical backlash and member complaints, which gives the manufacturer pricing power.
The GLP-1 class illustrates both ends of this spectrum within a single therapeutic area. Novo Nordisk’s semaglutide franchise (Ozempic, Wegovy, Rybelsus) and Eli Lilly’s tirzepatide franchise (Mounjaro, Zepbound) are both clinically differentiated, heavily patent-protected, and experiencing demand that exceeds supply in several markets. As a result, PBMs have been unable to exclude either brand without political risk. Both companies have maintained elevated list prices precisely because formulary leverage has not forced the rebate concessions typical of a mature, multi-competitor class. Novo Nordisk’s semaglutide patent estate extends composition-of-matter protection through approximately 2031 for oral semaglutide, with additional method-of-use and formulation patents extending further into the 2030s. That estate is the primary driver of Novo’s enterprise valuation in analyst models.
Evergreening and Its Impact on PBM Negotiation Dynamics
Evergreening — the practice of filing secondary patents on formulations, delivery mechanisms, dosing regimens, or metabolites to extend effective exclusivity beyond the primary composition-of-matter expiration — directly affects PBM leverage calculations. A manufacturer who successfully evergreens a drug with a robust secondary patent portfolio can defend preferred formulary positioning even as the primary patent approaches expiration, because generic entry is delayed and the PBM has no lower-cost alternative to threaten.
The most studied example remains AstraZeneca’s transition from omeprazole (Prilosec) to esomeprazole (Nexium). The active S-enantiomer of omeprazole carried new composition patents, new clinical data, and a new branded identity. This strategy extended AstraZeneca’s exclusivity by years and forced PBMs to continue rebate negotiations on the branded product rather than immediately shifting formulary share to generics. Subsequent litigation, including challenges under the Hatch-Waxman Paragraph IV filing framework, ultimately shortened the exclusivity window, but the strategy generated substantial additional revenue during the contested period.
For IP teams, the evergreening roadmap should be built into patent filing strategy from Phase II clinical development, not retrofitted after Phase III results. Filing method-of-use patents tied to specific patient subpopulations, biomarker-defined indications, or combination regimens creates a layered IP estate that complicates any Paragraph IV challenge and preserves PBM negotiating leverage throughout the exclusivity lifecycle.
Key Takeaways: Section 2
The commercial value of pharmaceutical IP is conditional on formulary placement, not intrinsic to the patent grant.
Net price, not list price, is the correct input for IP DCF models; adjusting for rebate probability by plan type produces materially different valuations.
Evergreening strategies that extend secondary patent coverage preserve PBM negotiation leverage and should be integrated into IP filing strategy at Phase II.
Therapeutic classes with no clinical substitutes (GLP-1s, certain rare disease drugs) maintain elevated pricing precisely because formulary exclusion is not a credible PBM threat.
3. PBM Revenue Architecture: Rebates, Spread Pricing, and DIR Fees Explained
PBMs generate revenue through four primary mechanisms: rebate retention, spread pricing, administrative fees, and specialty pharmacy margin. Each operates differently, each is contested by different stakeholders, and each is the subject of separate legislative reform proposals.
Rebate Retention
Drug manufacturers pay rebates to PBMs in exchange for preferred formulary tier placement. The rebate is expressed as a percentage of the drug’s average wholesale price (AWP) or wholesale acquisition cost (WAC) and is paid quarterly. The PBM retains a portion of the rebate as revenue and passes the remainder to its client — the insurer or employer.
The retained portion is the source of the most intense policy dispute. PBMs argue that retained rebates represent fair compensation for formulary management services. Manufacturers and plan sponsors argue that retained rebates create a direct financial incentive for PBMs to prefer higher-priced drugs, since a larger rebate percentage applied to a higher list price generates more absolute dollars than the same percentage applied to a lower-priced alternative.
The Trump administration’s 2019 proposed rule to eliminate the safe harbor for manufacturer-to-PBM rebates under the Anti-Kickback Statute was withdrawn under industry pressure but remains a credible policy threat. A version of rebate pass-through reform appeared in subsequent legislative proposals, and the IRA’s Medicare drug price negotiation provisions have altered the rebate economics for the ten drugs subject to negotiated maximum fair prices in 2026.
Spread Pricing
Spread pricing is the practice of charging a plan sponsor more for a drug than the PBM reimburses the dispensing pharmacy. The difference — the ‘spread’ — is retained by the PBM as revenue. A plan sponsor paying $50 per unit for a generic drug while the PBM reimburses the pharmacy $30 generates $20 per unit in spread revenue for the PBM.
Spread pricing is most prevalent in Medicaid managed care, where state contracts historically lacked the audit rights needed to detect it. A 2018 Ohio Medicaid audit found that PBMs retained $223.7 million in spread pricing on generic drugs over a single year, with some generics marked up by more than 1,000% over pharmacy acquisition cost. Ohio, Kentucky, and several other states have since moved to pass-through pricing models for Medicaid PBM contracts, eliminating most spread revenue in those populations.
Direct and Indirect Remuneration (DIR) Fees
DIR fees are post-point-of-sale adjustments that PBMs charge pharmacies in Medicare Part D plans. Originally designed as a mechanism for pharmacies to share in network performance-based risk, DIR fees evolved into broad retroactive clawbacks assessed months after dispensing, making it impossible for pharmacies to know their actual reimbursement at the time of sale.
CMS finalized a rule in 2023 requiring that DIR fees be reflected in the point-of-sale price beginning January 2024. This structural change eliminates retroactive DIR clawbacks for Part D pharmacies and shifts the economics toward real-time price transparency. For specialty pharmacies and independent retail pharmacies that had been absorbing unpredictable DIR adjustments, this reform meaningfully improves cash flow predictability. For PBMs, it eliminates a revenue stream estimated at $12 billion annually in the Part D market.
Specialty Pharmacy Margin
The three largest PBMs each own specialty pharmacy operations: Express Scripts operates Accredo, CVS Caremark operates Specialty Pharmacy (integrated with CVS retail), and OptumRx owns Optum Specialty. Specialty drugs — biologics, cell and gene therapies, high-cost small molecules for rare diseases — represent roughly 50% of total drug spend despite accounting for fewer than 5% of prescriptions. Directing specialty prescriptions to affiliated specialty pharmacies captures dispensing margin, rebate management fees, and any applicable GPO (Group Purchasing Organization) volume discounts on the manufacturer side. This vertical integration between PBM formulary management and specialty pharmacy dispensing creates a self-referral dynamic that independent pharmacies and manufacturers have both challenged as anticompetitive.
Key Takeaways: Section 3
PBM revenue comes from four distinct streams: rebate retention, spread pricing, DIR fees (being phased out in Part D), and specialty pharmacy dispensing margin.
Rebate retention creates a structural preference for higher-priced formulary drugs; the Anti-Kickback safe harbor reform remains an active policy risk.
Spread pricing has been largely eliminated in state Medicaid programs following audit exposure; commercial plan sponsors are the remaining exposed population.
Specialty pharmacy ownership by PBMs captures 50% of drug spend through a captive dispensing channel; the antitrust implications are live litigation risk.
4. Formulary Design as Market Access Control: How Preferred Tier Placement Works
A formulary is a tiered list of covered drugs. Most commercial plan formularies use four to six tiers, with cost-sharing escalating at each level. Tier 1 is typically low-cost generic drugs with minimal copays. Tier 2 is preferred brand drugs with moderate copays. Tier 3 is non-preferred brands with higher cost-sharing. Tier 4 and above typically includes specialty drugs, where cost-sharing is often expressed as coinsurance (a percentage of the drug’s cost) rather than a flat copay, creating four-figure patient out-of-pocket exposure for high-cost biologics.
The formulary tier a drug occupies determines patient demand more directly than clinical evidence in many therapeutic classes. A drug on Tier 3 with a $75 copay faces approximately 25-40% demand reduction compared to a Tier 2 equivalent at $30, controlling for clinical differentiation. For a drug generating $1 billion in annual revenue, that differential has significant P&L impact.
The Preferred Brand Tier: Rebate Auction Mechanics
In competitive therapeutic classes — statins, ACE inhibitors, beta blockers, and now GLP-1 receptor agonists in the type 2 diabetes indication — PBMs effectively run a formulary placement auction. Manufacturers submit rebate proposals, and the drug offering the highest rebate (or rebate plus additional volume-based guarantees) earns preferred tier status. In some cases, PBMs grant exclusive preferred tier status to a single brand, excluding all competitors from coverage.
This mechanism has been most aggressively deployed in the insulin market. UnitedHealthcare’s OptumRx formulary excluded Lantus (Sanofi’s insulin glargine) from preferred tier in 2017 in favor of Basaglar (Eli Lilly’s authorized generic of glargine), generating significant rebate revenue for the PBM while Sanofi maintained Lantus sales through other channels. The move accelerated industry awareness that even well-established biologics face formulary displacement risk when biosimilar or authorized generic alternatives enter the market.
Utilization Management as a Secondary Formulary Lever
Prior authorization (PA) requirements layer on top of formulary tier status as an additional demand-control mechanism. A drug on Tier 2 with a PA requirement is commercially degraded relative to a Tier 2 drug without PA. Physician offices report that PA administrative burden — fax-based documentation, peer-to-peer review calls, appeal processes — reduces prescribing rates for restricted drugs by 20-30% in some specialty categories, independent of patient cost-sharing.
Step therapy (also called ‘fail-first’ requirements) mandates that patients try and fail a preferred, lower-cost therapy before a non-preferred drug is covered. A PA requirement combined with a step therapy requirement can effectively block a new entrant from gaining commercial traction even when the drug is formulary-listed, because the friction of satisfying both requirements exceeds the physician’s willingness to prescribe it for most patients.
Key Takeaways: Section 4
Formulary tier placement is the primary commercial determinant of branded drug demand in competitive therapeutic classes.
PBMs conduct implicit rebate auctions for preferred tier status; exclusive preferred placement is the most commercially damaging outcome for excluded manufacturers.
Prior authorization and step therapy requirements function as secondary demand suppressants independent of tier status; their cumulative effect on new drug launches can be as significant as a tier demotion.
5. The Big Three PBMs: Market Concentration, Vertical Integration, and Antitrust Exposure
The U.S. PBM market operates under oligopoly conditions that have no parallel in other healthcare subsectors. Express Scripts, CVS Caremark, and OptumRx collectively serve approximately 270 million covered lives. The next tier — Prime Therapeutics, Humana Pharmacy Solutions, MedImpact — each cover fewer than 30 million lives. This concentration is not stable in regulatory terms: the FTC’s 2024 interim report on PBM practices and a parallel House Oversight Committee investigation in 2024 both identified the market structure as a primary policy concern.
Express Scripts (Evernorth / Cigna)
Express Scripts, rebranded as Evernorth Health Services following Cigna’s $67 billion acquisition in 2018, is the largest standalone PBM operation by prescription volume. Its formulary assets include the National Preferred Formulary, which covers approximately 28 million commercial lives. Accredo, its specialty pharmacy subsidiary, handles approximately $50 billion in annual specialty drug spend.
The IP-relevant dimension of Express Scripts’ business model is its position in biosimilar formulary management. Express Scripts has been an aggressive adopter of biosimilar preferred tier placement, excluding reference biologics in categories where biosimilars have achieved FDA interchangeability designation. In 2023, it placed adalimumab biosimilars (Hadlima, Hyrimoz) on preferred tier while moving Humira to non-preferred in several commercial plan segments, capturing rebate revenue from both AbbVie (which negotiated a ‘defense rebate’ to protect Humira’s tier) and from the biosimilar entrants seeking volume.
CVS Caremark
CVS Caremark is structurally the most vertically integrated PBM, with formulary management, retail pharmacy dispensing (approximately 9,900 CVS pharmacy locations), specialty pharmacy (CVS Specialty), and health insurance (Aetna, acquired for $69 billion in 2018) under a single corporate umbrella. This vertical structure means CVS can capture formulary rebate revenue, dispensing margin, and insurance premium revenue simultaneously for the same prescription event.
For drug manufacturers, CVS Caremark represents the most complex negotiating counterparty: formulary placement decisions at Caremark affect both commercial Aetna members and CVS’s third-party PBM clients, creating overlapping and sometimes contradictory incentives within a single contract discussion.
OptumRx (UnitedHealth Group)
OptumRx, a subsidiary of Optum (itself a subsidiary of UnitedHealth Group), manages pharmacy benefits for approximately 65 million members. Its integration with UnitedHealthcare, the largest U.S. health insurer, creates a self-insured formulary dynamic: UnitedHealthcare members are default OptumRx members, and formulary decisions are coordinated with medical benefit design in ways that PBM-only competitors cannot replicate.
UnitedHealth Group’s 2022 acquisition of Change Healthcare (cleared after DOJ litigation) added claims processing and data infrastructure to OptumRx’s capabilities. The combination of insurer scale, PBM formulary authority, specialty pharmacy operations, and claims data creates an information asymmetry relative to drug manufacturers that is without precedent in the supply chain’s history.
Antitrust Exposure and Divestiture Risk
The FTC’s 2024 interim report documented specific instances where vertically integrated PBMs directed specialty prescriptions to affiliated pharmacies at higher prices than independent competitors would have charged, and where the same PBMs set reimbursement rates for independent pharmacies below their acquisition cost for certain generics. The Commission stopped short of recommending forced divestiture in its interim findings but has indicated that the final report will include structural remedies.
For institutional investors holding positions in Cigna, CVS Health, or UnitedHealth Group, the antitrust exposure is the primary regulatory risk in the near term. A forced separation of PBM and pharmacy operations — analogous to the Glass-Steagall separation of commercial and investment banking — would materially alter the earnings models of all three parent companies.
Key Takeaways: Section 5
Three PBMs control approximately 80% of U.S. claim volume; the resulting oligopoly is under active FTC scrutiny as of 2024-2025.
CVS and UnitedHealth’s vertical integration (insurer plus PBM plus pharmacy) creates conflicts of interest that the FTC’s interim report has now documented with transactional specificity.
Forced divestiture of PBM operations from parent insurers or retail pharmacy networks is a live tail risk for Cigna, CVS Health, and UnitedHealth Group equity holders.
PBMs deploy three primary utilization management tools: prior authorization, step therapy, and quantity limits. Each has a legitimate clinical rationale and a commercial application that sometimes diverges from that rationale.
Prior Authorization
Prior authorization requires that a physician obtain PBM approval before a prescription is covered. The approval is based on clinical criteria embedded in coverage policies that are largely PBM-proprietary and not publicly available. For a new drug launch, the PA criteria a PBM applies can determine whether a product reaches its target patient population. If the PA criteria require a prior failure on a lower-cost alternative that the drug’s label does not recommend as first-line, the criteria are in practical tension with the drug’s approved indication.
The AMA’s 2023 survey of physicians found that 94% reported care delays due to prior authorization requirements, and 33% reported that a patient suffered a serious adverse event while waiting for authorization. These are clinical outcomes data that also represent commercial outcomes for manufacturers: every treatment delay is a missed prescription fill.
Step Therapy
Step therapy mandates trial of a specified ‘step-one’ drug before a ‘step-two’ or ‘step-three’ drug is covered. The commercial effect on a premium-priced new drug placed on step two or three is quantifiable: a new entrant in a therapeutic class where it is subject to step therapy behind an established generic will capture roughly 30-50% of its potential prescriptions in the first year, according to market access modeling from IQVIA’s Access & Channel Insight studies.
Manufacturers respond to step therapy restrictions through two strategies. The first is direct rebate negotiation to obtain step-one or step-zero status (no step required). The second is clinical differentiation: if the manufacturer can demonstrate in a head-to-head trial that its drug produces superior outcomes versus the step-one alternative, the PBM’s clinical criteria committee faces professional pressure to modify the restriction. This is the commercial rationale for many of the head-to-head trials that appear in Phase IV commitments — they are as much market access instruments as they are scientific contributions.
Quantity Limits
Quantity limits restrict the amount of a drug dispensed per prescription or per month. For specialty drugs with approved doses that vary by patient weight, disease severity, or combination regimen, quantity limits can prevent physicians from prescribing the clinically indicated dose. For manufacturers, quantity limits interact with rebate structures: if a quantity limit caps utilization at 80% of the prescribed dose, peak sales projections must be adjusted downward accordingly.
Key Takeaways: Section 6
Prior authorization criteria are PBM-proprietary and not publicly accessible; their design can effectively override a drug’s approved label indication in commercial practice.
Step therapy restrictions reduce first-year prescription capture by 30-50% for drugs placed below step-one, making step-one status a primary market access negotiating objective.
Head-to-head Phase IV trials against step-one alternatives are market access instruments as much as scientific endeavors; manufacturers should plan them accordingly.
7. The Independent Pharmacy Problem: PSAO Structure and Reimbursement Erosion
Independent pharmacies — single-location or small-chain operations outside PBM corporate ownership — represent approximately 19% of U.S. retail pharmacy locations but dispense a disproportionately high share of prescriptions in rural and underserved communities. Their commercial viability depends almost entirely on the reimbursement rates set by PBM network contracts, which the three major PBMs set unilaterally.
PSAOs are the independent pharmacy sector’s answer to PBM negotiating power concentration. A PSAO aggregates independent pharmacies into a single contracting entity, presenting the PBM with a collective volume that approximates chain pharmacy scale. The largest PSAOs — AmerisourceBergen’s Good Neighbor Pharmacy, Cardinal Health’s Medicine Shoppe, McKesson’s Health Mart — each represent thousands of independent locations.
Despite PSAO aggregation, independent pharmacies consistently receive lower reimbursement rates than chain pharmacies for identical prescriptions. A 2023 NCPA economic analysis found that independent pharmacies receive, on average, 8-12% less than chain pharmacies per prescription from major PBMs. The differential exists because PBMs negotiate chain rates against the threat of in-house retail pharmacy competition (since CVS and OptumRx both own pharmacies), while independent PSAOs have no comparable countervailing leverage.
Below-Cost Reimbursement and DIR Fee Exposure
PBMs have historically set reimbursement rates for some generic drugs below the pharmacy’s acquisition cost. A pharmacy that pays $4.50 for a generic drug and receives $3.80 in PBM reimbursement is dispensing at a loss. This practice — documented in multiple state Medicaid audits and in the FTC’s 2024 interim report — is most common for high-volume generics where the PBM’s weighted average reimbursement across its network is positive even if individual transactions are not.
For independent pharmacies with thin margins and no scale to absorb per-transaction losses, below-cost reimbursement on even 15-20% of prescriptions can generate negative cash flow at the dispensing level. The DIR fee structure layered additional retroactive uncertainty on top of this base reimbursement problem. The CMS reform eliminating point-of-sale DIR adjustments in Part D beginning January 2024 addresses the retroactive uncertainty but does not address below-cost base reimbursement in commercial contracts.
Key Takeaways: Section 7
PSAOs provide independent pharmacies collective contracting scale but cannot replicate the negotiating leverage of chain pharmacies, resulting in persistent 8-12% reimbursement differentials.
Below-cost generic reimbursement has been documented in both state Medicaid audits and FTC proceedings; it represents a structural subsidy by independent pharmacies to PBM network economics.
The CMS DIR fee reform eliminates retroactive Part D clawbacks but leaves commercial plan reimbursement structures unchanged.
8. Biosimilar Formulary Access: The New Battleground for Reference Biologic IP
The U.S. biosimilar market reached an inflection point in 2023 with the entry of multiple adalimumab biosimilars following AbbVie’s primary patent expiration. Humira — with 2022 global revenue of approximately $21.2 billion — was the highest-revenue drug in pharmaceutical history, and its patent cliff set the commercial template for how PBMs will handle the next generation of biologic LOEs.
Biosimilar Interchangeability and Automatic Substitution
The FDA designates biosimilars as either ‘biosimilar’ or ‘interchangeable.’ An interchangeable biosimilar can be automatically substituted at the pharmacy level without prescriber notification, subject to state pharmacy law. As of early 2025, seventeen biosimilars have received interchangeability designation. Boehringer Ingelheim’s Cyltezo (adalimumab-adbm) was the first interchangeable adalimumab biosimilar, approved in 2021.
Interchangeability designation matters commercially because it enables pharmacy-level substitution economics similar to generic drug dispensing. A PBM that designates an interchangeable biosimilar as the preferred formulary product can direct dispensing volume through automatic substitution, reducing dependence on prescriber behavior change. This lowers the cost of formulary switching substantially and makes biosimilar preferred placement a more credible threat to the reference biologic.
AbbVie’s Humira Defense Strategy: An IP and Formulary Case Study
AbbVie built approximately 130 patents around Humira over its commercial lifetime, covering the composition of matter, manufacturing processes, formulation (citrate-free high-concentration), devices (autoinjector configurations), and methods of use across seventeen approved indications. This patent thicket — challenged and largely settled through licensing agreements with biosimilar entrants — bought AbbVie approximately four years of additional U.S. market exclusivity beyond its first composition-of-matter expiration.
Even after biosimilar entry in early 2023, AbbVie preserved substantial formulary share through a dual strategy. First, it offered ‘defense rebates’ — higher rebates than biosimilar competitors could match — to retain preferred tier status in select plans. Second, it launched a citrate-free high-concentration formulation of Humira that could not be automatically substituted because the citrate-free biosimilars had not yet achieved interchangeability designation for that specific formulation. By 2024, approximately 40% of U.S. Humira volume remained on the branded product, an extraordinary retention rate given the entry of seven competing biosimilars.
For IP strategy teams at other biologic manufacturers, the Humira playbook has three translatable elements: build secondary patents on clinically meaningful formulation attributes, proactively negotiate biosimilar licensing timelines to control entry sequencing, and invest in rebate competitiveness modeling that extends through the post-LOE period, not just up to it.
Reference Biologic IP Valuation Post-LOE
The Humira case revises the standard biologic IP valuation model. Pre-Humira, analyst consensus held that a biologic facing biosimilar entry would experience 40-60% revenue erosion within 24 months. Humira’s retention rate suggests that reference biologics with sophisticated evergreening strategies, interchangeability timing advantages, and aggressive rebate defense can sustain 30-50% of peak revenue even 18-24 months post-LOE. This changes the terminal value assumption in biologic IP DCF models materially.
For drugs like Stelara (ustekinumab, Johnson & Johnson), which faced biosimilar entry beginning in 2023 in the U.S., and Eylea (aflibercept, Regeneron), where biosimilar entry occurred in 2024, the Humira retention data provides a more accurate revenue tail model than historical small molecule LOE curves.
Key Takeaways: Section 8
Biosimilar interchangeability designation enables automatic pharmacy-level substitution; it is the critical regulatory designation for formulary switching economics, not mere biosimilarity.
AbbVie’s Humira retained approximately 40% of U.S. volume 12-18 months post-biosimilar entry through rebate defense and formulation-specific exclusivity — revising the standard biologic LOE revenue erosion assumption downward.
IP teams should integrate post-LOE formulary defense strategy into biologic lifecycle planning at NDA/BLA submission, not at patent expiration.
The Humira patent estate (approximately 130 patents) is the template for secondary patent layering in biologics; the commercial value of that estate derived more from its delay of competitive entry timing than from its ultimate enforceability.
9. PBM Reform and Federal Legislative Trajectory: What Analysts Need to Model
The legislative pipeline targeting PBM practices is the most active it has been since Hatch-Waxman in 1984. Multiple bills have advanced through committee, and the IRA’s drug pricing provisions have already altered the economic calculus for Medicare Part D drugs. The reform trajectory will materially affect PBM revenue models and, through formulary design changes, the commercial prospects of any drug with Medicare or Medicaid exposure.
The Inflation Reduction Act: Medicare Drug Price Negotiation
The IRA’s drug price negotiation program authorizes CMS to negotiate maximum fair prices (MFPs) for a defined set of high-expenditure Medicare drugs. Ten drugs were subject to MFPs beginning in 2026, including Eliquis (apixaban, Bristol-Myers Squibb/Pfizer), Jardiance (empagliflozin, Boehringer Ingelheim/Eli Lilly), Xarelto (rivaroxaban, Johnson & Johnson/Bayer), and Januvia (sitagliptin, Merck). The negotiated prices for these drugs ranged from 38% to 79% below list price.
For PBMs, negotiated MFPs bypass the rebate mechanism for the affected drugs in Medicare Part D. There is no rebate to negotiate — and therefore no rebate to retain — when CMS sets the price directly. This is a structural contraction of the PBM revenue model in the Part D segment for any drug subject to negotiation. As the program expands (15 drugs in 2027, 20 in 2028, 20 per year thereafter), the revenue displacement will compound.
For manufacturers, MFP negotiation triggers its own IP-adjacent concern: the IRA exempts drugs with fewer than nine years of market exclusivity remaining from negotiation eligibility for small molecules, and fewer than thirteen years for biologics. This creates a direct commercial incentive to shorten effective market exclusivity through aggressive IP litigation settlements, because a drug that clears the market before its negotiation eligibility window closes is not subject to MFP pricing.
FTC Enforcement and the 2024 Interim Report
The FTC’s interim report on PBM practices, released in July 2024, documented that the six largest PBMs (the Big Three plus Prime Therapeutics, Humana Pharmacy Solutions, and MedImpact) dispensed 79% of all specialty prescriptions through affiliated pharmacies, resulting in higher costs to plan sponsors than independent pharmacy alternatives in numerous documented instances. The report identified this self-referral dynamic as a probable violation of consumer protection standards and signaled enforcement action.
The FTC has filed administrative complaints against the three largest PBMs, challenging insulin pricing practices specifically. Those proceedings remain active. A settlement or consent decree in the insulin pricing matter would establish precedent for rebate transparency requirements applicable to the broader formulary management function.
Congressional Reform Proposals
Several legislative proposals have advanced through House and Senate committees targeting specific PBM practices. The DRUG Act (Delinking Revenue from Unfair Gouging Act) would prohibit PBMs from retaining any portion of manufacturer rebates, requiring 100% pass-through to plan sponsors and patients. The Pharmacy Benefit Manager Transparency Act would require PBMs to disclose spread pricing and rebate retention to plan sponsors. The Lower Costs, More Transparency Act passed the House in December 2023 with bipartisan support.
None of these proposals have been enacted as of April 2026, but the bipartisan support in the House suggests that some version of rebate pass-through or spread pricing disclosure reform is likely to become law before 2028. Models that assume current PBM revenue structures remain unchanged through 2030 are pricing this risk incorrectly.
Key Takeaways: Section 9
The IRA’s MFP negotiation program structurally bypasses PBM rebate revenue for negotiated drugs in Part D; as the program expands to 20 drugs per year after 2028, the displacement is cumulative.
FTC administrative complaints against the Big Three PBMs on insulin pricing are the most likely near-term enforcement action; a consent decree would establish transparency precedent.
Bipartisan House support for rebate pass-through legislation (DRUG Act) is the most commercially significant reform risk for PBM parent companies; analysts should model a rebate pass-through scenario explicitly.
10. Investment Strategy: Positioning Across the PBM Value Chain
Drug Manufacturers: Formulary Access Modeling is Non-Negotiable
For pharma/biotech IP teams and portfolio managers evaluating pipeline assets, formulary placement probability should be an explicit variable in every commercial forecast. The standard analyst approach of using ‘net price’ assumptions based on class-level historical rebate rates is insufficient for drugs entering competitive therapeutic classes where PBM negotiating behavior is documented and predictable.
A more rigorous approach models formulary placement probability by payer segment (commercial, Medicare Part D, Medicaid managed care), estimates the rebate required to achieve preferred tier status in each segment based on competitor rebate history (available from CMS Medicaid Drug Rebate Program data and Part D plan sponsor disclosed formularies), and adjusts peak net revenue projections accordingly. The difference between a drug that achieves preferred placement in 70% of commercial covered lives versus 40% is often a 200-300 million dollar annual revenue differential at peak.
PBM Parent Companies: Reform Discount Should Be Explicit
Analyst models for Cigna, CVS Health, and UnitedHealth Group should include an explicit regulatory reform scenario that quantifies earnings impact from rebate pass-through legislation, forced PBM-pharmacy divestiture, and IRA negotiation program expansion. Current consensus estimates for these companies appear to discount regulatory reform at relatively low probabilities. Given the bipartisan legislative momentum documented in Section 9, that discount may be structurally too low.
The divestiture scenario for CVS Health is the most complex: separating Aetna, CVS Caremark, CVS Pharmacy, and CVS Specialty into independent entities would require unwinding integration synergies that have been cited as justification for the $69 billion acquisition price. The enterprise value implications of that scenario are material.
Independent Pharmacies and PSAOs: Structural Disadvantage Persists
The CMS DIR reform improves cash flow predictability for independent pharmacies in Part D but does not address the base reimbursement differential. Independent pharmacies as a sector remain under structural margin pressure, and PSAO aggregation has not closed the reimbursement gap with chain competitors. The investment thesis for independent pharmacy consolidation plays (companies acquiring independent pharmacies to build scale) requires a legislative reform assumption on commercial reimbursement parity that is not yet supported by enacted law.
Biosimilar Manufacturers: Interchangeability as the Commercial Moat
For biosimilar manufacturers, interchangeability designation is the primary commercial differentiator. A biosimilar without interchangeability designation must achieve adoption through prescriber behavior change, which is slow and resource-intensive. A biosimilar with interchangeability designation can be included in PBM auto-substitution formulary policies, dramatically reducing the cost of market share capture. R&D and regulatory investment to achieve interchangeability designation should be treated as a core commercial investment, not an optional regulatory step.
Key Takeaways: Section 10
Formulary placement probability modeling by payer segment is a required component of commercial forecasting for drugs in competitive therapeutic classes; the revenue impact of placement tier differential is 200-300 million dollars or more annually at peak for mid-large market drugs.
PBM parent company equity models should include explicit regulatory reform scenarios; current consensus appears to underweight rebate pass-through and divestiture risk probabilities.
Biosimilar interchangeability designation is a commercial asset with a quantifiable ROI; the regulatory investment to obtain it should be treated accordingly in development budgets.
11. Key Takeaways by Segment: The PBM Landscape Summary
For Pharma IP Teams
The formulary is the primary commercial battleground for IP-protected drugs. Net price is a function of rebate negotiation, which is a function of competitive class density, clinical differentiation, and patent estate breadth. Evergreening strategies that extend secondary patent coverage preserve formulary leverage through the primary patent’s expiration. Build biosimilar interchangeability timelines into reference biologic lifecycle management planning. Model post-LOE revenue using Humira’s retention data (approximately 40% at 18 months post-entry) rather than small molecule erosion curves.
For Portfolio Managers and Institutional Investors
The IRA’s MFP negotiation program and the FTC enforcement trajectory represent distinct but compounding risks to branded drug revenue and PBM parent company earnings. The negotiation program is law; its expansion is scheduled and quantifiable. FTC enforcement is less certain but has bipartisan political support and documented transactional evidence. Biosimilar interchangeability policy at FDA and CMS is moving faster than most equity models assume. Adjust discount rates for PBM-exposed revenue streams accordingly.
For R&D Leads
Phase IV head-to-head trial design against formulary step-one alternatives is a market access strategy, not purely a scientific endeavor. Step therapy placement is quantifiably addressable through clinical superiority data submitted to PBM clinical criteria committees. Prior authorization criteria are PBM-proprietary but can be engaged through medical affairs and HEOR (health economics and outcomes research) submissions. Build market access strategy alongside Phase III protocol design, not after Phase III completion.
For Payers and Plan Sponsors
Pass-through PBM contracting models, which require 100% rebate pass-through from manufacturer to plan sponsor, are available from multiple vendors (Capital Rx, Navitus Health Solutions, RxBenefits) and are structurally advantageous versus traditional retained-rebate contracts if the plan sponsor has the administrative capability to manage formulary design directly. The DIR fee reform in Part D is enacted; ensure your Part D PBM contract reflects point-of-sale pricing, not retroactive adjustment. Audit spread pricing in commercial contracts using National Average Drug Acquisition Cost (NADAC) benchmarks published weekly by CMS.
This analysis was prepared for pharma/biotech IP teams, portfolio managers, R&D leads, and institutional investors. It does not constitute legal or investment advice. Patent expiration dates and revenue figures are sourced from public filings, CMS data releases, and published analyst research. Drug patent expiration data via DrugPatentWatch.


")


")


