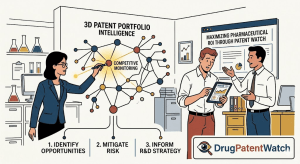
A comprehensive technical guide for pharma IP teams, R&D leads, and institutional investors on translating patent surveillance into commercial advantage.
Executive Summary
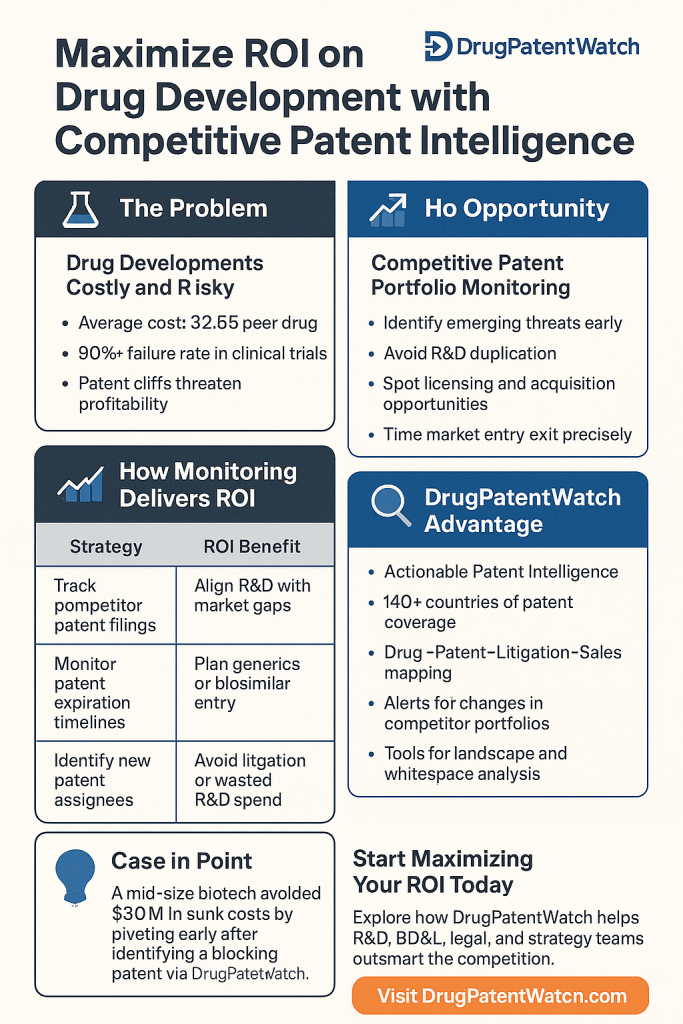
Pharmaceutical R&D has never been structurally more expensive or strategically more legible. Average per-asset development costs cleared $2.23 billion in 2024, yet the industry’s internal rate of return simultaneously climbed to 5.9%, recovering sharply from the 1.2% nadir recorded in 2022. That spread between cost inflation and return recovery is not random. It reflects a measurable shift in how the highest-performing companies allocate information resources, specifically how they read, interpret, and act on competitive patent data before that data becomes obvious to rivals.
This guide treats competitive patent monitoring as what it actually is: a balance-sheet asset. A Paragraph IV filing against a weak formulation patent can erase $2-5 billion in net present value from a branded company’s market cap within a trading session. An early-detected white space in a GLP-1 receptor agonist formulation patent landscape can justify a $400 million Phase II commitment. These are not hypotheticals. They are the practical outputs of systematic patent surveillance programs operated by the companies that have consistently outperformed Deloitte’s top-20 cohort on R&D ROI over the past three years.
What follows is a technically dense, operationally specific roadmap covering R&D ROI mechanics, the IP valuation of individual drug assets, the full spectrum of patent monitoring methodologies, evergreening strategy with concrete case mechanics, biosimilar interchangeability as a threat vector for biologics, freedom-to-operate (FTO) protocol design, AI-assisted patent analytics, and a practitioner-grade investment strategy framework. Each section closes with key takeaways calibrated for IP teams, R&D leads, and buy-side analysts.
Key TakeawaysPharma R&D IRR recovered from 1.2% (2022) to 5.9% (2024), driven partly by better IP intelligence, not just pipeline luck.Patent monitoring is a quantifiable asset: its value is measurable in avoided litigation costs, accelerated FTO clearance, and white-space capture.The structural gap between per-asset cost ($2.23B) and peak-sales forecast ($510M average) means that small improvements in portfolio targeting, informed by patent data, have disproportionate ROI impact.GLP-1 therapies and oncology precision medicines are currently the highest-value domains for competitive patent surveillance.
Section 1: The Real Economics of Pharmaceutical R&D ROI
1.1 IRR Recovery: What the Numbers Actually Show
Deloitte’s 15th annual pharmaceutical innovation report, published in early 2025, documented industry-level IRR at 5.9% for 2024. That figure sounds modest relative to other capital-intensive industries, but the trajectory matters more than the absolute level. From 4.1% in 2023 and 1.2% in 2022, the recovery spans nearly 480 basis points in two years. Thirteen of the twenty largest pharmaceutical companies saw IRR growth during this period, with three recording increases exceeding five percentage points.
The improvement did not come from cost reduction. Average per-asset development costs rose across 12 of the top 20 companies, and Phase III clinical trial cycle times lengthened by 12% in the most recent cohort. What changed was the numerator: the average forecast peak sale per new asset climbed to $510 million, reflecting a mix shift toward high-unmet-need therapies with stronger pricing power. GLP-1 receptor agonists for obesity and type 2 diabetes contributed materially, as did precision oncology assets with companion diagnostic strategies that effectively narrow the competitive addressable population.
Merck & Co. illustrates the cost-pressure side of the equation. Its R&D expenditure rose 21.3% in 2023, driven by integration of acquired programs and headcount expansion. That kind of spending requires a correspondingly strong IP position to protect the commercial window. Keytruda (pembrolizumab), which generated over $25 billion in 2023 revenue, sits within a patent cluster that extends core molecule protection to 2028 and formulation or method-of-use patents into the mid-2030s. The lesson is that cost inflation is manageable when the IP estate is actively constructed to extend commercial runway.
Metric
Value / Benchmark (2024)
Industry IRR (2022)
1.2%
Industry IRR (2023)
4.1%
Industry IRR (2024)
5.9%
Average per-asset development cost (2024)
$2.23 billion
Average forecast peak sale per new asset
$510 million
Phase III cycle time change (latest cohort)
+12%
Top-20 companies with IRR growth
13 of 20
1.2 The Cost Structure Behind the ROI Gap
Breaking down the $2.23 billion per-asset figure reveals where patent intelligence creates the most leverage. Discovery and pre-clinical work accounts for roughly $430-500 million of fully-loaded costs when capital and failure rates are included. Phase I through Phase III clinical trials consume the remaining $1.7+ billion. Late-stage attrition remains the single largest value destroyer: a Phase III failure on a program with $500 million already invested and a $3 billion commercial forecast represents an effective economic loss far exceeding the sunk cost, because it forecloses future cash flows and consumes organizational bandwidth.
Patent intelligence reduces late-stage attrition through two mechanisms. First, it surfaces FTO risks early enough for chemistry or formulation redesign before significant clinical capital is deployed. Second, it identifies whether a competitor has already patented the clinical endpoint strategy, the companion biomarker, or a specific patient subpopulation enrichment method that would be needed to run an efficient Phase III. Both risks are knowable from the patent record, if someone is systematically reading it.
1.3 The Patent Cliff as a Financial Event
Loss of exclusivity (LOE) is not an accounting abstraction. When AstraZeneca’s Crestor (rosuvastatin) lost its primary compound patent in 2016, branded revenues fell by approximately 80% within 18 months of generic entry. When Humira (adalimumab) faced biosimilar entry in the United States in 2023, after years of patent litigation that had already delayed that entry in Europe, AbbVie had constructed a formulation and manufacturing patent portfolio often described as the ‘Humira patent thicket,’ comprising more than 160 U.S. patents. The resulting biosimilar interchangeability landscape for adalimumab was litigated and negotiated for years. The IP strategy was explicit: extend the commercial window long enough to establish Skyrizi (risankizumab) and Rinvoq (upadacitinib) as successor revenue drivers.
For investors, the patent cliff is a predictable, dateable event that quantifies LOE risk in specific fiscal quarters. For R&D teams, it creates the strategic imperative to either defend the cliff through evergreening or have a successor asset positioned for commercial ramp before the cliff arrives. Both paths require systematic patent monitoring: one to defend, one to know when the competitor’s cliff arrives and creates a market opportunity.
Key TakeawaysIRR recovery is real but fragile; Phase III cycle time inflation is a structural headwind that patent intelligence can partially offset by de-risking late-stage program selection.The Merck/Keytruda IP architecture is the template for managed cost inflation: high per-asset spending is justified when the patent estate extends commercial exclusivity beyond the base compound expiry.Loss of exclusivity events are financially discontinuous; AbbVie’s adalimumab patent thicket is the benchmark for proactive evergreening as a revenue-bridge strategy.Patent cliff timing is computable from the Orange Book and Patent Term Extension records; buy-side analysts who model LOE dates from this data price biosimilar risk earlier and more accurately.
Section 2: Drug Patent IP Valuation as a Core Asset Class
2.1 How Patent Estates Are Valued on the Balance Sheet
A pharmaceutical patent is not a single instrument. It is a layered position composed of a primary compound patent, formulation patents, process or manufacturing patents, method-of-use patents, and, for biologics, patents covering specific cell lines, purification sequences, or glycosylation profiles. Each layer has a distinct expiry date, a distinct vulnerability to inter partes review (IPR) or post-grant review (PGR), and a distinct bearing on LOE timing. Valuing the patent estate of a drug asset requires mapping all of these layers and assigning probability-weighted expiry scenarios.
In practice, institutional investors and licensing teams use a risk-adjusted NPV model that discounts projected cash flows by the probability that each patent layer survives challenge. A compound patent with a strong prosecution history and no prior art vulnerabilities might receive a 90% survival probability. A secondary formulation patent that was granted on a continuation application without significant differentiation from prior art might receive 40-60%. The aggregate survival probability for the full estate determines how aggressively the LOE cliff is discounted in the NPV model.
Royalty rates in out-licensing transactions provide another valuation anchor. Biotech-to-pharma royalties for breakthrough therapy-designated compounds have ranged from 10-15% of net sales for compounds with robust primary compound patent protection. Royalties for formulation or delivery-system patents licensed independently typically fall in the 1-5% range, reflecting their narrower scope. These reference rates inform internal IP valuation when companies assess whether to in-license versus build.
2.2 Evergreening: The Technology Roadmap
Evergreening refers to the practice of obtaining additional patents that extend effective market exclusivity beyond the primary compound patent expiry. Regulatory and legal discourse often characterizes evergreening pejoratively, but from an IP strategy perspective it is standard life-cycle management. The mechanics are specific and learnable from the patent record.
The most defensible evergreening layer is a patented new formulation that delivers a clinically meaningful improvement: extended-release (XR) profiles that reduce dosing frequency, abuse-deterrent formulations (ADFs) for opioid analgesics that qualify for FDA’s ADF guidance, or fixed-dose combinations (FDCs) that simplify treatment regimens and qualify for a new new-drug application (NDA). Pfizer’s Lyrica (pregabalin) extended-release formulation pursued this path, as did the shift from Concerta (methylphenidate extended-release) to differentiated ADHD delivery systems. These formulation patents are typically harder to design around than pure compound patents because they require regulatory approval of the new formulation, creating a secondary barrier to generic entry.
Polymorph patents cover specific crystalline forms of a drug compound that may have superior stability, bioavailability, or processability. These are frequently challenged via Paragraph IV filing because the chemical identity of the active moiety is often indistinguishable, and courts have applied the written description and enablement standards stringently. The Singulair (montelukast) polymorph patent litigation by Merck is a textbook case: multiple generics filed Paragraph IV certifications against the polymorph patent, litigation settled, and branded revenue declined sharply following generic entry.
Method-of-use patents protect the FDA-approved indication rather than the molecule itself. These are the legal basis for the ‘skinny label’ carve-out strategy available to generic applicants under 21 U.S.C. 505(j)(2)(A)(viii). A generic manufacturer can omit the patented indication from its label and market the drug for non-patented uses, provided the carve-out does not render the generic unacceptable for its approved uses. Recent litigation, particularly GlaxoSmithKline v. Teva in the carvedilol case, has complicated this strategy by expanding potential induced infringement liability even when a skinny label is employed, making method-of-use patents significantly more valuable as a competitive barrier.
Pediatric exclusivity, while not itself a patent, extends market exclusivity by six months when a company conducts FDA-requested pediatric studies under the Pediatric Research Equity Act (PREA) or Best Pharmaceuticals for Children Act (BPCA). This six months is among the highest-ROI activities available in drug lifecycle management; for a drug generating $3 billion annually, six months of exclusivity is worth $1.5 billion pre-tax.
The most durable evergreening architectures layer compound, formulation, and method-of-use patents across overlapping time windows, creating a staggered LOE profile that forces generic challengers to file serial Paragraph IV certifications against multiple patents with different litigation risk profiles.
2.3 The Orange Book, the Purple Book, and What They Actually Contain
The FDA Orange Book, formally titled ‘Approved Drug Products with Therapeutic Equivalence Evaluations,’ lists the patents that a branded drug NDA holder has certified are applicable to the approved drug product. Inclusion in the Orange Book is not automatic; the NDA holder submits patent information and certifies relevance. This creates strategic behavior on both sides: branded companies sometimes over-list patents to maximize litigation leverage under the 30-month stay provision triggered by a Paragraph IV filing, while generics and IPR petitioners use Orange Book patent lists to identify which patents to challenge first.
The FDA Purple Book, ‘Lists of Licensed Biological Products with Reference Product Exclusivity and Biosimilarity or Interchangeability Evaluations,’ is the biologics equivalent. It is structurally different because biologics do not receive Orange Book listing for individual patents; instead, the Biologics Price Competition and Innovation Act (BPCIA) established a separate patent dance procedure under which the reference product sponsor and the biosimilar applicant exchange patent lists and negotiate which patents to litigate. This procedure is more complex and more expensive than the Hatch-Waxman Paragraph IV process, which is why biosimilar patent litigation has historically involved larger legal teams and longer timelines than small-molecule generic challenges.
For investors and IP teams monitoring a biologic asset, the Purple Book entry date and the 12-year exclusivity period for biological products are the starting points for LOE modeling. The first biosimilar application date, identifiable from FDA biosimilar development program disclosures and the patent dance correspondence (which can be partially reconstructed from litigation filings), determines the earliest plausible biosimilar entry date.
2.4 Patent Term Extension and Supplementary Protection Certificates
Patent term extension (PTE) under 35 U.S.C. 156 compensates pharmaceutical patent holders for the regulatory review period that reduces effective commercial exclusivity. The maximum PTE is five years, and the extended period cannot exceed 14 years of remaining exclusivity from the date of approval. A drug approved seven years after the compound patent was filed would be eligible for the full five-year extension; a drug approved 12 years after filing would be eligible for only a two-year extension. These calculations matter for LOE modeling and are often mispriced by analysts who use raw patent expiry dates without adjusting for PTE.
In Europe, Supplementary Protection Certificates (SPCs) function analogously to PTE and can extend protection for up to five years beyond the basic patent. The EU SPC system is administered nationally, meaning that a company must file SPC applications in each EU member state, and the protection period can vary based on the filing and approval dates in each country. Recent litigation over SPCs, particularly around the Actavis v. Sanofi case interpreting the scope of SPC protection for combination products, has created uncertainty in how broadly SPCs protect formulation variants. For a company with significant European revenues, SPC strategy is material to LOE forecasting.
Key TakeawaysPatent estate valuation requires layer-by-layer analysis: compound, formulation, polymorph, method-of-use, and manufacturing patents each carry distinct survival probabilities and different exposures to Paragraph IV challenge or IPR.Evergreening creates a staggered LOE profile; the most effective architectures force generics to file multiple Paragraph IV certifications sequentially, extending effective exclusivity without violating any statute.Orange Book and Purple Book data, read against litigation dockets, allow construction of probability-weighted LOE models more accurate than raw patent expiry dates.PTE calculations and European SPC filings shift actual LOE dates materially from nominal compound patent expiry; ignoring them systematically misprices LOE risk.
Investment Strategy: IP Valuation for Buy-Side AnalystsStep 1: Pull the full Orange Book listing for each major branded asset in the portfolio. Map each patent to its layer type (compound, formulation, polymorph, method-of-use) and raw expiry.Step 2: Apply PTE and any six-month pediatric extension to the compound patent. Cross-check SPC filings in Germany, France, and the UK for EU-revenue-exposed positions.Step 3: Query the Dockets database (PACER) and IPR petition records (USPTO PTAB) for pending challenges. Each active Paragraph IV litigation case introduces LOE risk from the trial date forward.Step 4: Assign survival probabilities by layer using historical PTAB and district court invalidation rates. Compound patents survive PTAB at approximately 35-40% after institution; formulation patents fare better at 50-60%, reflecting narrower but more clearly enabled claims.Step 5: Build a scenario-weighted NPV model with base (all patents survive), bear (compound patent invalidated, LOE accelerated 3-5 years), and stress (all secondary patents fall, concurrent biosimilar or generic entry) cases. The spread between base and stress NPV is the patent-risk premium embedded in the position.
Section 3: Competitive Patent Monitoring, From Program Design to Intelligence Delivery
3.1 What a Monitoring Program Actually Covers
Patent monitoring is the systematic, continuous tracking of published patent applications and granted patents within a defined technological and competitive perimeter. The emphasis on ‘continuous’ separates it from point-in-time landscape analyses. A landscape analysis, conducted before a program advances to IND filing, gives a company a snapshot of the existing IP terrain. A monitoring program tells the company what changes in that terrain as it runs its clinical trials, because competitors are filing new patents throughout the three-to-seven-year clinical development period.
The scope of a monitoring program is defined along four axes: technology (specific targets, MOAs, delivery platforms), competitor (named companies including emerging biotech, academic spinouts, and Chinese originators), geography (U.S., European Patent Office, Japan, China, and any market where commercial rights are strategically important), and legal status (new filings, grants, abandonments, inter partes review petitions, and reexamination requests). Failure to define all four axes produces a program that generates noise without signal.
Monitoring cadence should match the rate of innovation in the relevant space. An oncology target with 40+ active clinical programs may require weekly alert processing. An orphan disease area with five known competitors might be adequately served by monthly reviews. Quarterly reviews are generally insufficient for any area where a competitor could file a patent that materially affects FTO within a single quarter without the monitoring team noticing in time to respond.
3.2 Patent Alert Architecture: Designing Queries That Find Signal
The query design problem in pharmaceutical patent monitoring is a precision-recall tradeoff. A broad keyword search on ‘PCSK9 inhibitor’ will capture every patent that mentions proprotein convertase subtilisin/kexin type 9 but will also generate thousands of irrelevant results from tangentially related filings. A narrow CPC classification search, for example C07K16/2896 covering anti-PCSK9 antibodies, will be highly precise but may miss filings that describe the same biology under a different structural classification.
Best-practice query design for pharmaceutical patent monitoring uses a layered approach. The core layer uses cooperative patent classification (CPC) codes specific to the therapeutic target and mechanism. An intermediate layer adds controlled vocabulary from MeSH (Medical Subject Headings) and chemical identifier search via CAS Registry numbers or InChI strings. The outer layer uses semantic search or NLP-based concept matching to catch filings that describe the relevant biology without using the expected keyword set. This outer layer is where machine learning adds the most value, because manual keyword lists cannot anticipate every way a competitor might describe a novel compound or formulation.
Alert distribution requires as much design attention as query construction. Patent alerts that arrive as undifferentiated email dumps are functionally useless. Effective alert systems route findings to specific stakeholders by relevance tier: patent counsel receives all filings from named competitors and all filings that share CPC codes with active company assets; R&D leads receive a curated digest of filings that describe novel mechanisms, targets, or endpoints relevant to active programs; business development receives filings from academic institutions and early-stage biotechs in areas of strategic interest; and an executive summary pulls the highest-impact findings from each monitoring cycle for review by R&D leadership.
3.3 The 18-Month Filing Lag: Using Unpublished Application Intelligence
Patent applications publish 18 months after their priority filing date under the Patent Cooperation Treaty (PCT) and U.S. law. This means that when a company files a patent on January 1, 2025, the public will not see that application until July 2026. For a competitor monitoring that space, there is an 18-month blind spot during which the filing is strategically invisible. In a fast-moving field like GLP-1 formulations or CRISPR delivery systems, 18 months is enough time for a competitor to construct a dominant patent position before anyone outside the company knows it exists.
Three data sources partially address the 18-month gap. First, PCT national phase entry records become visible before the application publishes because the applicant must file a national phase entry request in each country where protection is sought, and these filings are sometimes visible in national patent office databases. Second, priority claims in published applications reveal the filing date and priority number of earlier-filed applications, allowing reconstruction of the competitor’s filing timeline even when the underlying application is still unpublished. Third, continuation and continuation-in-part applications cite parent applications in their prosecution history, revealing the existence of a filing chain even when individual members of the chain are not yet published.
Sophisticated monitoring programs use these indirect signals to estimate what competitors may have in their unpublished pipeline. If a competitor publishes a paper on a novel delivery mechanism in a peer-reviewed journal, and then three months later files a PCT application covering related compounds, the monitoring team can reasonably infer that additional applications in the same family are pending. Acting on that inference, by filing a design-around application or accelerating a competing program, requires judgment, but the signal itself is real and actionable.
3.4 Paragraph IV Strategy: How Generic and Brand Companies Both Use Patent Monitoring
A Paragraph IV filing is a certification by an Abbreviated New Drug Application (ANDA) or 505(b)(2) applicant that a listed Orange Book patent is either invalid or will not be infringed by the generic product. Filing a Paragraph IV certification triggers the branded company’s right to sue for infringement within 45 days; if it does, a 30-month stay automatically delays FDA approval of the generic product unless the litigation resolves earlier. The first ANDA applicant to file a Paragraph IV certification on a particular patent is eligible for a 180-day generic market exclusivity period, which can be worth hundreds of millions of dollars depending on the branded product’s revenue.
From the generic company’s perspective, patent monitoring determines which patents are worth challenging. A Paragraph IV filing is not free; it triggers litigation, which costs $5-15 million per patent through trial. Generic companies prioritize challenges against patents with the highest estimated probability of invalidation or non-infringement, weighed against the revenue opportunity if the challenge succeeds. Secondary formulation patents with limited prosecution history, narrow dependent claims, or prior art that the examiner did not consider are prime targets. Compound patents with strong prosecution history and multiple independent claims are harder to invalidate and more expensive to litigate.
From the branded company’s perspective, patent monitoring identifies which of its own patents are most vulnerable to Paragraph IV challenge and which competitor patents might be invalidatable before they become a barrier to market entry. Orange Book listing decisions, patent prosecution strategy, and inter partes review offensives against competitor patents are all influenced by the intelligence generated by systematic monitoring. Bristol-Myers Squibb’s use of IPR petitions against patents covering competitor PD-1/PD-L1 antibody formulations illustrates how monitoring-informed IPR strategy operates as a competitive weapon, not just a defensive tool.
Key TakeawaysMonitoring program design requires explicit definition of technology, competitor, geography, and legal-status axes; undefined scope generates noise that discredits the program internally.Query design should layer CPC classification, chemical identifier search, and semantic NLP to close the gap between keyword precision and concept-level recall.The 18-month PCT publication lag creates a structural intelligence gap; indirect signals from national phase entries, continuation filings, and journal publication timelines partially close it.Paragraph IV strategy is a two-way monitoring application: generic companies use it to prioritize challenges; branded companies use it to identify which patents to strengthen or abandon before a Paragraph IV filing arrives.
Section 4: Biologic Patent Strategy and Biosimilar Interchangeability as a Competitive Threat
4.1 How Biologic Patent Estates Differ From Small-Molecule Portfolios
Small-molecule drugs are synthesized through defined chemical reactions; their structure is exactly replicable, and a generic compound is chemically identical to the reference product. Biologics are manufactured in living cells; batch-to-batch variability is inherent, and no two manufacturers’ products are truly identical at the molecular level. This distinction drives the entire structure of biologic patent strategy. The primary patent for a biologic typically covers the amino acid sequence of the protein, the nucleic acid sequence encoding it, or the antibody variable domain structure. But unlike small-molecule compound patents, which are relatively straightforward to search and interpret, biologic sequence patents interact with manufacturing and purification patents in complex ways that require specialized analytical tools.
The biologic patent estate worth monitoring for any major biologic product includes the primary sequence patent, which usually grants early and expires 20 years from priority; a set of manufacturing patents covering cell culture conditions, purification chromatography protocols, and formulation buffers; device patents covering the pre-filled syringe, autoinjector, or co-packaged delivery device; and method-of-use patents covering specific dosing regimens or patient subpopulations. AbbVie’s adalimumab estate, spread across more than 160 U.S. patents, is the most extensively documented example of this architecture. Its expiry profile staggered from early 2023 for the core compound to 2034 and beyond for formulation and device patents.
4.2 Biosimilar Interchangeability: The Legal and Commercial Distinction That Matters
Biosimilar interchangeability is a specific FDA designation that goes beyond biosimilarity. A biosimilar product demonstrates that it has no clinically meaningful differences from the reference product in terms of safety, purity, and potency. An interchangeable biosimilar demonstrates additionally that it can be expected to produce the same clinical result as the reference product in any given patient, and that the risk of alternating or switching between the interchangeable and the reference product is not greater than the risk of maintaining the reference product. The interchangeability designation allows pharmacists in most U.S. states to substitute the biosimilar without physician intervention, subject to state pharmacy practice acts.
For competitive patent monitoring, interchangeability designation is a specific threat milestone. A biosimilar that achieves only biosimilarity designation requires prescriber or patient decision to switch; uptake is typically slower and market share capture is partial. An interchangeable biosimilar triggers automatic substitution at the pharmacy level, accelerating volume erosion from the reference product. Insulin glargine biosimilars illustrate the commercial impact: Civica Rx’s launch of unbranded glargine and Sanofi’s response with Toujeo pricing adjustments were both shaped by the interchangeability race among biosimilar applicants.
Monitoring the biosimilar pipeline for a biologic asset means tracking not just ANDA/BLA filing dates but also the clinical switching study designs that biosimilar applicants are running. Switching studies that complete successfully and are submitted to FDA signal that an interchangeability designation is probable within 12-18 months of BLA filing. Patent monitoring of the biosimilar applicant’s own filings can reveal what formulation or device IP they are developing to protect their own product, which in turn informs whether they intend to pursue a premium positioning or a pure cost-competition strategy.
4.3 The BPCIA Patent Dance: Intelligence Extraction
The BPCIA patent dance is a structured information exchange between the reference product sponsor (RPS) and the biosimilar applicant in which both parties share proprietary information about the biologic product and its proposed biosimilar under confidentiality protections. The RPS receives the biosimilar applicant’s aBLA within 20 days of FDA acceptance; the RPS then has 60 days to identify all patents it believes could be infringed by the biosimilar. The parties then negotiate which patents to litigate in an immediate phase and which to defer.
The patent dance is partially visible to outside parties through subsequent litigation filings, which cite the patents in dispute and the arguments exchanged. Monitoring patent dance-derived litigation provides intelligence about which patents the RPS considers most defensible, which patents the biosimilar applicant considers most vulnerable, and what technical arguments each party is prepared to make. This intelligence is directly applicable to any company holding similar patents or developing competitive biosimilar programs in the same biologic class.
The Supreme Court’s decision in Sandoz Inc. v. Amgen Inc. (2017) confirmed that biosimilar applicants may, but need not, provide the aBLA and manufacturing information required under the dance. A biosimilar applicant that skips the dance forfeits certain protections but gains speed. Monitoring which applicants skip the dance and which engage it fully provides a leading indicator of their litigation tolerance and commercial timeline.
4.4 Biologic Evergreening: Formulation and Device Patent Roadmap
The formulation patent strategy for biologics focuses on buffer composition, excipient selection, protein concentration, and storage conditions. A biologic formulated at 50 mg/mL with a citrate buffer is not the same product as one formulated at 100 mg/mL with a histidine buffer, even if the protein sequence is identical. Higher-concentration formulations that enable subcutaneous administration, replacing intravenous infusions, create clinical and commercial differentiation sufficient to support new patents and new commercial positioning. Roche’s switch of rituximab from IV infusion to subcutaneous administration via the Halozyme ENHANZE technology (hyaluronidase co-formulation) extended commercial runway for the product and generated a new device-and-formulation patent cluster.
Device patents for biologics have shown increasing importance as autoinjectors and wearable injectors proliferate. The Autoject, SmartDose, and Inject-ease autoinjector platforms each carry independent patent estates that reference product sponsors license and then sometimes extend through their own continuation filings. Monitoring these device patent estates reveals when a reference product sponsor is preparing a subcutaneous or self-injection version of a product currently administered only in clinical settings, which is material information for both biosimilar developers and competing originators.
Key TakeawaysBiologic patent estates must be analyzed in four distinct layers: sequence/structure, manufacturing/purification, formulation/device, and method-of-use; the compound patent alone does not define the commercial window.Biosimilar interchangeability designation triggers pharmacy-level automatic substitution, accelerating volume erosion significantly faster than a non-interchangeable biosimilar; monitoring clinical switching study timelines provides a 12-18 month lead indicator.BPCIA patent dance litigation filings are a secondary intelligence source that reveals which patents the reference product sponsor considers most defensible and what technical arguments will be used.Formulation switches to higher concentration or subcutaneous administration, supported by new patents and device co-development, are the standard biologic evergreening pathway; Roche’s rituximab SC program is the benchmark case.
Investment Strategy: Biologic LOE Risk ModelingFor any biologic position generating more than $1 billion annually, the following monitoring workflow quantifies LOE risk with six-month lead time over consensus estimates.Track Purple Book biosimilar applicant entries and their FDA review division assignments. aBLA filing to approval averages 12 months for a 351(k) application; active filing dates establish the earliest approval scenario.Monitor clinical trial registrations (ClinicalTrials.gov) for switching studies by known biosimilar developers. A Phase III switching study that completes enrollment signals an interchangeability filing within 6-9 months of trial completion.Map the biologic’s formulation and device patent cluster in Espacenet and USPTO Patent Full-Text databases. Identify the latest-expiring patent in the cluster that has been Orange Book- or Purple Book-listed. That date, not the compound patent expiry, is the operative LOE date for the base case model.
Section 5: Freedom-to-Operate Analysis, Protocol Design and Execution
5.1 What FTO Analysis Actually Asks
Freedom-to-operate analysis determines whether a specific commercial act, manufacturing a product, selling it in a specific country, or using a process, would infringe a valid, enforceable patent claim held by a third party. The analysis has three distinct components: claim scope interpretation, which determines what a claim actually covers; infringement analysis, which compares the claim to the contemplated act; and validity analysis, which assesses whether the claim would survive challenge. All three are necessary; a claim that seems to cover a contemplated act may be invalidatable on prior art grounds, which affects but does not eliminate infringement risk.
FTO analysis for a drug development program proceeds in stages. At lead selection, a target-level FTO analysis identifies the major patent holders in the space and their claim scope. At IND filing, a compound-level FTO analysis covers the specific compound or biologic, its synthesis route, and its primary formulation. At Phase III initiation, a product-level FTO analysis covers the clinical formulation, the proposed label, the companion diagnostic (if any), and the proposed manufacturing process. Post-approval, a pre-launch FTO analysis covers the commercial formulation, the approved indications, and the specific markets in which launch is planned.
Each stage-gate FTO analysis should trigger a monitoring program update that tracks newly published claims relevant to the elements analyzed. An FTO cleared at IND filing becomes unreliable if a competitor obtains a continuation patent with narrowed but precisely targeted claims during the clinical development period. The only way to know when this happens is continuous monitoring.
5.2 FTO in Multi-Market Launch Planning
Geographic FTO planning is material for products with significant ex-U.S. revenues. Patent protection is territorial: a U.S. patent does not restrict commercial activity in Germany, and a European patent granted by the EPO covers only the contracting states designated in the grant. A company planning global launch must map the patent position in each major market independently. A competitor may hold strong composition claims in the U.S. and Japan but have weaker protection in Europe due to EPO examination standards, or may have allowed a national patent to lapse for non-payment of annuity fees.
China has become a material jurisdiction for FTO analysis in the past decade. The National Intellectual Property Administration (CNIPA) has expanded patent grant rates significantly, and Chinese domestic pharmaceutical companies are now filing substantial numbers of PCT applications. A company planning China launch for an innovative therapy must conduct FTO analysis against Chinese-origin patents that may not appear in searches limited to USPTO and EPO databases. Monitoring Chinese patent applications in parallel with Western filings is now standard practice for any program with China commercial ambitions.
India and Brazil present different FTO profiles. India does not grant patents on new forms of known substances unless they demonstrate significantly enhanced efficacy, per Section 3(d) of the Indian Patents Act, which means that many formulation and polymorph patents granted in the U.S. do not have Indian equivalents. Brazil’s ANVISA pre-grant review system for pharmaceutical patents adds a regulatory layer to the FTO picture. These jurisdictional differences create both risks and opportunities that systematic geographic monitoring can identify.
5.3 Designing Around Competitor Patents
Design-around analysis is the R&D response to a blocking FTO position. When monitoring identifies a competitor patent that covers an element of the contemplated product or process, the R&D team has options: modify the compound structure to fall outside the claim scope, use a different formulation or synthesis route, challenge the patent via IPR or opposition, negotiate a license, or abandon the approach. Each option has a different cost, timeline, and probability of success.
Chemistry-based design-arounds in small molecules typically involve structural modifications to the compound scaffold that fall outside the literal scope of the competitor’s claim while preserving biological activity. This analysis requires both patent claim interpretation by counsel and medicinal chemistry assessment of whether the modification preserves the desired pharmacology. Design-arounds that preserve pharmacology are valuable; those that result in a compound with inferior potency or selectivity may not be commercially viable even if they are patent-free.
Formulation design-arounds involve changing excipients, buffers, concentrations, or delivery routes to move outside the scope of a formulation patent. For biologics, reformulation is constrained by the protein’s stability requirements; many formulation patents exist precisely because they solved a real stability problem, which means the patent-free alternatives are often technically inferior. Monitoring formulation patent claims in detail allows R&D teams to identify which aspects of the competitor’s formulation are patent-protected versus merely conventional, directing design-around efforts toward the truly constrained elements.
Key TakeawaysFTO analysis is a stage-gated process; a clearance obtained at IND filing must be updated at Phase III initiation and again pre-launch, because competitors file continuation patents throughout the development window.Geographic FTO planning is non-optional for global launches; patent rights are territorial, and claim scope, annuity status, and local examination standards vary materially by jurisdiction.CNIPA now grants substantial pharmaceutical patent portfolios for Chinese domestic originators; any program with China commercial ambitions requires CNIPA monitoring in parallel with USPTO and EPO coverage.Design-around feasibility is jointly a legal and scientific question; chemistry-based and formulation-based design-arounds require coordinated analysis by patent counsel and R&D scientists to assess both FTO clearance and preserved pharmacological efficacy.
Section 6: White Space Analysis and R&D Portfolio Targeting
6.1 Defining White Space in Pharmaceutical Patent Landscapes
White space in a pharmaceutical patent landscape is an area of therapeutic relevance with limited or no patent protection, combined with unmet clinical need that would support commercial development. The phrase is often used loosely to mean ‘uncrowded,’ but a rigorous white space analysis distinguishes between areas that are uncrowded because they have been technically intractable, areas that are uncrowded because the commercial opportunity has been overlooked, and areas that appear uncrowded because the relevant patents are unpublished within the 18-month filing lag. Each category warrants different strategic responses.
Technically intractable white spaces become commercially attractive when a platform technology that solves the technical problem becomes available. The emergence of mRNA delivery via lipid nanoparticle (LNP) systems opened white spaces in protein replacement therapies and vaccine platforms that had been inaccessible under prior delivery constraints. Moderna’s patent strategy around LNP formulation technology, combined with mRNA modification chemistry licensed from the University of Pennsylvania, created a new patent cluster in a space that had nominal prior art but no viable commercial path. Companies monitoring the LNP patent landscape in 2015-2018 had sufficient lead time to in-license or build competing formulation positions before the space became crowded.
Overlooked commercial white spaces are often found in disease areas with heterogeneous patient populations and limited market size. Rare diseases, pediatric indications, and conditions with high rate of misdiagnosis historically received less patent activity relative to their clinical importance. Orphan drug designation, which provides seven years of market exclusivity in the U.S. and ten years in the EU in addition to any patent protection, amplifies the white space opportunity in these areas by creating exclusivity even when a patent position cannot be built.
6.2 Patent Landscape Analysis Methodology
A formal patent landscape analysis for white space identification proceeds through a series of structured analytical steps. The analysis begins with a comprehensive search of the relevant patent corpus using CPC classification, keyword, assignee, and citation searches to populate a dataset that includes all potentially relevant filings. This dataset is then processed through a deduplication and relevance filtering step to remove noise while preserving borderline-relevant filings for manual review.
The filtered dataset is clustered by technology approach, therapeutic target, patient population, and geographic coverage. Clustering algorithms, whether hierarchical, k-means, or graph-based citation network analysis, reveal the density distribution of patent activity across the landscape. High-density clusters indicate areas of intense competitive activity and potential patent thickets. Low-density clusters with high citation connectivity to the high-density areas, indicating that the underlying biology is recognized as relevant but insufficiently exploited, are the most productive white space candidates.
Expiry mapping overlays the temporal dimension. A patent cluster that is dense today but has a concentrated expiry profile in five to seven years represents a near-term white space in the sense that the barrier to entry will fall on a predictable schedule. A generic or biosimilar developer monitoring this cluster can time its development investment to complete clinical work shortly before the expiry wave, positioning for entry at the moment of maximum market opportunity. An originator monitoring the same cluster can evaluate whether to in-license or acquire assets in the space before the expiry-driven commodity dynamic sets in.
6.3 Using Patent Intelligence to Position for Emerging Therapeutic Areas
Deloitte’s analysis identified Alzheimer’s disease, stroke, and multiple sclerosis as therapeutic areas where first-mover or fast-follower positioning could create competitive advantage through a combination of unmet clinical need and relatively lower patent density compared to oncology. Monitoring patent activity in these areas reveals which biological mechanisms are attracting early filing activity, which academic institutions are generating the science behind those filings, and which companies are acquiring or licensing the resulting IP.
The amyloid-beta and tau pathway patent landscapes in Alzheimer’s disease illustrate the analytical complexity. Years of failed clinical trials in these pathways generated a dense prior art record that paradoxically creates opportunity: the clinical failures revealed that amyloid removal alone is insufficient, pointing toward combination approaches, early intervention strategies, and alternative targets such as neuroinflammation and synaptic dysfunction. Patent monitoring that tracks all of these sub-landscapes simultaneously identifies which academic groups and emerging biotechs are filing on the next-generation approaches, providing a roadmap for business development targeting.
Obesity and metabolic syndrome represent the most commercially dynamic current white space opportunity. The GLP-1 receptor agonist class, dominated by semaglutide (Ozempic/Wegovy) and tirzepatide (Mounjaro/Zepbound), has created a gold rush in follow-on mechanisms: GLP-1/GIP dual agonists, GLP-1/glucagon dual agonists, amylin analogues, and oral small-molecule GLP-1 receptor agonists. The patent landscape in this space is evolving at a pace that requires weekly monitoring to track new compound filings, new formulation patents for oral delivery (the hardest technical problem in the class), and new dosing regimen patents that might create method-of-use barriers for competitors developing the same molecule class.
Key TakeawaysWhite space categories are distinct: technically intractable areas become viable when platform technologies evolve; overlooked commercial areas become apparent through disease area and patient population analysis; apparent white spaces near filing lag windows require indirect signal analysis to assess whether they are genuinely empty.LNP/mRNA delivery patent monitoring in 2015-2018 gave early movers lead time to build competing formulation positions before the space matured; the current GLP-1 oral delivery patent race is an analogous window.Patent landscape clustering by technology, target, and geography, overlaid with expiry mapping, reveals near-term white spaces created by patent cliff waves in high-density clusters.GLP-1 receptor agonist and metabolic disease patent landscapes are evolving at weekly pace; monthly monitoring cadence is insufficient for this space in 2025-2026.
Section 7: AI and Machine Learning in Pharmaceutical Patent Monitoring
7.1 Where AI Adds Genuine Value in Patent Analysis
The pharmaceutical industry’s patent monitoring problem is fundamentally a large-scale text classification problem with domain-specific complexity. Approximately 3.4 million patent applications published globally in 2023, and the pharmaceutical and biotech sectors account for roughly 180,000-200,000 of those. No human team can read and evaluate all relevant publications. AI-based tools add value at the volume layer, classifying new filings for relevance and routing them appropriately without requiring human review of every document. Human expert attention is then reserved for the high-relevance subset identified by the classifier.
Natural language processing (NLP) is the core enabling technology for patent text analysis. Large language models (LLMs) pre-trained on scientific literature and patent corpora can identify the biological target discussed in a patent without explicit keyword matching, classify a compound’s mechanism based on its structural description, and recognize that two patents describe the same invention using different terminology. These capabilities close the coverage gap that afflicts keyword-only search systems in domains where nomenclature evolves rapidly, such as cell therapy, gene editing, and RNA therapeutics.
Citation network analysis uses graph-based algorithms to map the relationships between patents. A patent that receives a high volume of forward citations (citations from later patents) is influential in the field; its claims define what subsequent filings must differentiate from. Identifying the most highly cited patents in a landscape quickly identifies the patents that pose the greatest blocking risk and are most frequently asserted in litigation. PageRank-style centrality scores applied to patent citation graphs generate a ranking of patent influence that is more informative than simple filing date or grant date ranking.
Machine learning models trained on historical USPTO and EPO prosecution data can predict the probability that a pending application will be granted with broad versus narrow claims. These models use features derived from application characteristics: number of independent claims, claim scope as measured by word count and specificity of claim language, examiner identity and historical grant rates, number of prior art references cited, and similarity to previously granted claims in the same CPC class. Clarivate’s Derwent Innovation platform and PatSnap’s Insights module both offer versions of this predictive capability.
For FTO analysis, grant probability models inform how much weight to give pending applications in a risk assessment. An application with a 75% estimated grant probability and a claim scope that reads directly on a company’s lead compound is a material risk that should be disclosed in internal program assessments. An application with 30% grant probability and claims that require significant narrowing before allowance may be worth monitoring but not worth immediate legal response.
Litigation outcome prediction models use historical PTAB and district court data to estimate the probability that a specific asserted patent will be found valid and infringed. Key predictive features include patent age, prior art quality, claim breadth, and defendant size. These models inform both the branded company’s decision about which patents to include in an Orange Book listing and the generic company’s decision about which patents to challenge via Paragraph IV. As the datasets underlying these models grow, their predictive accuracy at the portfolio level is becoming commercially meaningful.
7.3 Integrating Patent Data with Clinical Trial and Publication Databases
The highest-value patent intelligence comes from integrating patent data with correlated datasets. ClinicalTrials.gov contains structured data on approximately 500,000 registered trials, including sponsor identities, therapeutic targets, compounds under study, enrollment criteria, and primary endpoints. Linking patent data to clinical trial data reveals which companies are advancing clinical programs in areas where they have filed patents, which provides a more complete picture of competitive activity than either data source alone.
PubMed and bioRxiv/medRxiv preprint data complement the patent record by revealing the scientific basis for inventions before or concurrently with patent filing. Academic research groups often publish results and then file patent applications, or file and then publish. Monitoring both publication databases and patent databases for the same research groups, identified by PI name, institution, and grant award (NIH Reporter is a useful secondary source), provides the earliest possible signal of emerging inventions in a field.
Regulatory filing databases, including FDA’s Drugs@FDA, the EU Clinical Trials Register, and PMDA (Japan) databases, add the regulatory dimension to the integrated picture. A company that has filed an NDA or BLA for a product in a space under patent monitoring is a declared competitor. Tracking the regulatory status of competitor programs alongside their patent activity allows R&D teams to estimate competitor timelines and identify scenarios where a competitor might achieve approval before an ongoing patent dispute is resolved.
7.4 Building an In-House AI-Augmented Monitoring Capability
Organizations building in-house AI-augmented patent monitoring capabilities face a build-versus-buy decision at multiple layers. Patent database access requires licensing from Derwent, LexisNexis PatentStrategist, PatSnap, or similar providers. NLP classification models can be built internally using open-source frameworks (Hugging Face Transformers) fine-tuned on company-specific labeled data, or purchased as pre-built models from vendors including Innography (now part of CPA Global/Clarivate) and 1790 Analytics. Visualization and alerting platforms range from custom-built dashboards using D3.js or Tableau to integrated IP management systems from Anaqua, Dennemeyer, or CPI.
The limiting factor in most organizations is not technology but labeled training data. A classifier that routes patent alerts to R&D scientists versus patent counsel requires labeled examples of which filings belong in which category. Creating this training data requires domain expertise from both lawyers and scientists, and it must be continuously updated as the company’s technology focus evolves. Organizations that invest in structured labeling programs, maintaining a curated dataset of past monitoring decisions and their outcomes, build proprietary model performance advantages over time.
Key TakeawaysAI/NLP reduces the volume problem in pharmaceutical patent monitoring, enabling human expert attention to focus on high-relevance findings rather than raw document review.Citation network centrality scoring identifies the most legally influential patents in a landscape faster and more accurately than manual analysis of large corpora.Machine learning grant probability models inform FTO risk weighting for pending applications, which is material information that pure keyword searches cannot provide.Integrating patent data with ClinicalTrials.gov, PubMed, and regulatory filing databases creates a multi-layer competitive intelligence picture significantly more actionable than any single data source.Proprietary labeled training data is the durable competitive advantage in AI-augmented patent monitoring; organizations with curated historical decision datasets will outperform those relying solely on vendor-provided models.
Section 8: Measuring the ROI of Patent Monitoring Programs
8.1 The Attribution Problem and How to Solve It
Demonstrating that a patent monitoring program contributed to a positive outcome requires solving an attribution problem: the program identified a risk or opportunity that was acted upon, but would the action have been taken anyway without the monitoring? This counterfactual question is analytically uncomfortable but necessary. Without credible attribution methodology, patent monitoring programs are vulnerable to budget cuts because their value is invisible in standard R&D accounting.
The most defensible attribution approach tracks specific decision points where patent intelligence was a documented input. When a patent monitoring alert triggered an FTO analysis that identified a blocking claim, and the FTO analysis triggered a chemistry redesign that was successfully implemented, the cost of the alternative, litigation plus potential development restart, can be estimated and attributed to the monitoring program. When a landscape analysis identified a white space that led to a new program investment, the NPV of that program, probability-weighted for clinical success, is attributable to the analysis.
Program databases that log monitoring findings, document the decisions they informed, and record the outcomes of those decisions over time build the retrospective evidence base needed for credible attribution. Five years of such data, spanning multiple development programs, allows regression analysis of the correlation between patent intelligence quality and program outcomes. Organizations that have built these databases report that they provide some of the strongest internal advocacy material for continued investment in patent monitoring capabilities.
8.2 KPIs for Patent Intelligence Programs
Operational KPIs for a patent monitoring program measure the quality and timeliness of intelligence delivery. Coverage rate, the percentage of newly published patents in the defined monitoring perimeter that are reviewed within the target SLA, is the foundational metric. Alert precision, the percentage of routed alerts that the receiving stakeholder assesses as relevant to their work, measures whether query design is appropriately calibrated. Alert timeliness measures the lag between patent publication and stakeholder receipt; a monitoring program that delivers alerts six weeks after publication is providing little advantage over unmonitored search.
Outcome KPIs are more valuable but harder to collect. The number of R&D stage-gate decisions informed by patent intelligence, tracked by documenting the patent data considered at each stage-gate review, provides a denominator for assessing penetration of patent intelligence into R&D decision-making. The number of Paragraph IV certifications filed against the company’s patents, divided by the number that were anticipated by monitoring alerts before filing, measures how effectively monitoring is predicting challenges. The time between monitoring alert and first FTO analysis response measures organizational responsiveness to competitive IP threats.
8.3 Communicating Patent Intelligence Value to Leadership
R&D leadership and CFOs respond to financial impact numbers. Patent monitoring programs that communicate in the language of risk-adjusted NPV are more likely to receive sustained investment than those that report document counts and alert volumes. A quarterly patent intelligence brief for leadership should include, at minimum, three categories of findings: avoided costs (FTO risks identified and resolved before litigation or development restart), captured opportunities (white space findings that influenced investment decisions), and threat assessments (competitor patent filings or grants that materially change the competitive landscape for priority programs).
Each finding should carry a financial estimate. An avoided litigation cost can be estimated from published median defense costs for pharmaceutical patent cases ($5-15 million through trial plus potential damages). A captured white space opportunity can be estimated from the probability-weighted NPV of the program it informed. A competitive threat assessment can frame the range of commercial impact scenarios if the competitor’s patent position holds up, from modest market share impact to market exclusion. These estimates are necessarily rough, but they are far more persuasive to a CFO than a list of patent numbers.
Key TakeawaysAttribution methodology for patent monitoring ROI requires a decision-log database that tracks specific monitoring outputs, the decisions they informed, and the outcomes of those decisions over time.Operational KPIs (coverage rate, alert precision, timeliness) and outcome KPIs (stage-gate decisions informed, Paragraph IV anticipation rate) must both be measured; neither alone tells the full story.Leadership communication should quantify three categories of value: avoided costs, captured opportunities, and competitive threat impact, using risk-adjusted NPV estimates rather than document counts.
Section 9: Building and Governing a World-Class Patent Intelligence Function
9.1 Organizational Structure
The most effective pharmaceutical patent intelligence functions operate as a shared service that is organizationally adjacent to, but not embedded within, either the legal department or the R&D organization. Patent counsel embedded in the legal department optimizes for legal risk management and may underweight commercial intelligence needs. R&D-embedded patent analysts optimizes for scientific relevance but may underweight legal nuance. A dedicated patent intelligence function, reporting to the Chief IP Officer or Chief Strategy Officer, with service-level agreements with both legal and R&D, provides the organizational positioning to serve both constituencies.
Team composition should include patent agents or attorneys with pharmaceutical prosecution experience, competitive intelligence analysts with scientific backgrounds in relevant therapeutic areas, data scientists or bioinformaticians who manage the AI and database infrastructure, and at least one individual with licensing and business development experience who can translate patent landscape findings into partnership and acquisition recommendations. In smaller organizations, these roles may be consolidated, but the functional competencies must be present in some form.
9.2 Technology Stack Recommendations
A functional patent intelligence technology stack for a mid-to-large pharmaceutical company includes a patent database subscription (Derwent Innovation, PatSnap, or equivalent), an NLP-based relevance classification layer (either vendor-provided or internally trained), a portfolio management system that maintains the company’s own patent estate data alongside the competitive monitoring database, a docketing system integrated with USPTO and EPO e-filing systems, and a visualization or business intelligence layer that allows non-specialist stakeholders to interact with landscape maps and expiry timelines without requiring database query skills.
Integration with the company’s ELN (electronic laboratory notebook) system and clinical trial management system allows patent findings to be linked directly to the R&D programs they affect, creating a traceable connection between IP intelligence and scientific decision-making. This integration is technically straightforward but organizationally complex, requiring data governance frameworks that preserve the confidentiality of privileged legal communications while enabling appropriate data sharing with non-legal stakeholders.
9.3 Governance: Managing Privilege and Information Barriers
Patent monitoring programs generate information that may be subject to attorney-client privilege if it involves legal advice, or that may need to be segregated behind information barriers if the company is engaged in business development activities involving the entities being monitored. Governance frameworks for patent intelligence must address both. Monitoring reports that include legal risk assessments should be prepared under attorney direction and distributed under privilege protections. Competitive monitoring intelligence that could be relevant to a pending acquisition target must be handled under information barrier protocols if the business development team is involved in that acquisition.
The China-specific dimension of information governance has become more complex since 2022. Chinese patent applications filed by Chinese domestic pharmaceutical companies on targets or molecules relevant to Western programs raise questions about whether engaging with the application content triggers any regulatory notification obligations under the Foreign Investment Risk Review Modernization Act (FIRRMA) or equivalent regulations in other jurisdictions. Most patent monitoring activities on publicly available data do not trigger these obligations, but legal counsel should confirm the specific parameters for each monitoring program that involves Chinese-origin IP.
Key TakeawaysPatent intelligence functions that report to Chief IP Officer or Chief Strategy Officer, with SLAs to both legal and R&D, outperform those embedded in either department alone.Team composition must include prosecution expertise, competitive intelligence analytical skill, data science capability, and business development translation ability; these four competencies rarely coexist in a two-person team.Governance frameworks for privilege and information barriers must be established before a monitoring program launches, not retrofitted after a privilege dispute or barrier breach.
Section 10: Case Mechanics, Sector-Specific Deep Dives
10.1 GLP-1 Receptor Agonists: The Hottest Patent Landscape of 2025-2026
Semaglutide’s commercial trajectory, from $2.2 billion in 2021 revenues to over $20 billion projected for 2025, has made the GLP-1 patent landscape the most watched in the industry. Novo Nordisk’s core semaglutide compound patent (US10,407,468) expires in 2026 in the U.S., but the company has filed an extensive continuation portfolio covering specific dosing regimens for obesity indications, oral formulation technology (which includes the SNAC absorption enhancer component that has its own independent patent life), and device technology for the FlexTouch and prefilled syringe delivery systems.
Eli Lilly’s tirzepatide (GIP/GLP-1 dual agonist) occupies a structurally different patent position. The compound itself (US10,167,327 and related) covers the specific dual-receptor agonist sequence and has protection running into the early 2030s. The ongoing Paragraph IV litigation by oral small-molecule GLP-1 program developers attempting to design around tirzepatide’s structural claims is the most instructive current case in the field for monitoring the boundary between patentable novelty and obvious modification of a prior art structure.
For any organization developing in the GLP-1 space, weekly monitoring of USPTO pre-grant publications in CPC class A61K38/26 (glucagon-like peptides) and A61K31/00 (pharmaceutical compositions) is a minimum requirement. Chinese domestic company filings from Zhejiang Beta Pharma, HEC Pharm, and Hangzhou Zhongmei Huadong should be included in the monitoring perimeter, as these companies have active oral GLP-1 programs with patent estates that may create prior art for Western programs or generate FTO obstacles in Asian markets.
10.2 Oncology Cell Therapy: CAR-T and the Patent Thicket Problem
CAR-T cell therapy patent landscapes present a case study in patent thicket formation. The foundational patents from Carl June’s University of Pennsylvania group, Juno Therapeutics (now Bristol-Myers Squibb), and Kite Pharma (now Gilead Sciences) collectively cover the basic CAR architecture, co-stimulatory domain configurations (particularly the CD28 versus 4-1BB distinction), viral vector manufacturing processes, and conditioning regimen protocols. These overlapping positions have been litigated extensively, including the $752 million jury verdict in Juno Therapeutics v. Kite Pharma (later partially vacated and settled), which established important precedent on written description requirements for broad CAR-T patent claims.
The emerging patent landscape in allogeneic (off-the-shelf) CAR-T therapy presents a different monitoring challenge. Companies including Allogene Therapeutics, Precision BioSciences, and Cellectis are constructing patent positions around TALEN, CRISPR-Cas, and base-editing approaches for TCR disruption, which is necessary to prevent graft-versus-host disease in allogeneic products. The intersection of cell therapy patent claims with CRISPR delivery patent claims creates a compound landscape where FTO for any new allogeneic program requires analysis against patents from at least three independent technology layers.
10.3 Rare Disease and Orphan Drug Patent Strategy
Orphan drug designation (ODD) in the U.S. provides seven years of market exclusivity from the date of approval, irrespective of patent status. This creates a strategic context different from standard pharmaceutical development: companies developing orphan therapies for which no meaningful patent position can be built (for example, repurposed generic compounds for rare diseases) still have a durable commercial window. Monitoring competitor ODD filings at FDA, which are publicly disclosed, provides advance intelligence about therapeutic areas where competitors are establishing orphan exclusivity positions that will block a second product from receiving ODD for the same indication in the same orphan population.
The intersection of orphan drug exclusivity and patent protection creates a layered exclusivity analysis that is distinct from standard LOE modeling. A compound with ODD approval and a compound patent expiring five years post-approval has an effective exclusivity period determined by whichever protection expires later. Sarepta Therapeutics’ exon-skipping oligonucleotide therapies for Duchenne muscular dystrophy combine patent protection on specific antisense sequences with ODD exclusivity for specific exon targets, creating a product-by-exon exclusivity structure that requires careful monitoring to map.
Key TakeawaysWeekly monitoring cadence for GLP-1 patent landscape is a minimum standard in 2025-2026; monthly monitoring misses material filings in a field evolving at this pace.CAR-T patent thicket analysis requires a three-layer FTO framework covering CAR architecture patents, manufacturing process patents, and gene-editing delivery patents; single-layer analysis is insufficient.ODD filing monitoring at FDA is a free competitive intelligence source that identifies therapeutic areas where competitors are establishing orphan exclusivity positions before their clinical programs become visible in ClinicalTrials.gov.
Section 11: Comprehensive Investment Strategy Framework for Pharma/Biotech Analysts
11.1 Patent Intelligence as Part of Due Diligence
Patent due diligence for a pharmaceutical acquisition or licensing transaction should cover the target’s own patent estate, the competitor landscape surrounding the target’s products, and the FTO position of the target’s pipeline. The sequence matters: analysts sometimes begin with the competitor landscape and stop there, missing the possibility that the target’s own patent applications, still unpublished within the 18-month filing lag, contain claims that will materially strengthen or change the exclusivity picture.
The target’s patent estate should be analyzed for claim strength (scope and prosecution history), geographic coverage (which major markets have corresponding national patents), remaining exclusivity (applying PTE and SPC calculations), and vulnerability (identifying which patents are closest to prior art and most likely to attract IPR or Paragraph IV challenges). The output of this analysis is a probability-weighted NPV adjustment to the base commercial forecast.
11.2 Patent Monitoring as a Continuous Investment Signal
Buy-side analysts who maintain continuous monitoring programs on the patent landscapes of covered companies generate leading indicators not available from standard fundamental analysis. When a monitored company files a burst of continuation applications on a specific compound or formulation, it is likely anticipating a competitor or generic threat and strengthening its position. When a monitored company’s patent estate shows a cluster of upcoming expirations without corresponding new filings, LOE risk is building. When a competitor to a covered company files Paragraph IV certifications on the covered company’s Orange Book patents, the litigation timeline begins, and the 30-month stay calculus becomes a specific input to the revenue forecast.
Short-side analysts have historically used patent expiry data to time short positions ahead of LOE events. The trade is most effective when the patent cliff is later than consensus, due to a PTE or SPC extension that consensus models missed, combined with biosimilar or generic pipeline data that indicates earlier-than-expected competitive entry. The spread between the market’s implied LOE date and the analytically correct LOE date is the edge. Systematic patent monitoring, applied consistently to a defined universe of covered names, generates this edge on a repeatable basis.
11.3 Portfolio Construction Around Patent Cycle Themes
Patent cycle themes offer a structured approach to pharmaceutical sector portfolio construction. A long position in a company with a deep pipeline of assets in the five-to-ten-year pre-LOE window, supported by active evergreening programs and a history of successful Paragraph IV defense, has a different risk profile than a long position in a company whose top-three revenue contributors face primary compound patent expiry within three years without successor assets. Both may appear similarly valued on near-term earnings multiples, but the patent-informed forward revenue distribution is materially different.
Biosimilar developers offer a patent-cycle-themed long opportunity at specific points in their development timeline. A biosimilar applicant with a filed aBLA for a biologic generating $5 billion in annual U.S. revenues, with all Paragraph IV and BPCIA patent dance litigation likely to resolve favorably based on claim strength analysis, and with interchangeability switching studies nearing completion, has a quantifiable revenue catalyst that is imprecisely priced by the market because most fundamental analysts do not conduct the patent analysis necessary to confirm the litigation risk assessment.
Investment Strategy: Patent-Informed Portfolio Construction SummaryOverweight: Companies with staggered LOE profiles (no more than 30% of revenues facing primary compound patent expiry in any single two-year window), active evergreening programs evidenced by continuation patent filings, and strong Phase III pipelines in areas of low patent density.Underweight: Companies where 40%+ of revenues are exposed to primary compound patent expiry within three years, with no filed continuation or formulation patents extending exclusivity and no pipeline assets in late-stage clinical development.Catalyst positions: Biosimilar developers with aBLA filed, litigation risk quantified favorably by claim analysis, and interchangeability switching study data expected within 12 months. These positions have defined catalysts and asymmetric upside if market does not fully price the interchangeability designation impact.Short thesis: Companies where patent monitoring reveals undisclosed Paragraph IV certifications that have not yet been disclosed in SEC filings or investor calls, indicating that litigation has commenced and the 30-month stay period has begun. These situations frequently involve misaligned market pricing relative to the now-quantifiable LOE scenario.
Consolidated Key Takeaways Across All Sections
Key TakeawaysPharma R&D IRR recovered to 5.9% in 2024. The companies most consistently above the cohort average are those with structured IP intelligence programs that reduce late-stage attrition and accelerate FTO clearance.Patent estate valuation is a four-to-six layer analysis requiring PTE, SPC, pediatric exclusivity, and probability-weighted patent survival assessments. Raw compound patent expiry dates are systematically incorrect as LOE proxies.Evergreening is legally and commercially standard practice; the most durable architectures layer formulation, device, and method-of-use patents to stagger LOE profiles across five or more distinct expiry windows.Orange Book and Purple Book analysis, correlated with PTAB/district court docket monitoring, generates LOE timing estimates that are materially more accurate than consensus sell-side models.Biosimilar interchangeability designation is the operative LOE event for biologics; monitoring clinical switching study timelines provides an 18-month lead indicator over FDA approval.BPCIA patent dance litigation filings are a secondary competitive intelligence source that reveals which patents the reference product sponsor considers most defensible.Patent monitoring program design requires explicit definition of technology, competitor, geography, and legal-status axes. A program without defined scope generates noise that discredits the function internally.The 18-month PCT publication lag creates a structural intelligence gap. Indirect signals from national phase entries, continuation chains, and journal publication timelines partially close it.Paragraph IV strategy is bi-directional: generic companies use it to prioritize challenges; branded companies use monitoring to identify which patents to strengthen before a Paragraph IV filing arrives.White space analysis distinguishes technically intractable areas from overlooked commercial opportunities and filing-lag-masked competitive activity; each requires a different strategic response.GLP-1 oral delivery, allogeneic CAR-T, and Alzheimer’s neuroinflammation pathways are the three highest-value white space monitoring priorities for R&D portfolio targeting in 2025-2026.AI/NLP adds genuine value at the volume layer of patent monitoring; citation network centrality scoring, grant probability modeling, and multi-database integration constitute the current state of practice.Proprietary labeled training data is the durable competitive advantage in AI-augmented monitoring; vendor-provided models without company-specific fine-tuning systematically underperform on domain-specific relevance classification.Patent monitoring ROI attribution requires a decision-log database. Organizations without this infrastructure cannot credibly defend monitoring program budgets to CFOs.Buy-side analysts who maintain continuous patent monitoring on covered names generate LOE timing, Paragraph IV litigation status, and evergreening readiness data that produces measurable alpha relative to consensus models relying on nominal expiry dates.
Data Sources and References
Deloitte 15th Annual Pharmaceutical Innovation Report (2025). Pharma R&D Returns Continue Upward for Second Consecutive Year. PR Newswire, March 2025.
Deloitte Life Sciences. Measuring Return from Pharmaceutical Innovation 2024. Deloitte Switzerland / Deloitte Global, 2024.
Fierce Biotech. Big Pharma ROI in Drug R&D Saw Surprise Rebound in 2023. February 2024.
RWS Group. The Advantages of Patent Monitoring Across the Product Lifecycle. 2024.
Sagacious Research. How Patent Monitoring Can Safeguard Against Competition. 2024.
FDA Orange Book: Approved Drug Products with Therapeutic Equivalence Evaluations. Current edition. FDA.gov.
FDA Purple Book: Lists of Licensed Biological Products with Reference Product Exclusivity and Biosimilarity or Interchangeability Evaluations. Current edition. FDA.gov.
USPTO Patent Full-Text Database and Patent Application Information Retrieval (PAIR) System. Accessed 2025.
European Patent Office Espacenet Patent Search Database. Accessed 2025.
IQVIA Institute for Human Data Science. Global Trends in R&D 2025. IQVIA, 2025.
GlaxoSmithKline v. Teva Pharmaceuticals USA, Inc. United States Court of Appeals for the Federal Circuit. Case No. 18-1976, 2021.
Juno Therapeutics v. Kite Pharma. U.S. District Court, Central District of California. Case No. 2:17-cv-07639, 2019.
Sandoz Inc. v. Amgen Inc. United States Supreme Court. 582 U.S. 1 (2017).
DrugPatentWatch Platform. Patent Intelligence for Branded and Generic Pharmaceutical Products. DrugPatentWatch.com, 2025.
Copyright Notice
This document was developed using source analysis from DrugPatentWatch.com and publicly available regulatory, litigation, and financial data. It is intended for informational purposes for pharmaceutical IP professionals, R&D leaders, and institutional investors. It does not constitute legal advice or an investment recommendation.