Part 1: The True Price of Innovation — The Multi-Layered Cost of a Drug Patent
Beyond the Filing Fee: The Patent Cost Iceberg
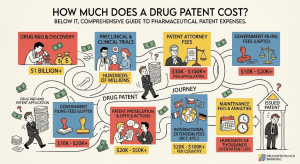
When business leaders, investors, or R&D professionals ask how much a drug patent costs, they are usually thinking about a line item: a discrete legal expense that appears on a project budget. The initial figures quoted, typically $10,000 to $50,000 for attorney and filing fees, seem substantial but are misleading [1]. They represent the visible tip of a financial iceberg. The true cost of a drug patent runs orders of magnitude higher, with the vast majority of its mass submerged in multi-billion-dollar research and development, protracted global prosecution, and the ever-present threat of multi-million-dollar post-grant defense [2].
This pillar page constructs a complete financial anatomy of a pharmaceutical patent. It moves from the laboratory investment that precedes any legal filing through U.S. prosecution mechanics, global filing economics, and post-grant maintenance, and then into the territory most analyses ignore entirely: how patent term extensions (PTEs) and Supplementary Protection Certificates (SPCs) convert the cost of securing a patent into an asset that generates billions in protected revenue far beyond the nominal 20-year patent term. The audience is pharma and biotech IP teams who need operational precision, R&D leads who need portfolio economics, and institutional investors who need a framework for modeling exclusivity-adjusted earnings.
The source article from DrugPatentWatch (How Much Does a Drug Patent Cost?) provides the foundational cost data. This expanded analysis triples its depth, adds company-specific IP valuation case studies, maps evergreening technology roadmaps for biologics, and attaches investment strategy frameworks to every major section [1].
The Strategic Imperative: IP Cost Knowledge as Competitive Weaponry
Many executives, particularly in emerging biotech firms, define patent cost as the initial legal and filing fees. This narrow view creates a strategic vulnerability. A company that fails to model the complete patent lifecycle — especially the exponential cost of international filing and the potential for defensive litigation — may find itself holding a groundbreaking asset but lacking the financial resources to protect it when generic challengers arrive. The consequence is not just lost revenue. It is the premature erosion of the market exclusivity that justified the original R&D investment.
Conversely, a company that understands the full cost architecture can deploy it offensively. Accurate cost forecasting enables sharper R&D portfolio decisions, more precise licensing valuations, and better-prepared litigation strategies. When this internal cost intelligence is combined with external patent landscape data from tools like DrugPatentWatch — which aggregates Orange Book listings, Paragraph IV certifications, PTE grants, SPC filings, and PTAB proceedings — it produces a decision framework that pure science expertise cannot replicate [1].
The companies that generate the largest revenue windfalls from pharmaceutical IP are not necessarily the ones with the best science. They are the ones that pair scientific innovation with a disciplined, data-driven understanding of the full cost and value of the patents that protect it.
Key Takeaways: Section 1
• Patent filing fees of $10,000-$50,000 represent the visible portion of a cost structure that includes billions in capitalized R&D, multi-year international prosecution, and potential eight-figure litigation defense.
• The 60-day window for PTE applications and the 30-month PCT national phase entry deadline are the two most commercially consequential legal deadlines in pharmaceutical IP management.
• Integrated patent intelligence platforms provide the external market layer that transforms internal cost knowledge into competitive strategy.
Part 2: The Foundation of Value — The Colossal Cost of Pharmaceutical R&D
The $2.6 Billion Question: Unpacking Tufts CSDD’s Capitalized Figure
The journey to understanding patent cost begins in the laboratory, long before any legal document is drafted. The Tufts Center for the Study of Drug Development (CSDD) estimated in a landmark 2016 study that the average cost to develop a new prescription drug and bring it to market runs to $2.6 billion [3]. This figure has been updated and debated, with estimates ranging from under $1 billion to over $2.8 billion depending on methodology, but its scale reflects a fundamental reality about the industry’s cost structure.
Two critical factors drive the Tufts figure beyond simple out-of-pocket spending. First, only about 12% of drugs that enter clinical trials ever receive FDA approval [6]. The billions spent on failed candidates must be absorbed by the rare successes. Second, drug development takes 10 to 15 years. The capital tied up in a drug candidate during that period cannot be deployed elsewhere. The Tufts model capitalizes the expected returns forgone during development — the opportunity cost — alongside actual spending. In their analysis, time costs accounted for nearly half the total $2.6 billion capitalized figure [3].
Critics, including Doctors Without Borders and several health policy researchers, argue the figure is inflated because it relies on confidential, unaudited data provided by companies and underweights public funding from the NIH, which often supports the foundational basic research that initiates a drug discovery program [7]. Despite the debate, the consensus position among industry economists is that bringing a new molecular entity to market requires a commitment measured in billions, making the patent that protects it a financial instrument of corresponding scale.
“Biopharmaceutical companies invest on average six times more in R&D as a percentage of sales than all other manufacturing industries combined.” — PhRMA Annual Survey, 2021 [8]
Industry-Wide R&D Investment: The PhRMA Data
PhRMA member companies invested $83 billion in R&D in 2019 and $102.3 billion in 2021, a record high representing approximately one dollar in five of total member revenue [8]. Over the prior two decades, member companies collectively invested more than $1.1 trillion in research. This level of spending establishes the pharmaceutical sector as the most R&D-intensive industry in the U.S. economy and underscores why the patent system — which protects the revenue that funds the next round of R&D — is not merely a legal formality but the economic engine of the industry’s innovation model.
The feedback loop is direct: revenues from patented medicines fund the R&D that creates future patented medicines. Analyses from the Congressional Budget Office and the USC Schaeffer Center have both found a measurable relationship between expected future drug revenues and current R&D investment levels [9]. Policies that reduce price realization during the exclusivity period reduce future R&D investment. This is the core economic rationale for patent term extensions and the reason that every additional day of exclusivity carries commercial significance proportional to the drug’s revenue.
The Biologics Premium: Small Molecules vs. Biologics in Detail
A comprehensive study published in 2024 comparing the legal protections and economics of small-molecule drugs versus biologics in the U.S. market quantifies the cost differential at the level of individual drug assets [10]. The median development cost for a biologic runs to $3.0 billion, compared to $2.1 billion for a small-molecule drug. This premium reflects more complex manufacturing processes and more intricate clinical trial designs. The higher cost comes with a higher probability of approval; biologics have demonstrated superior clinical trial success rates at every development phase compared to small molecules.
The economic divergence does not stop at development cost. Biologics generate a median of 14 patents per approved product, versus 3 for small molecules. The construction of these denser patent portfolios — covering the compound, device, formulation, manufacturing process, and methods of treatment — requires substantially more prosecutorial investment. But that investment buys substantially more protection. The median time to biosimilar market entry is 20.3 years from the innovator’s launch, versus 12.6 years for small-molecule generics [10]. At median peak annual revenues of $1.1 billion for biologics versus $0.5 billion for small molecules, the extended exclusivity window compounds the revenue advantage significantly.
The Inflation Reduction Act of 2022 amplified the financial incentive differential. Its Medicare price negotiation program exempts biologics from negotiation for 11 years post-approval, versus 7 years for small molecules [10]. This four-year difference in protection from government price pressure has a direct effect on net present value calculations for pipeline assets. R&D portfolio managers at companies including AbbVie, Roche, and Amgen have explicitly cited this differential as a factor in resource allocation decisions favoring biologic programs.
Metric
Small Molecules
Biologics
Median development cost
$2.1 billion
$3.0 billion
Median patents filed per drug
3
14
Median time to generic/biosimilar entry
12.6 years
20.3 years
Median peak annual revenue
$0.5 billion
$1.1 billion
U.S. regulatory data exclusivity
5 years (NCE)
12 years (BPCIA)
IRA Medicare negotiation exemption
7 years post-approval
11 years post-approval
Median annual treatment cost
$33,000
$92,000
PTE / SPC maximum restoration
5 years (U.S.)
5 years (U.S.) + 12-yr BPCIA exclusivity
Source: Wouters, O.J. et al. (2024). Differential Legal Protections for Biologics vs. Small-Molecule Drugs in the US, LSE Research Online [10]. Regulatory data from FDA [6] and 21 U.S.C. Section 355a.
Investment Strategy: The Biologics Valuation Premium
For institutional investors, the biologics premium in the 2024 Wouters study creates a concrete analytical framework. When modeling a pharma company’s revenue at risk from patent expiry, the analyst should apply different discount assumptions to biologic and small-molecule assets. A biologic with three years of formal patent remaining but 20.3-year median entry dynamics faces a slower erosion curve than the nominal expiry suggests. A small-molecule at the same nominal expiry date faces a steeper descent.
The IRA’s differential treatment adds a regulatory exclusivity overlay. A biologic generating $5 billion annually that reaches its seventh year post-approval is not yet subject to IRA negotiation, while a small molecule at the same point is already eligible. The revenue impact of that difference, compounded over four years of protected pricing, can exceed $8 billion in cumulative sales. Analysts who model both patent and IRA negotiation windows simultaneously produce materially more accurate long-range earnings forecasts than those who apply a single exclusivity date.
• Use 20.3 years as the median biosimilar entry baseline for biologic valuation models, not the nominal patent expiry date.
• Apply separate IRA negotiation discount overlays at year 7 (small molecules) and year 11 (biologics) in DCF models.
• Treat patent count per product as a proxy for entry barrier height: 14 patents signals a meaningfully different competitive moat than 3.
Key Takeaways: Section 2
• The $2.6 billion Tufts figure is a capitalized cost that includes the cost of failures and opportunity costs, not just out-of-pocket spending on a successful drug.
• PhRMA member companies spent $102.3 billion on R&D in 2021, making pharma the most R&D-intensive U.S. industry by investment as a share of revenue.
• Biologics cost $900 million more to develop than small molecules on median but generate twice the peak annual revenue and take 8 years longer for competing products to reach the market.
• The IRA’s differential negotiation windows — 7 years for small molecules, 11 years for biologics — have permanently shifted pipeline investment incentives toward biologic programs.
Part 3: The Price of U.S. Protection — Patent Prosecution in Detail
The Most Critical Investment: Patent Attorney Fees
Once a promising drug candidate emerges from R&D, securing legal protection begins. The single most significant direct expense at this stage is patent counsel. Pharmaceutical and biotechnology patents require deep understanding of organic chemistry, molecular biology, pharmacology, and the intricate case law that governs claim construction and validity. Skimping on legal expertise is a false economy: a weak patent — one that is easily challenged and circumvented — renders the multi-billion-dollar R&D investment dangerously exposed at the moment it most needs protecting.
For drafting and filing a non-provisional utility patent application on a complex pharmaceutical invention, companies should budget attorney fees of $15,000 to $50,000 or more [1]. Top-tier patent litigation firms — Kirkland & Ellis, Fish & Richardson, Irell & Manella — command hourly partner rates of $800 to $1,400. The technical and legal rigor required for a drug patent consistently places it at the upper end of the drafting fee range. The initial attorney engagement covers strategic consultation to understand the invention’s full scope, a patentability search and prior art opinion (an additional $2,000 to $5,000), meticulous claim drafting, and formal filing with the USPTO [2].
Decoding the 2025 USPTO Fee Schedule
Beyond attorney fees, applicants pay mandatory government fees to the USPTO. The fee structure is tiered by entity size. A large entity — typically a company with 500 or more employees — pays full fees. Small entities pay 60% of large entity rates. Micro entities pay 20%. Given the scale of most pharmaceutical companies, large entity rates govern the analysis throughout this section.
The January 2025 fee revisions introduced not only a rate increase but a set of targeted surcharges designed to address specific prosecution behaviors associated with patent thicket construction. The new surcharge for filing a continuing application six or more years after the earliest priority date ($2,700) and the nine-year surcharge ($4,000) directly penalize the practice of keeping a patent family alive through long chains of continuation filings — a standard lifecycle management tactic for blockbuster drugs. Similarly, new fees for Information Disclosure Statements with more than 50 or 100 citations penalize the document-dumping strategy some applicants use to overwhelm examiners. These are policy choices, not just revenue measures, and they materially affect the cost-benefit calculation for continuation-heavy IP strategies [5].
The Prosecution Gauntlet: Office Actions, RCEs, and Real Costs
Filing a patent application is the opening of a dialogue with the USPTO, not the end of the process. The USPTO grants patents as-filed in an extremely small fraction of cases. Most applications receive at least one Office Action — a formal rejection from the patent examiner citing prior art, indefiniteness, or claim scope objections [13]. Each Office Action requires a detailed legal and technical response. Preparing that response costs $3,500 to $10,000 in attorney fees, with complex biotechnology rejections reaching the higher end. A typical pharmaceutical application goes through one to three rounds of Office Actions before allowance or abandonment.
If a Final Office Action remains unresolved, the applicant files a Request for Continued Examination (RCE), paying for another round of examination. The 2025 fee schedule sets the first RCE at $1,500 and the second at $2,860. The 43% escalation on second RCEs is a deliberate deterrent against indefinite prosecution. Total U.S. prosecution cost for a pharmaceutical patent — from initial drafting through issuance, accounting for two Office Action responses — runs from $30,000 to $70,000 in a typical case, with complex biologics cases exceeding $100,000 [1][2].
Practitioner Note: For drugs within 24 months of expected FDA approval, IP teams should have PTE-eligible patent candidates identified and PCT applications filed before submission of the NDA/BLA. The 60-day PTE application deadline post-approval does not allow time to select a patent retroactively.
PTE Application Cost vs. PTE Revenue Value: The Return on Every Dollar
Once a drug receives FDA approval, the PTE application process begins its own cost arc. Filing a PTE application with the USPTO is procedurally simple: the primary expense is attorney time to assemble the application, calculate the regulatory review period, and identify the correct eligible patent. Total PTE application costs, including preparation, filing, and a typical prosecution exchange with the USPTO and FDA, rarely exceed $50,000 to $150,000.
Set against the revenue that a successfully granted PTE protects, that legal cost is arithmetically negligible. A drug generating $10 billion annually produces approximately $27.4 million per day. A two-year PTE adds 730 days of protected revenue, or $20 billion in protected gross sales. At a 30% operating margin, that translates to $6 billion in operating profit that would otherwise have been competed away by generic manufacturers. The $100,000 investment to secure the PTE generates a $6 billion return — a ratio of 60,000 to one. No other legal investment in pharmaceutical commerce produces a comparable ratio [14].
The risk-adjusted version of this calculation is equally compelling. PTE applications are routinely granted for drugs that meet the statutory criteria. The denial rate for properly prepared applications is low. The risk of losing a granted PTE to an IPR petition or litigation is more significant, which is why PTE defense budgets in litigation can reach $5 million to $50 million for major blockbusters — still a fraction of the revenue being protected.
Key Takeaways: Section 3
• Full U.S. patent prosecution for a pharmaceutical patent runs $30,000 to $70,000 in typical cases, with complex biologics exceeding $100,000.
• The 2025 USPTO continuing application surcharges of $2,700 and $4,000 directly target patent thicket construction via serial continuation filings.
• PTE application costs of $50,000 to $150,000 generate returns of 60,000-to-one or higher for major blockbusters when measured against protected operating profit.
• The 60-day PTE deadline is a hard statutory cutoff with no exceptions. Miss it and the extension is permanently forfeited.
Part 4: Going Global — The Exponential Costs of International Patent Protection
The PCT Pathway: Buying Time for $5,000
A U.S.-only patent strategy is commercially inadequate for any drug with blockbuster potential. Pharmaceutical markets are global. Protecting an innovation in major regions, particularly the European Union, Japan, China, and South Korea, is essential for capturing the full commercial value of a new molecular entity. The Patent Cooperation Treaty (PCT), administered by WIPO, manages the initial phase of global filing through a single international application that preserves the right to seek protection in over 150 countries [15].
The PCT application does not produce a global patent. It provides a unified formal filing and a centralized International Search Report, and it delays the need to commit to the expensive national phase in each target country for up to 30 to 31 months from the initial priority date. This delay is commercially valuable: it gives companies time to conduct further research, assess commercial viability, secure partnership or licensing deals, and direct capital to the jurisdictions most likely to matter. The upfront government cost of a PCT filing — transmittal fee ($285), international filing fee (~$1,603 for the first 30 pages), and search fee ($2,094 at EPO; $2,400 at USPTO as ISA) — totals approximately $4,000 to $5,000, one of the highest-value fee expenditures in pharmaceutical IP [15][16].
National Phase Entry: Where Costs Multiply
The real financial commitment of global patenting begins when PCT national phase entry decisions must be made. Each jurisdiction adds its own official fees, local counsel requirements, and translation costs. The cumulative cost of entering the national phase in a standard global filing strategy that covers the U.S., EPO, Japan, China, South Korea, and Canada easily exceeds $100,000 in direct costs, not including ongoing prosecution fees, which can double or triple that figure over the full prosecution period.
European Patent Office (EPO): The Costly Validation Trap
The EPO provides a centralized examination pathway for over 40 European countries. A single application undergoes a single examination. If granted, the patent must then be validated in each individual member state where protection is desired. This validation step requires country-specific fees and, in many countries, a full certified translation of the patent into the national language. Germany, the UK, France, and Italy are typically essential validation targets for major drugs; together, they may require four separate translation exercises, each costing $2,000 to $6,000 [17].
A unique and commercially significant feature of the EPO system is the requirement to pay escalating annual renewal fees on the application before it is even granted, starting from the third year after filing. Third-year fees run EUR 690, rising sharply each subsequent year [18]. For a pharmaceutical application that takes five to seven years to prosecute to grant, these pre-grant annuities alone can exceed EUR 10,000 to 15,000, paid without certainty that the patent will ever issue. Post-Brexit, UK SPC filings require a separate national filing process, adding further cost and administrative complexity for major pharmaceutical products.
Japan (JPO): Translation as the Primary Cost Driver
Japan is a critical pharmaceutical market and requires a Japanese patent attorney (benrishi) for prosecution. The official fees include a national phase entry fee (~JPY 14,000) and a Request for Examination fee calculated at a base fee of JPY 138,000 plus JPY 4,000 per claim. For a 20-claim application, the examination request fee alone exceeds JPY 218,000 (approximately $1,400). The dominant cost is translation: a pharmaceutical patent application of 50 pages into Japanese runs $3,000 to $6,000, and the complexity of pharmaceutical chemistry terminology pushes costs toward the upper end. Total entry cost in Japan typically runs $7,500 to $13,500 before prosecution commences [19].
China (CNIPA): Low Official Fees, High Counsel Dependency
China’s official fees are low compared to other major patent offices: the filing fee runs CNY 900 (~$120) and the substantive examination fee CNY 2,500 (~$350). Total official fees for a Chinese national phase entry fall below $500 in most cases. However, a local Chinese patent agent must be retained, and the application must be translated into Mandarin. Agent fees plus translation typically bring total entry costs to $5,000 to $10,000 [20]. China’s growing pharmaceutical market and the CNIPA’s increased willingness to grant broad composition claims for novel biologics have elevated China from a secondary consideration to a primary filing target for most major drug companies.
Jurisdiction
Official Fees (USD est.)
Local Counsel (USD est.)
Translation (USD est.)
Total Entry Cost (USD est.)
United States
$2,000-$3,000
Included in prosecution
N/A
$30,000-$70,000 (full prosecution)
EPO (Europe)
$4,500-$6,000
$4,000-$8,000
N/A (English filing)
$8,500-$14,000 (to grant, pre-validation)
Japan (JPO)
$1,500-$2,500
$3,000-$5,000
$3,000-$6,000
$7,500-$13,500
China (CNIPA)
$500-$1,000
$2,000-$4,000
$2,500-$5,000
$5,000-$10,000
South Korea (KIPO)
$800-$1,500
$2,000-$4,000
$2,500-$5,000
$5,300-$10,500
Canada (CIPO)
$1,200-$2,000
$3,000-$5,000
N/A (English filing)
$4,200-$7,000
Sources: DrugPatentWatch [1]; JPO fee schedule 2025 [19]; CNIPA official fee schedule [20]; EPO fee schedule effective April 2024 [18]. Counsel fees are estimated from practitioner surveys; actual fees vary significantly by firm and matter complexity.
The Great Multiplier: Patent Translation Economics
Across all non-English-speaking jurisdictions, patent translation is the single largest and most variable line item in global patent prosecution. A pharmaceutical patent application of 13,000 words costs $0.20 to $0.30 per word in professional translation, placing the cost at $2,600 to $3,900 per language — before review and certification fees [21]. Broader estimates from practitioner surveys place per-language costs from $2,000 to $10,000, depending on the language pair, technical density, and turnaround requirements.
For a company pursuing protection in Japan, China, South Korea, Germany (for validation in German), and two additional EU countries requiring national language translations, cumulative translation costs can exceed $20,000 to $35,000 per patent application — frequently surpassing the official government fees and local attorney fees in those same jurisdictions combined. A portfolio of 50 patents filed globally generates translation costs alone of $1 million to $1.75 million. This arithmetic explains why smaller biotech companies with three or four key assets concentrate their global filing in the U.S., EPO, and Japan rather than pursuing the 40-country coverage that a major multinational maintains.
Investment Strategy: Modeling Global Filing as IP Asset Value
For analysts valuing an early-stage company, the geographic scope of its patent filing strategy is a direct indicator of management’s confidence in the commercial potential of the asset. A company that has filed PCT and entered national phase in 15 or more jurisdictions has committed $300,000 to $500,000 in direct filing costs plus the implicit signal that management expects the drug to generate enough global revenue to justify that spend. A company that has filed only in the U.S. is either resource-constrained or strategically uncertain about its asset’s international potential. Both are meaningful data points in IP-adjusted valuation.
DrugPatentWatch’s patent filing and SPC databases make it possible to assess geographic coverage systematically. Analysts using the platform can compare the filing footprint of a competitor’s drug against the company under analysis to identify gaps that may indicate weaker international competitive positioning or, conversely, white space opportunities for new entrants in jurisdictions where the market leader has not filed [1].
Key Takeaways: Section 4
• PCT filing costs $4,000 to $5,000 in government fees but buys 30 months of strategic optionality before expensive national phase commitments are required.
• EPO pre-grant annuities consume EUR 10,000 to 15,000 during a typical five-to-seven-year prosecution timeline, before any validation costs are incurred.
• Translation into non-English languages is the most consistently underestimated cost in global patent filing, often exceeding $35,000 per application across a full global footprint.
• Patent filing geography is an analytically useful signal in competitive intelligence and early-stage company valuation.
Part 5: The Long Tail of Ownership — Post-Grant Costs and Litigation
The Meter is Always Running: Patent Maintenance and Annuity Fees
Securing a patent is not a one-time purchase. Keeping a U.S. utility patent in force for its full 20-year term requires escalating maintenance fees paid at three intervals post-grant. For a large entity, these are $2,150 at 3.5 years, $4,040 at 7.5 years, and $8,280 at 11.5 years, producing a cumulative U.S. maintenance cost of $14,470 per patent [5]. Missing any payment causes the patent to lapse. Reinstatement is possible within a grace period but requires additional fees and documentation of unintentional lapse.
Due Date (Post-Grant)
Fee Amount (Large Entity, USD)
Cumulative Cost (USD)
3.5 years
$2,150
$2,150
7.5 years
$4,040
$6,190
11.5 years
$8,280
$14,470
Source: USPTO large entity fee schedule, effective January 2025 [5].
In Europe, the annuity structure is more demanding. Annual renewal fees begin during prosecution, before the patent grants, with the third-year EPO fee at EUR 690 escalating sharply each year thereafter. After grant and national validation, separate annual renewal fees must be paid to each national patent office in each country where protection is maintained. For a drug protected across Germany, France, Italy, Spain, the Netherlands, and Switzerland, the combined annual European annuity payments for a single patent can reach EUR 15,000 to EUR 25,000 in mid-life, rising further in later years. A company managing SPC protection across those same six countries on top of the underlying patent faces annuity costs for both the patent and the SPC, sometimes in jurisdictions where different local counsel must file each renewal.
For a pharmaceutical company with 500 active patents across 20 jurisdictions, the annuity overhead can reach $10 million to $20 million annually. This cost is manageable for a large company but represents a significant operational burden for a mid-size biotech. Portfolio pruning — systematically identifying and abandoning patents no longer central to commercial strategy — is one of the most direct levers available to reduce this ongoing expense. A well-managed pruning exercise can cut annuity costs by 20% to 40% without surrendering protection on commercially relevant assets.
The Ultimate Cost: Pharmaceutical Patent Litigation
No post-grant cost comes close to litigation in scale or unpredictability. A patent grants the right to exclude others, but that right requires enforcement. If a competitor files a Paragraph IV ANDA certification asserting that a listed Orange Book patent is invalid or will not be infringed, the brand company has 45 days to file a patent infringement lawsuit triggering an automatic 30-month stay of generic approval. That lawsuit begins the litigation clock. For a high-stakes drug, the costs accumulate quickly.
AIPLA survey data provides the most authoritative figures on litigation cost by risk level. For a case where more than $25 million is at stake — a common threshold in pharmaceutical patent litigation — the median cost through the end of discovery runs $2.375 million to $3 million, with median total cost through trial and appeal reaching $4 million to $5.5 million per side [4]. Expert witness fees for a complex pharmacology case can add $500,000 to $2 million. Document review for a major Paragraph IV case, involving millions of pages of clinical and regulatory files, can cost $1 million to $3 million in e-discovery alone.
Amount at Risk
Median Cost Through Discovery
Median Total Through Trial
Less than $1 million
$250,000
$500,000
$1 million to $10 million
$600,000
$1,500,000
$10 million to $25 million
$1,225,000
$2,700,000
More than $25 million
$2,375,000-$3,000,000
$4,000,000-$5,500,000
Source: AIPLA Report of the Economic Survey (2019 and 2023 editions) [4]. Note: cases involving more than $25 million at stake typically reflect pharmaceutical patent disputes. Figures represent per-side costs. Actual expenses vary significantly by case complexity.
IPR Petitions: The Cheaper, Faster Validity Attack
The America Invents Act of 2011 created Inter Partes Review (IPR), a post-grant proceeding before the Patent Trial and Appeal Board (PTAB) in which any party can challenge a granted patent’s validity on prior art grounds. IPR is faster, less expensive, and has materially higher invalidation rates than district court litigation. Petitioners win invalidation of at least one claim in approximately 45 to 50 percent of IPR proceedings that reach a final written decision [22]. The PTAB has invalidated PTE-extended patents on drugs including Biogen’s Tecfidera (dimethyl fumarate), Jazz Pharmaceuticals’ Xyrem (sodium oxybate), and several major immunology products.
The cost of pursuing an IPR petition runs $50,000 to $300,000 in attorney fees through institution decision, plus $200,000 to $500,000 through final written decision if the petition is instituted. Compared to multi-million-dollar district court litigation, IPR is far more accessible to smaller generic manufacturers and enables challengers to target PTE-extended patents before the formal Paragraph IV filing process. The result is that no PTE-extended patent, regardless of the revenue it protects, can be treated as litigation-proof. All material PTEs require ongoing monitoring of PTAB petition activity as part of routine IP portfolio management.
BPCIA Patent Dance: The Biologic Litigation Premium
For biosimilar challengers, the BPCIA’s patent exchange process — the ‘patent dance’ under 42 U.S.C. Section 262(l) — creates a pre-litigation process that itself consumes months and millions. The biosimilar applicant must provide its FDA application to the reference product sponsor, the sponsor identifies patents it believes are infringed, the applicant responds with invalidity and non-infringement positions, and the parties negotiate which patents to litigate first. This process can generate simultaneous litigation across dozens of patents before a single biosimilar reaches patients.
AbbVie’s execution of this process against multiple Humira biosimilar applicants is the canonical case. By the time biosimilar sponsors navigated through AbbVie’s 247 Humira-related patents, U.S. biosimilar entry was delayed by seven years beyond the compound patent expiry, preserving revenues that reached $20 billion annually. The legal cost of mounting and defending that patent thicket over a seven-year period was estimated by IP analysts at $100 million to $300 million in aggregate. Against $20 billion in annual revenues, that represents a legal budget of roughly 0.7% of one year’s revenue to protect seven years of exclusivity [23].
Investment Strategy: Litigation Risk as a Patent Quality Signal
For pharmaceutical equity analysts, PTAB petition activity against a company’s patents is one of the most direct real-time signals of portfolio quality. A company whose PTE-extended patents attract multiple well-funded IPR petitions — particularly those filed by large generic manufacturers with established PTAB track records — faces a materially higher probability of early generic entry than its nominal exclusivity dates suggest. Monitoring PTAB petition filings against portfolio companies through platforms like DrugPatentWatch provides an early warning system that can move a revenue model by years and a stock valuation by double digits [1].
Conversely, a company whose PTE-extended patents have survived multiple IPR challenges without loss of commercially relevant claims has demonstrated portfolio durability. That track record of successful defense is a positive signal in IP-adjusted valuation, justifying a lower patent erosion discount in the DCF model than the average industry attrition rate would suggest.
Key Takeaways: Section 5
• U.S. patent maintenance fees total $14,470 per patent over a full 20-year term. European annuities add EUR 15,000 to EUR 25,000 per year per patent for mid-life coverage across six major markets.
• Pharmaceutical patent litigation with more than $25 million at risk costs $4 million to $5.5 million per side through trial — economically rational when defending exclusivity on a drug generating $10 million or more per day.
• IPR petitions invalidate at least one claim in 45-50% of instituted proceedings. All PTE-extended patents with significant revenue exposure require active PTAB monitoring.
• AbbVie’s Humira patent dance spent an estimated $100-$300 million in aggregate legal costs to preserve seven additional years of $20 billion annual revenues.
Part 6: The Patent Term Extension System — Converting Legal Cost into Revenue Windfalls
The Hatch-Waxman Bargain: What 1984 Law Does at 2025 Revenue Scale
The Drug Price Competition and Patent Term Restoration Act of 1984 created the PTE mechanism to compensate drug developers for time lost to FDA regulatory review. The logic was straightforward: because companies cannot sell their product while it is under regulatory review, their effective commercial patent term is shorter than the 20-year statutory term. Congress authorized the USPTO to restore that time, up to a maximum of five years, subject to a cap of 14 years of remaining exclusivity from approval.
The law was calibrated for a world in which blockbuster drug revenues were measured in hundreds of millions. At 2024 revenue levels, where dozens of drugs generate $5 billion to $20 billion annually, the PTE mechanism operates at a financial scale its architects could not have anticipated. A five-year PTE on a drug generating $20 billion per year protects $100 billion in revenue from generic competition. The legal cost of securing and defending that PTE — even at $50 million in litigation expenses — represents a fraction of a percent of the revenue protected. Nothing else in the U.S. legal system produces a comparable return on legal investment.
How the PTE Calculation Works: The Mechanics That Drive Billions
Under 35 U.S.C. Section 156, the PTE restoration equals one-half of the Phase I clinical trial period (from first IND to NDA filing) plus all of the Phase II FDA review period (from NDA filing to approval), minus 14,610 days (the five-year applicant delay penalty). The total restoration cannot exceed five years. The resulting post-approval exclusivity period cannot extend more than 14 years from approval, whichever is the binding constraint.
In practice, most small-molecule PTEs fall between two and three years. Drugs with longer development timelines — particularly those that spent extended periods under accelerated approval review or that had long Phase II reviews due to safety signals — can approach the five-year maximum. The FDA calculates and certifies the regulatory review period. Both the FDA’s determination and the USPTO’s final calculation can be challenged by generic manufacturers, creating a litigation surface that experienced patent counsel exploits when the stakes justify the investment [14].
Patent selection is itself a strategic decision of high consequence. The PTE applicant must designate a single patent from the Orange Book listing. The patent must claim the active ingredient, a method of use, or a method of manufacture, and must cover the approved product as approved. Selecting a patent that expires earliest maximizes the extension’s commercial reach, since a shorter-lived patent receives a larger proportional extension. However, the selected patent must be the most commercially relevant barrier to generic entry. A company that selects a manufacturing process patent when the compound patent remains in force has secured a legally valid but commercially weak extension. This selection error has cost multiple companies billions in unnecessarily early generic competition.
European SPCs are governed by Regulation (EC) No. 469/2009, which replaced the original 1992 regulation. An SPC is not an extension of an existing patent: it is a new intellectual property right, granted by each EU member state’s national patent office, that provides up to five additional years of exclusivity beyond the basic patent’s expiry. The SPC duration equals the period between the patent filing date and the first EU marketing authorization, minus five years, capped at five years. A six-month EU pediatric extension is also available for products that have completed an approved Paediatric Investigation Plan.
The CJEU’s 2018 decision in Teva UK Ltd. v. Gilead Sciences Inc. (C-121/17) materially narrowed the class of valid combination-product SPCs. The court held that a combination SPC is valid only if all active ingredients are specifically protected by the basic patent at the filing date — the ‘two hurdle’ test. Gilead’s SPC covering the tenofovir alafenamide and emtricitabine combination in its HIV drug Descovy was invalidated in multiple jurisdictions because the basic patent claimed only tenofovir alafenamide. Drug companies that had relied on similar combination SPCs across their portfolios faced sudden exclusivity gaps requiring urgent remediation, including litigation in multiple EU member states to protect revenues that had been modeled as secured.
The EU Unitary Patent, which became operational in June 2023 and covers 17 participating member states, has not yet been accompanied by a ‘unitary SPC.’ As of 2025, SPC reform proposals that would create a single EU-wide SPC attached to a unitary patent are under active legislative consideration. If adopted, a unitary SPC would eliminate the current country-by-country filing requirement and remove the risk of inconsistent validity rulings across jurisdictions. Until it passes, large pharmaceutical companies must manage SPCs in each member state separately — a process that costs several million euros annually for a major biologic with broad European exclusivity.
Drug (Brand)
Peak Annual Revenue
Est. Daily Revenue
PTE / SPC Duration
Estimated Protected Value
Legal Cost to Secure
Humira (adalimumab)
$21.2B (2022)
$58M/day
7 yrs (thicket)
~$148B est.
<$10M
Revlimid (lenalidomide)
$12.8B (2021)
$35M/day
5 yrs PTE + settlements
~$63.9B
<$5M
Keytruda (pembrolizumab)
$20.9B (2023)
$57M/day
Ongoing (2028+)
TBD (~$100B possible)
<$15M
Eliquis (apixaban)
$11.8B (2023)
$32M/day
~3 yrs PTE
$23B-$35B est.
<$5M
Lyrica (pregabalin)
$5.1B (peak)
$14M/day
4 yrs PTE + SPC
$20.4B est.
<$4M
Lipitor (atorvastatin)
$13.0B (peak)
$35.6M/day
~2 yrs PTE
$26.0B est.
<$3M
Ozempic/Wegovy (semaglutide)
$21B (2023)
$57.5M/day
Compound expires ~2026; PTE TBD
$50B-$100B possible
In progress
Note: Extension value estimates are approximations based on peak revenues multiplied by estimated exclusivity years. Legal cost estimates reflect total spend on PTE / SPC prosecution and defense; actual costs vary. Sources: Company annual reports, DrugPatentWatch [1], IQVIA [24], SEC filings.
Case Study: Humira — 247 Patents, $148 Billion in Protected Revenue
AbbVie’s adalimumab product Humira generated over $200 billion in cumulative global sales from its 2002 FDA approval through 2023. The compound patent on adalimumab expired in the United States in December 2016. Rather than accepting the revenue erosion that a single-patent strategy would have delivered, AbbVie executed a systematic patent expansion that DrugPatentWatch data characterizes as one of the densest patent clusters ever assembled around a single biologic product: 247 patent applications filed between 2000 and 2018 [23].
These patents covered incremental improvements to dosing devices, formulations, administration concentrations, and manufacturing processes. Each potentially contributed to the barrier that Humira biosimilar applicants faced under the BPCIA patent dance. By the time biosimilar sponsors had evaluated AbbVie’s patent portfolio and negotiated settlement agreements, U.S. biosimilar entry was delayed until January 2023 — seven years after the compound patent’s nominal expiry. At $20 billion in U.S. annual revenues, that seven-year delay represents approximately $140 billion in protected U.S. sales.
Humira IP Valuation as a Corporate Asset
AbbVie’s IP portfolio surrounding Humira is not just a legal matter; it functions as a balance sheet asset of extraordinary scale. The revenue protected by AbbVie’s patent thicket between 2017 and 2023 funded the company’s transformation from an Abbott spin-off dependent on a single product into a diversified pharmaceutical company with Rinvoq, Skyrizi, and multiple acquired oncology and aesthetics assets. The $63 billion Allergan acquisition in 2020, which diversified AbbVie’s revenue base, was financed in part by Humira exclusivity cash flows — cash flows that existed solely because of the patent expansion strategy executed between 2000 and 2018. The cost of prosecuting those 247 patents, even at $50,000 each, totals approximately $12.35 million. The revenue they protected exceeds $140 billion. No other corporate investment in history has produced a higher return on legal fees.
Case Study: Keytruda — The $100 Billion Exclusivity Question
Merck’s pembrolizumab product Keytruda is the world’s best-selling drug at $20.9 billion in 2023 global revenues [25]. Core patents begin expiring around 2028, with potential PTE and SPC protection extending into the early 2030s depending on which patents are extended and how the FDA-calculated regulatory review period is applied. If Keytruda maintains revenue above $20 billion annually through a four-to-five-year extension period, the protected revenue value of that exclusivity window approaches $100 billion.
Merck’s active IP strategy around Keytruda includes new indication patents that add method-of-treatment claims for each new cancer approval, formulation patents for subcutaneous delivery (approved by the FDA in 2024), and combination therapy patents with Lynparza (olaparib) and Lenvima (lenvatinib). The subcutaneous pembrolizumab formulation, as a new approved product, starts its own PTE clock, potentially creating a new five-year extension cycle beginning from the 2024 approval date. This stacking of indication and formulation patents on top of the compound patent creates a stepped exclusivity architecture that could keep Merck in a strong competitive position well into the 2030s.
Keytruda IP Valuation for Investors
The consensus analyst view of Keytruda treats its core patent expiry in 2028 as the revenue cliff. An investor who instead models the PTE-extended expiry, the pediatric exclusivity attachment, the subcutaneous formulation patent cycle, and the combination therapy patents will arrive at a materially different — and more valuable — revenue trajectory. At current sell-side consensus revenues of $25 billion in 2028, each additional year of PTE protection is worth approximately $7.5 billion in revenue to Merck. The difference between two years and five years of PTE protection represents $22.5 billion in revenue, or roughly $45 billion in present value at a standard pharma discount rate. This is not a rounding error in a Merck valuation model; it is the most important single variable in the company’s 10-year earnings forecast.
Case Study: Semaglutide — The Race to Lock In $100 Billion of GLP-1 Exclusivity
Novo Nordisk’s semaglutide products (Ozempic for type 2 diabetes, Wegovy for obesity, and Rybelsus as an oral formulation) generated approximately $21 billion in 2023 global revenues and are growing rapidly. The semaglutide compound patent expires in the United States in approximately 2026. Patent term extension claims based on the semaglutide regulatory review period are in process, with potential PTE protection extending to 2031 depending on which patents are extended and the final FDA review period calculation [26].
At $21 billion in 2023 revenues and an accelerating growth trajectory — analyst consensus projects $30+ billion by 2026 — the daily revenue rate at the compound expiry approaches $82 million. A full five-year PTE from 2026 would protect approximately $150 billion in semaglutide revenues from generic competition. The legal and strategic cost of securing and defending that PTE, including international SPC filings across 30+ jurisdictions, is unlikely to exceed $50 million in aggregate over five years. The return ratio is in the range of 3,000 to one on operating profit.
Eli Lilly’s competing GLP-1 assets — tirzepatide (Mounjaro for diabetes, Zepbound for obesity), approved in 2022 and 2023 — are on a parallel exclusivity trajectory. The patent race between Novo Nordisk and Eli Lilly to secure the most durable exclusivity position in the GLP-1 and GIP/GLP-1 categories will generate the defining pharmaceutical IP litigation of the late 2020s. Both companies are filing continuation applications, new indication patents for cardiovascular and metabolic outcomes, and device patents for pen injectors and potential wearable delivery systems. The annual legal spend on GLP-1 patent prosecution at both companies is already in the tens of millions and will scale sharply as generic manufacturers begin their Paragraph IV challenge planning for 2026 and beyond.
Part 7: The Evergreening Technology Roadmap — How Biologic IP Strategies Extend Exclusivity
Lifecycle Management Defined: The Full Tactical Menu
Pharmaceutical lifecycle management — sometimes called evergreening by critics — describes the practice of assembling a patent portfolio that extends effective market exclusivity beyond the term of the original compound patent. For small molecules, the standard toolkit includes polymorph patents, formulation patents, dosing regimen patents, and enantiomer patents. For biologics, the toolkit is broader and more technically complex, encompassing device patents for autoinjectors and prefilled syringes, manufacturing process patents tied to specific cell culture conditions, and combination therapy patents that cover the biologic used with a specific co-medication.
The 2025 USPTO fee schedule changes directly affect the economics of serial continuation strategies — the practice of filing continuation applications over many years to keep a patent family alive and introduce new claims as the competitive landscape evolves. The new surcharges of $2,700 (at six years) and $4,000 (at nine years) from the earliest priority date increase the cost of late-stage continuations. For a major biologic with 50 pending continuation applications, these surcharges can add $100,000 to $200,000 in additional filing costs per annual cycle of renewals. That is significant for a mid-size biotech, though still a rounding error for a company protecting $10 billion in annual revenues.
Tactic
What Gets Patented
Typical PTE / SPC Eligibility
Key Litigation Risk
Compound patent
The active ingredient itself
Full eligibility; most valuable
Prior art; composition claims
Polymorph patent
Crystalline form of active ingredient
Eligible if new form is the approved product
Anticipation by prior art forms
Formulation patent
Specific excipient combinations, concentrations
Eligible if new formulation is separately approved
Obviousness; design-around risk
Enantiomer / metabolite patent
Pure single stereoisomer of known racemate
Eligible; often high commercial value
Double patenting; prior art racemate
Dosing regimen patent
Specific dose, frequency, route of administration
Method-of-treatment; PTE-eligible under Novartis v. Ezra rule
Narrow scope; skinny labeling risk
Device / delivery patent
Autoinjector, inhaler, prefilled syringe design
Generally not PTE-eligible but blocks biosimilar devices
Design-around; narrow claims
Manufacturing process patent
Cell culture conditions, purification steps
PTE-eligible if approved product requires new process
Trade secret alternative may be stronger
Pediatric exclusivity
FDA-requested studies (BPCA/PREA)
Adds 6 months to all existing exclusivity
Must complete valid Written Request studies
Sources: 35 U.S.C. Section 156; Novartis AG v. Ezra Ventures LLC (Fed. Cir. 2019); Federal Trade Commission evergreening analyses [27]; DrugPatentWatch lifecycle management studies [1].
The Biologic Patent Thicket: Construction Costs and ROI
Building a patent thicket for a biologic drug requires sustained investment over the full product development and commercialization lifecycle. The initial compound patent typically covers the biologic’s primary amino acid sequence and is filed during discovery, often 10 to 15 years before market approval. The formulation patent portfolio is built during Phase II and III trials as the commercial presentation is finalized. Device patents are filed when the autoinjector or prefilled syringe design is locked in for the commercial product. Indication patents are filed with each new FDA approval as the drug’s label expands.
AbbVie filed Humira’s 247 patents over an 18-year period, a prosecutorial investment of approximately $12 million to $25 million in total attorney and filing fees. Bristol Myers Squibb’s Revlimid (lenalidomide) patent portfolio includes the compound patent, multiple method-of-treatment patents covering specific dosing regimens in myeloma, myelodysplastic syndromes, and mantle cell lymphoma, and several formulation patents on capsule presentations. Revlimid generated $12.8 billion in 2021 revenues [28]. The combined legal investment in the Revlimid patent portfolio across 20-plus years of prosecution is unlikely to exceed $30 million. The revenue it protected through the settlement-enhanced exclusivity period exceeded $50 billion.
The Pediatric Exclusivity Stacking: Six Months Worth Billions
The Best Pharmaceuticals for Children Act (BPCA) grants a six-month extension to all existing exclusivity periods — including any active PTE or data exclusivity — when a company completes FDA-requested pediatric studies. The six months applies to every exclusivity simultaneously, not to just one. For a drug with a PTE and a New Chemical Entity (NCE) data exclusivity period both active, completing the pediatric studies extends both by six months.
The cost of pediatric trials ranges from $10 million to $100 million depending on the indication, patient population, and number of studies requested. For a drug generating $10 billion annually, the six-month pediatric extension adds $5 billion in protected revenue. At a 30% operating margin, that is $1.5 billion in operating profit from a study investment of $10 million to $100 million. Critics at the Government Accountability Office and Harvard’s PORTAL program have documented cases in which pediatric extensions were granted for adult drugs with minimal pediatric use — citing cardiac drugs, erectile dysfunction medications, and antihypertensives. The economic incentive is too large to ignore regardless of clinical purpose, and rational companies pursue pediatric exclusivity for all drugs meeting the statutory criteria [29].
Key Takeaways: Section 7
• A complete biologic patent thicket across compound, formulation, device, manufacturing process, and indication patents requires $15 million to $30 million in cumulative prosecution investment over 15-20 years.
• The 2025 USPTO continuation surcharges increase the annual cost of maintaining late-stage patent families by $100,000 to $200,000 for large biologic portfolios.
• Pediatric exclusivity adds six months to all concurrent exclusivity periods simultaneously. For a $10 billion drug, that six months is worth $5 billion in revenue at a cost of $10-100 million in studies — one of the highest-ROI investments available to a pharma company.
• Dosing regimen patents are PTE-eligible under the Federal Circuit’s 2019 Novartis v. Ezra ruling, expanding the method-of-treatment patent toolkit beyond composition claims.
Part 8: ROI, Patent Cliffs, and the 2026-2030 Exclusivity Wave
The Patent Cliff Mechanism: How Quickly Revenue Disappears
When a drug’s final patent protection expires and generic or biosimilar competitors enter the market, prices and revenues fall with unusual speed. FDA data and academic analyses document price declines of 80 to 90 percent within 12 to 18 months of first generic entry, with market share erosion tracking the number of generic entrants [30]. Revenue losses on this scale can threaten the financial stability of companies with concentrated product portfolios. Pfizer’s revenues fell from $67.4 billion in 2010 to $58.5 billion in 2012 following Lipitor’s 2011 patent expiry. The patent cliff is one of the most predictable large stock price moves in equity markets.
The predictability creates opportunity on both sides. Sell-side analysts who correctly model PTE-extended expirations rather than nominal patent expiry dates produce materially more accurate earnings models. A company with three major drugs, each carrying a two-to-three-year PTE, has $6 to $9 years of additional protected revenue embedded in its pipeline that a nominal-expiry model completely misses. According to a 2024 Deloitte analysis, the projected ROI on pharmaceutical R&D recovered from 1.2% in 2022 to 5.9% in 2024, driven partly by high-value late-stage pipeline assets with clear exclusivity runways [31]. This recovery in ROI expectations directly reflects the value of properly extended exclusivity periods.
The 2026-2030 Patent Cliff: $200 Billion at Risk
IQVIA Institute projections identify approximately $200 billion in annual global drug revenues that will face patent expiry between 2026 and 2030 — the largest expiration wave in pharmaceutical history [24]. The scale reflects the cohort of blockbusters approved in the mid-2000s through early 2010s whose 20-year terms and PTEs are now running out simultaneously. Key assets in this cycle include Keytruda (pembrolizumab, core patents from 2028), Eliquis (apixaban, PTE-extended through approximately 2026 to 2028), Opdivo (nivolumab, from 2026), Xarelto (rivaroxaban, varying by jurisdiction), Jardiance (empagliflozin, with PTE protection), and Ozempic/Wegovy (semaglutide, compound expiry 2026 with PTE pending).
Each drug in this cohort has its own complex exclusivity architecture. Eliquis faces Paragraph IV challenges from Teva, Sandoz, and multiple other generic manufacturers with litigation ongoing in the U.S. District Court for the District of Delaware. A generic win in that litigation advances entry by several years and eliminates billions in PTE-protected revenue. Semaglutide’s compound patent expiry in 2026 is being partially offset by Novo Nordisk’s formulation patents, device patents for its FlexTouch and SteadyShot pens, and potential PTE claims — but the commercial calculation depends on how many formulation patents survive generic challenge and how aggressively Indian and Chinese API manufacturers enter the oral semaglutide space.
The GLP-1 Category: The Defining IP Battle of the Late 2020s
The GLP-1 agonist category — currently dominated by semaglutide (Novo Nordisk) and tirzepatide (Eli Lilly) — is growing fast enough that exclusivity decisions in the next five years will determine the revenue trajectories of two of the world’s five largest pharmaceutical companies well into the 2030s. Analyst consensus projects combined GLP-1 category revenues exceeding $100 billion annually by 2030. Whoever controls the exclusivity landscape at that revenue level controls the largest IP economic prize in the history of the pharmaceutical industry.
Both companies are executing parallel strategies: filing new indication patents as cardiovascular outcome data matures, securing device patents on next-generation delivery systems, and pursuing combination product approvals (cagrisema at Novo Nordisk; retatrutide and orforglipron at Lilly) that reset the patent clock on new molecular entities. Each new approval by either company creates a new PTE opportunity. Each new PTE extends the window during which the innovator captures nearly the entire revenue of the indication rather than sharing it with generic competition. The litigation costs of defending these positions, which will be contested aggressively by both companies against each other’s patents and by Indian, Chinese, and European generic manufacturers against both, will reach hundreds of millions of dollars over the next decade. That spending is rational: it protects a $100 billion annual market.
Cost-Saving Strategies for Mid-Size Biotechs
For companies without the legal budgets of AbbVie or Merck, rigorous cost discipline in patent prosecution can preserve capital for R&D while still securing commercially meaningful IP protection. Five tactics consistently reduce costs without sacrificing quality.
Provisional applications establish a 12-month priority date at a fraction of the cost of a full non-provisional filing, typically $2,000 to $10,000 in total for a complex pharmaceutical invention. That priority year allows the company to conduct further development, assess commercial potential, and refine claim strategy before committing to the full prosecution investment [32].
Focused portfolio management means concentrating prosecution resources on choke-point patents — composition of matter claims and primary method-of-treatment claims — rather than pursuing secondary formulation and device patents until commercial launch is confirmed. A startup that spends $200,000 on 10 secondary patents before Phase II data exists has not bought more protection; it has reduced the capital available for R&D.
Selective global filing requires disciplined market analysis before PCT national phase entry. The translation and local counsel cost for Japan, China, and South Korea combined approaches $25,000 to $35,000 per patent. Filing in all three jurisdictions before Phase III data exists is defensible only for drugs with a high probability of approval in indications that are prevalent across those markets. For rare diseases with primarily Western patient populations, Japan and China may be deferred until after U.S. approval.
Competitive intelligence from platforms like DrugPatentWatch reduces the cost of patent searching, competitor monitoring, and freedom-to-operate analysis by centralizing data that would otherwise require subscriptions to dozens of individual national patent office databases. For a mid-size biotech spending $500,000 annually on external IP counsel, a $50,000 subscription to a comprehensive patent intelligence platform can reduce redundant attorney search time by a measurable percentage of that annual spend [1].
Key Takeaways: Section 8
• IQVIA projects $200 billion in annual global drug revenues will face patent expiry between 2026 and 2030, the largest pharmaceutical patent cliff in history.
• GLP-1 category revenues are projected to exceed $100 billion annually by 2030. The patent and PTE battles over semaglutide and tirzepatide will generate the most financially consequential IP litigation of the late 2020s.
• Deloitte’s 2024 analysis found pharmaceutical R&D ROI recovering to 5.9%, driven by high-value late-stage pipeline assets with clear exclusivity runways.
• For mid-size biotechs, provisional applications, selective global filing, and patent intelligence tools are the three highest-ROI cost management tactics in IP prosecution.
Part 9: Investment Strategy Framework — Patent-Adjusted Pharmaceutical Valuation
Translating Patent Data into Price Targets
A comprehensive pharmaceutical equity valuation model has three exclusivity layers that interact to determine the revenue trajectory of each major asset. The first layer is the nominal patent expiry date from the Orange Book or Purple Book. The second is the PTE-adjusted expiry, which adds the extension period to the nominal date and is the operationally correct date for modeling the start of generic competition. The third is the IRA negotiation overlay, which caps price realization at the negotiated price for Medicare-covered patients starting at year 7 (small molecules) or year 11 (biologics) post-approval.
Each layer is independently important and the three interact. A small-molecule drug that reaches IRA negotiation eligibility in year 7 while still under PTE protection faces government price pressure concurrent with its extended exclusivity. The revenue model must apply both the IRA negotiated price to the Medicare-covered fraction of demand and the branded price to the commercial and Medicaid fractions, producing a blended net price that is lower than peak branded pricing but higher than post-generic entry pricing. Analysts who apply a single price assumption throughout the PTE period will materially overstate revenues for high-Medicare-share drugs in this simultaneous PTE-IRA overlap scenario.
Metric
What to Measure
Red Flags
Days of exclusivity remaining
PTE-adjusted expiry date vs. nominal patent expiry
Analyst consensus using nominal date = undervaluation opportunity
Patent density per drug
Number of Orange / Purple Book patents per product
Single-patent products face binary cliff risk
Paragraph IV exposure
Active Paragraph IV certifications against portfolio
Multiple concurrent filings signal imminent challenge
IPR petition rate
PTAB petitions filed against company patents per year
Country-by-country SPC expiry dates for top-5 EU markets
Mismatch vs. U.S. PTE = geographic revenue timing risk
Pay-for-delay exposure
Reverse payment settlements disclosed in SEC filings
FTC active investigation = settlement unwind risk
Sources: DrugPatentWatch [1]; AIPLA survey data [4]; USPTO PTE grant data [5]; FTC pay-for-delay reports [27].
Using DrugPatentWatch in Financial Analysis
DrugPatentWatch consolidates patent expiration data, PTE grants, SPC filings across European jurisdictions, Paragraph IV certifications, ANDA filing dates, PTAB petition histories, and Orange and Purple Book listings into a searchable database that provides a unified view of the exclusivity landscape for any drug [1]. For sell-side analysts, this data eliminates the need to manually monitor the USPTO, FDA databases, EPO, and individual national patent registries — a process that previously required significant attorney time or multiple platform subscriptions.
Specific workflows where DrugPatentWatch adds direct financial modeling value include: identifying PTE-adjusted expiry dates for portfolio company drugs not yet reflected in consensus models; monitoring Paragraph IV certifications that signal imminent generic entry earlier than consensus assumes; tracking PTAB petition activity against key portfolio patents as a leading indicator of patent validity risk; and identifying SPC expiry mismatches between U.S. and European exclusivity timelines that affect international revenue modeling.
The M&A Patent Calculus: Buying PTEs at Scale
Pharmaceutical M&A frequently targets PTE-protected assets because the financial logic is direct. A drug generating $5 billion annually with four years of PTE remaining has approximately $20 billion in remaining protected revenue. At a 40% operating margin, that is $8 billion in remaining protected operating profit. An acquirer who pays $12 billion for the asset — a 50% premium to protected operating profit — is making a bet on the pipeline beyond the PTE cliff to justify the balance of the purchase price. Every major pharmaceutical acquisition of the past decade has required this analysis.
Bristol Myers Squibb’s $74 billion acquisition of Celgene in 2019 was structured around Revlimid’s remaining exclusivity and the Celgene oncology pipeline. The Revlimid component of the acquisition value was estimated by deal analysts at $35 billion to $45 billion at signing. AbbVie’s $63 billion Allergan acquisition diversified away from Humira’s impending biosimilar cliff while adding aesthetics and eye care assets with independent exclusivity periods. Johnson & Johnson’s $30 billion Actelion acquisition in 2017 purchased pulmonary arterial hypertension drugs including macitentan (Opsumit) and selexipag (Uptravi), both with substantial remaining patent coverage. In each case, the IP-adjusted valuation — incorporating PTE dates, SPC coverage, and litigation risk — was the primary driver of price negotiation.
Key Takeaways: Section 9
• A complete pharmaceutical equity model requires three distinct layers: nominal patent expiry, PTE-adjusted expiry, and the IRA negotiation date, with a blended price assumption when the PTE and IRA periods overlap.
• PTAB petition activity is a leading indicator of patent validity risk and can move a revenue model by years and a stock valuation by double digits before any litigation outcome is resolved.
• Major pharmaceutical M&A transactions are anchored in PTE-adjusted valuation models. Paying for assets beyond the PTE cliff requires confidence in pipeline replacement revenue.
• DrugPatentWatch provides the data integration that makes IP-adjusted financial modeling tractable for teams without dedicated IP counsel — consolidating Orange Book, Purple Book, PTE, SPC, Para IV, and PTAB data in a single searchable interface.
Master Key Takeaways: The Full Cost and Value of a Drug Patent
The following points consolidate the key analytical conclusions across all nine sections of this report:
• Patent filing fees of $10,000 to $50,000 represent the visible portion of a cost structure that includes billions in capitalized R&D, multi-year international prosecution, and potential eight-figure litigation defense costs.
• The Tufts CSDD capitalized figure of $2.6 billion per approved drug accounts for the cost of failures and the time value of capital tied up during a 10-to-15-year development timeline. Out-of-pocket spending alone understates the true economic investment.
• Biologics cost $900 million more to develop than small molecules on median but generate twice the peak annual revenue and take 8 years longer for competing products to reach market, producing a fundamentally different ROI profile.
• The IRA’s differential Medicare negotiation windows — 7 years for small molecules, 11 years for biologics — have permanently shifted R&D portfolio incentives toward biologic programs. This legislative change is a multi-billion-dollar variable in long-range pipeline valuation.
• The 2025 USPTO fee changes introduce targeted surcharges of $2,700 and $4,000 for late continuation filings that directly increase the cost of patent thicket construction strategies. IP teams must remodel continuation filing schedules against the new cost structure.
• PTE application costs of $50,000 to $150,000 protect billions in operating profit, producing return ratios of 10,000:1 or higher for major blockbusters. No other legal instrument in pharmaceutical commerce produces a comparable return.
• Translation into non-English languages is the most consistently underestimated cost in global patent prosecution, often exceeding $35,000 per application across a full international filing program.
• IPR petitions invalidate at least one claim in 45-50% of instituted proceedings. All PTE-extended patents with material revenue exposure require active PTAB monitoring as part of standard IP portfolio management.
• IQVIA projects $200 billion in annual global drug revenues will face patent expiry between 2026 and 2030. The GLP-1 category — Novo Nordisk semaglutide and Eli Lilly tirzepatide — represents the single largest IP economic contest of the period.
• A complete pharmaceutical equity model uses three exclusivity layers: nominal patent expiry, PTE-adjusted expiry, and the IRA negotiation overlay. Analysts who apply only the nominal date will systematically undervalue companies with strong PTE portfolios.
• Patent intelligence platforms including DrugPatentWatch consolidate Orange Book, Purple Book, PTE, SPC, Paragraph IV, and PTAB data in formats directly usable by IP teams, R&D allocators, and financial analysts, reducing the research cost of building complete exclusivity models.
FAQ
1. What is the single most financially consequential procedural deadline in pharmaceutical patent law?
The 60-day window to file a PTE application after FDA approval, under 35 U.S.C. Section 156(d)(1), is almost certainly the most consequential. It is absolute: missing it by one day permanently forfeits the extension, regardless of the drug’s revenue or the reason for the delay. For a drug generating $10 billion annually, the forfeited PTE could represent $20 billion to $50 billion in protected revenues. The 60-day window requires companies to begin preparing their PTE application before FDA approval arrives, not after. The practical protocol is to identify the extension-eligible patent and prepare the PTE application packet as part of NDA/BLA submission preparation, then file within 48 hours of receiving approval. Companies that treat PTE preparation as a post-approval task consistently lose extensions to administrative oversight.
2. How much does it actually cost to build and defend a patent thicket like Humira’s?
Based on available data, AbbVie prosecuted approximately 247 Humira-related patents between 2000 and 2018. At an average prosecution cost of $50,000 per patent (covering filing, prosecution through issuance, and annual maintenance), the total prosecutorial investment runs approximately $12.35 million. Defense of those patents against biosimilar challengers under the BPCIA patent dance, including litigation costs across multiple federal courts and potential PTAB proceedings, likely added $100 million to $300 million in aggregate legal fees over the multi-year exclusivity defense period. Against $140 billion in U.S. revenues protected by that defense — revenues that would have begun eroding in 2017 without the thicket — the total legal investment represents less than 0.3% of protected revenue. The cost-benefit analysis for patent thicket construction at this revenue level is overwhelmingly positive. The policy question of whether such tactics are socially optimal is separate from the financial question of whether they are strategically rational for the company.
3. How does the Inflation Reduction Act change the value calculation for a PTE on a high-Medicare-share drug?
The IRA’s Medicare price negotiation program allows CMS to negotiate prices for drugs that have been on the market for more than 9 years (small molecules) or 13 years (biologics) without generic or biosimilar competition. A PTE that extends exclusivity keeps generic competition at bay, so the IRA negotiation clock runs concurrently with the PTE protection period. A small-molecule drug approved in 2017 with a three-year PTE running from 2026 to 2029 reaches IRA negotiation eligibility in 2026 — the same year its PTE begins. During that overlap period, the drug remains patent-protected against generic entry but is simultaneously subject to government price negotiation for Medicare Part D and Part B purchases. For a drug with 60% Medicare payer mix, the negotiated price applies to more than half of its volume while the brand price applies to the remainder. Companies must now model PTE revenue as a function of both the protected period length and the Medicare fraction of demand discounted by the expected negotiation outcome. Pre-IRA models that applied peak branded pricing throughout the PTE period overstate revenues for Medicare-heavy indications by a material amount.
4. What are the most common errors companies make in selecting which patent to extend under a PTE application?
Three errors account for most commercially significant PTE selection mistakes. First, selecting a manufacturing process patent when a compound patent or method-of-treatment patent is available. Process patents can be extended and provide some barrier, but they are narrower and more easily designed around than compound patents. Generic manufacturers can reformulate the manufacturing process while maintaining the active ingredient, potentially avoiding infringement on an extended process patent. Second, selecting the patent with the longest remaining term rather than the patent with the highest commercial relevance to the specific approved product. A longer-lived secondary patent extended by a smaller PTE may produce a later final expiry date than a core compound patent extended by a larger PTE, but the core compound patent typically provides broader protection. Third, failing to verify that the patent as issued covers the approved product as approved. The USPTO and FDA have rejected PTE applications where the selected patent’s claims, read literally, did not encompass the specific approved formulation or indication.
5. For an institutional investor building a pharmaceutical equity model, what are the three most important patent data inputs and where do you get them?
The three most important inputs are the PTE-adjusted expiry date for each major drug (not the nominal patent expiry), the active Paragraph IV certification count and filing dates for each drug, and the PTAB petition history for each key patent in the portfolio. The PTE-adjusted expiry date is the correct date for modeling the onset of generic competition. The Paragraph IV certification count and filing dates signal how close and how organized the generic challenge is. PTAB petition history — particularly whether any petition has been instituted against a PTE-extended patent — is the best leading indicator of whether the exclusivity timeline will hold. All three data points are available from the USPTO, FDA Orange Book, and PTAB databases individually, or consolidated in pharmaceutical patent intelligence platforms like DrugPatentWatch, which aggregates them alongside SPC filings across European jurisdictions, ANDA submission dates, and litigation outcomes into a single searchable interface. For an analyst team covering five or more pharmaceutical companies, the time savings and data accuracy improvements from using an integrated platform versus manual database monitoring justify the subscription cost within the first month of use.
References
[1] DrugPatentWatch. (2025). How much does a drug patent cost? A comprehensive guide to pharmaceutical patent expenses. https://www.drugpatentwatch.com/blog/how-much-does-a-drug-patent-cost-a-comprehensive-guide-to-pharmaceutical-patent-expenses
[2] DrugPatentWatch. (2025). Managing drug patent litigation costs. https://www.drugpatentwatch.com/blog/managing-drug-patent-litigation-costs
[3] Tufts Center for the Study of Drug Development. (2016). Cost of developing a new drug. Tufts University. https://csdd.tufts.edu/csdd-briefing-notes-2014-q4
[4] American Intellectual Property Law Association. (2023). Report of the economic survey. AIPLA. https://www.aipla.org/home/news-publications/economic-survey/2023-report-of-the-economic-survey
[5] U.S. Patent and Trademark Office. (2025). USPTO fee schedule, effective January 19, 2025. https://www.uspto.gov/learning-and-resources/fees-and-payment/uspto-fee-schedule
[6] U.S. Food and Drug Administration. (2024). New drug therapy approvals 2023. Center for Drug Evaluation and Research. https://www.fda.gov/drugs/new-drugs-fda-cders-new-molecular-entities-and-new-therapeutic-biological-products
[7] Doctors Without Borders. (2014). MSF response to Tufts CSDD study on cost to develop a new drug. https://www.doctorswithoutborders.org/latest/rd-cost-estimates-msf-response-tufts-csdd-study-cost-develop-new-drug
[8] PhRMA. (2022). PhRMA member companies’ R&D investments reach record high of $102.3 billion in 2021. https://phrma.org/blog/phrma-member-companies-rd-investments-reach-record-high-of-1023-billion-in-2021
[9] USC Schaeffer Center. (2021). Analysis finds meaningful impact on pharmaceutical innovation from reduced revenues. https://schaeffer.usc.edu/research/pharmaceutical-innovation-revenues-drug-prices
[10] Wouters, O. J., et al. (2024). Differential legal protections for biologics vs. small-molecule drugs in the U.S. Unpublished manuscript, LSE Research Online. https://eprints.lse.ac.uk/126180/1/2024.08.03_manuscript.pdf
[11] Fish & Richardson. (2025). New USPTO patent fees go into effect January 19, 2025. https://www.fr.com/insights/thought-leadership/blogs/new-uspto-patent-fees-go-into-effect-january-19-2025
[12] Foley & Lardner. (2024). USPTO publishes final fees for 2025. https://www.foley.com/insights/publications/2024/11/uspto-publishes-final-fees-2025
[13] TT Consultants. (2024). Responding to USPTO office actions in patent filing. https://ttconsultants.com/how-to-respond-to-uspto-office-actions-during-patent-filing
[14] Congressional Budget Office. (2021). Research and development in the pharmaceutical industry. https://www.cbo.gov/publication/57126
[15] World Intellectual Property Organization. (2025). PCT fees and payments. https://www.wipo.int/en/web/pct-system/fees/index
[16] U.S. Patent and Trademark Office. (2025). PCT fees in U.S. dollars. https://www.uspto.gov/patents/basics/international-protection/patent-cooperation-treaty/pct-fees-us-dollars
[17] Fillun. (2024). European patent application timeline with expected costs. https://www.fillun.com/european-patent-application-timeline-with-expected-costs
[18] Boehmert & Partner. (2024). European Patent Office fee increase as of April 1, 2024. https://www.boehmert.de/en/fee-increase-by-epo
[19] Origami Patent Firm. (2025). How much does it cost to file a patent in Japan? https://origamipatentfirm.com/2025/07/15/how-much-does-it-cost-to-file-a-patent-in-japan
[20] China National Intellectual Property Administration. (2024). Patent government fees. https://english.cnipa.gov.cn/col/col3000/index.html
[22] Docket Navigator. (2023). Patent litigation analytics: PTAB final written decisions 2013-2023. https://www.docketnavigator.com
[23] Federal Trade Commission. (2020). Biologics and biosimilars: an overview of the regulatory landscape. FTC Bureau of Competition. https://www.ftc.gov/reports/biologics-biosimilars
[24] IQVIA Institute for Human Data Science. (2023). The use of medicines in the U.S. 2023. https://www.iqvia.com/insights/the-iqvia-institute/reports-and-publications/reports/the-use-of-medicines-in-the-us-2023
[25] Merck & Co., Inc. (2024). 2023 annual report. https://www.merck.com/investor-relations/financials/annual-report
[26] Novo Nordisk A/S. (2024). 2023 annual report. https://www.novonordisk.com/investors/annual-report.html
[27] Federal Trade Commission. (2021). Agreements filed with the FTC under the Medicare Prescription Drug Improvement and Modernization Act of 2003: overview of agreements filed in FY2020. https://www.ftc.gov/reports/mma-agreements
[29] Government Accountability Office. (2019). Drug industry: profits, research and development spending, and merger and acquisition deals. GAO-18-40. https://www.gao.gov/products/gao-18-40
[30] U.S. Food and Drug Administration. (2023). Generic competition and drug prices. https://www.fda.gov/about-fda/center-drug-evaluation-and-research-cder/generic-competition-and-drug-prices
[31] Deloitte. (2024). Measuring the return from pharmaceutical innovation 2024. https://www.deloitte.com/us/en/Industries/life-sciences-health-care/articles/measuring-return-from-pharmaceutical-innovation.html
[32] DrugPatentWatch. (2024). Filing strategies for maximizing pharma patents: a comprehensive guide for business professionals. https://www.drugpatentwatch.com/blog/filing-strategies-for-maximizing-pharma-patents