Executive Summary: The New Economic Reality of Drug Manufacturing
The pharmaceutical supply chain is currently navigating a period of unprecedented structural volatility. As we settle into 2025, the simplistic days of selecting a Contract Development and Manufacturing Organization (CDMO) based solely on the lowest Request for Proposal (RFP) bid are unequivocally over. The industry is grappling with a convergence of macroeconomic and geopolitical forces that have fundamentally altered the pricing calculus for drug development and commercial manufacturing.
For the modern biopharmaceutical executive—whether sitting in a C-suite in Cambridge, Massachusetts, or managing procurement in Basel, Switzerland—understanding CDMO pricing now requires a mastery of multidimensional risk. We are witnessing a market defined by stark contradictions: a “funding winter” that has starved early-stage biotech of capital, juxtaposed against an explosive, insatiable demand for GLP-1 agonists that is consuming global sterile fill-finish capacity at a voracious rate. Simultaneously, the geopolitical fracturing epitomized by the U.S. BIOSECURE Act is forcing a costly decoupling of Western supply chains from Chinese service providers, introducing a “geopolitical premium” to every contract negotiated in 2025.
This report serves as a definitive, exhaustive guide to the economics of outsourcing in this new era. We move beyond the surface-level metrics of Full-Time Equivalent (FTE) rates and Fee-for-Service (FFS) batches to expose the hidden architecture of CDMO pricing. We dissect the total cost of ownership (TCO) across modalities—from the commoditized efficiency of small molecules to the yield-sensitive world of biologics and the capacity-constrained frontier of cell and gene therapy.
Furthermore, we explore how astute leaders are turning to competitive intelligence platforms like DrugPatentWatch to regain leverage in negotiations, using patent data not just for legal compliance, but as a strategic asset to predict capacity crunches and identify manufacturing “white space.”
Industry Insight: “For a CDMO… [the patent cliff] is not a precipice to be feared, but a goldmine of opportunity to be excavated.” — DrugPatentWatch1
The following analysis is designed for the skepticism of the experienced industry veteran. It eschews hype in favor of hard data, legal realities, and actionable strategies for turning the CDMO relationship from a cost center into a competitive advantage.
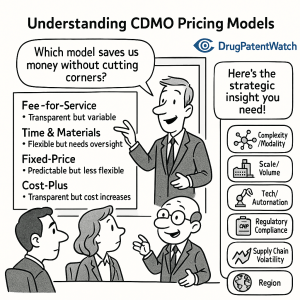
1. The Strategic Architecture of Pricing Models
In the high-stakes poker game of pharmaceutical outsourcing, the pricing model you choose is the single most important indicator of how risk is allocated between the Sponsor (the drug developer) and the CDMO. In 2025, the binary choice between “paying for time” and “paying for tasks” has evolved into a spectrum of risk-sharing structures designed to align incentives in an increasingly uncertain scientific environment.
1.1 Fee-for-Service (FFS): The Transactional Illusion of Safety
The Fee-for-Service (FFS) model remains the standard for late-stage clinical and commercial manufacturing. On paper, it offers the seductive promise of budget predictability: a fixed price for a defined output, such as “three GMP batches of Compound X” or “one stability study protocol.”
The Mechanism of FFS:
Under an FFS arrangement, the CDMO prices the project based on a detailed Scope of Work (SOW). They estimate the raw materials, labor hours, equipment usage, and overhead required to deliver the specific task. The client pays this fixed sum, often in tranches triggered by milestones (e.g., 30% upon signing, 30% upon material release, 40% upon final report).2
The Hidden Risk Premium:
While FFS appears to transfer risk to the CDMO—since they must absorb the cost of overruns if they work inefficiently—experienced procurement officers know that CDMOs are not in the business of losing money. To protect themselves, CDMOs bake a significant “risk premium” into the fixed fee. If a process is estimated to take 100 hours, the FFS quote might price in 130 hours to cushion against unforeseen scientific hurdles. Therefore, in a best-case scenario where the project runs smoothly, the client effectively overpays for insurance they didn’t need.2
The “Change Order” Trap:
The greatest downside of FFS in a dynamic R&D environment is its rigidity. The moment a Sponsor needs to deviate from the SOW—perhaps due to a new regulatory requirement or a shift in clinical strategy—the FFS contract becomes a liability. The “Change Order” process is notoriously slow and costly. CDMOs often use change orders as a profit lever, charging premium rates for out-of-scope work. In complex biologic projects, it is not uncommon for change orders to inflate the initial budget by 20% to 30% and introduce weeks of administrative delay while legal teams redline amendments.2
1.2 Full-Time Equivalent (FTE): The “Rent-a-Scientist” Approach
The FTE model is the dominant structure for early-stage discovery, medicinal chemistry, and process development. Here, the commodity being purchased is not a “result,” but “effort.”
The Mechanism of FTE:
The client pays a flat rate for a dedicated team of scientists and engineers for a specified period (e.g., $350,000 per year per scientist). This team functions as an extension of the client’s internal R&D department.
The Flexibility Dividend:
The primary value proposition of the FTE model is agility. In early Phase I/II development, scientific data changes daily. A synthesis route that looked promising on Monday might be abandoned by Thursday. In an FTE model, the Sponsor can redirect the team instantly without triggering a contract amendment. This “pivot speed” is invaluable for biotechs racing against a cash runway.2
The Productivity Risk:
The trade-off is that the client assumes the risk of productivity. If the chemistry fails, or if the CDMO’s team is inefficient, the client still pays for the hours worked. There is no guarantee of a deliverable. This model requires intense management oversight to ensure the “rented” scientists are working as hard as internal employees.2
1.3 Milestone and Risk-Sharing Models: The “Netflix Plus” Era
As the relationship between big pharma and CDMOs matures, we are seeing the emergence of value-based pricing models that attempt to break the “time vs. task” dichotomy.
The “Netflix Plus” Model:
Particularly relevant for antibiotics and niche markets where volume doesn’t guarantee profit, this model involves a subscription-style payment that delinks revenue from sales volume. It serves as a “pull incentive” for CDMOs to maintain capacity for critical but low-margin drugs.3
Milestone-Based Incentives:
In this structure, the CDMO accepts a lower base fee (covering only direct costs) in exchange for significant “success fees” tied to high-value outcomes—such as successful technology transfer, achieving a specific yield target, or regulatory approval. This aligns the CDMO’s profit motive with the Sponsor’s commercial success.4
Table 1: Comparative Analysis of Pricing Architectures
Feature
Fee-for-Service (FFS)
Full-Time Equivalent (FTE)
Risk-Share / Milestone
Primary Metric
Deliverables (Tasks/Batches)
Time (Hours/Days)
Outcomes (Yield/Approvals)
Budget Predictability
High (Fixed upfront)
Medium (Fixed rate, variable duration)
Low (Variable success fees)
Flexibility
Low (Rigid Scope, costly changes)
High (Pivot instantly)
Medium (Defined metrics)
IP Ownership
Client retains 100%
Client retains 100%
Often shared or licensed
Risk Allocation
CDMO bears execution risk
Client bears productivity risk
Shared commercial risk
Ideal Phase
Phase III / Commercial
Discovery / Pre-clinical / Phase I
Strategic Partnerships
2. Modality-Specific Economics: From Commodities to Rare Earths
To speak of “CDMO pricing” as a monolith is a fallacy. The economic drivers for manufacturing a small molecule generic are fundamentally different from those governing a cell therapy. We must bifurcate the market into its constituent modalities to understand the true cost drivers.
2.1 Small Molecules: The Volume and Efficiency Game
Despite the breathless media coverage of biologics, small molecules continue to account for the vast majority of global prescription volume. This segment is characterized by mature technology and intense price competition.
The Cost Advantage:
Developing a small molecule drug is, on average, 25% to 40% less expensive than developing a new biologic.5 This discount stems from the deterministic nature of chemical synthesis—reactions are predictable, scalable, and do not require the fickle biological systems that drive large molecule production.
Manufacturing Economics:
For small molecules, the cost of goods sold (COGS) is heavily influenced by the price of the Active Pharmaceutical Ingredient (API) and the scale of production.
Generics: In the generic space, manufacturing efficiency is everything. Margins are razor-thin, and CDMOs compete on fractions of a cent per tablet.
Innovator Drugs: For patented small molecules, manufacturing costs are a negligible fraction of the final sales price. For example, the aggregate Incremental Cost-Effectiveness Ratio (ICER) for a small molecule like arsenic trioxide is roughly $307, compared to millions for comparable biologics.6 This allows CDMOs to charge a premium for “white glove” service and reliability without significantly impacting the Sponsor’s margins.
2.2 Biologics (Monoclonal Antibodies): The Yield Game
Biologics, particularly monoclonal antibodies (mAbs), represent the current profit engine of the industry.
Revenue Potential: By Year 9 of a product’s life, biologics generate a median economic value of $4.3 billion, compared to just $2.4 billion for small molecules.7 This massive revenue potential justifies higher CDMO fees.
The Yield Lever: In biologics, “titer” (the amount of product produced per liter of bioreactor volume) is king. A CDMO that can optimize a cell line to increase titer from 2 g/L to 5 g/L effectively cuts the COGS in half. Consequently, pricing in biologics often includes premiums for process development capabilities that promise higher yields.
Cost Structure: Unlike small molecules, where raw materials dominate, biologics costs are driven by the facility itself—the massive depreciation of stainless steel bioreactors, the cost of Water for Injection (WFI) systems, and the army of Quality Assurance (QA) personnel required to maintain sterility.
2.3 Cell & Gene Therapy (CGT): The Capacity Conundrum
The Cell and Gene Therapy sector is the most volatile pricing environment in 2025.
Growth Trajectory: The market is projected to grow at a staggering CAGR of ~28% through 2034, reaching nearly $89 billion.8
The Current Paradox: Despite long-term growth, the sector is currently suffering from a “funding winter.” Many early-stage biotechs have paused programs, leading to a temporary underutilization of CGT capacity.9
The DNA Bottleneck: Surprisingly, the biggest pricing pressure in CGT often comes not from the bioreactors, but from the upstream supply of high-quality GMP plasmid DNA.9 This raw material is the “software” that programs the viral vectors, and shortages here can stall entire manufacturing campaigns.
Pricing Volatility: Because CGT manufacturing is often autologous (one batch = one patient), it does not benefit from economies of scale. Prices are quoted per-patient or per-run, often ranging from $100,000 to $500,000 per batch, making it the most expensive modality by far.
Table 2: Cost Structure Breakdown by Modality
Cost Component
Small Molecule
Biologics (mAbs)
Cell & Gene Therapy (Auto)
Raw Materials
20% – 30% (API driven)
15% – 25% (Media/Resins)
40% – 50% (Plasmids/Vectors)
Labor
15% – 20%
25% – 30%
40% – 50% (Highly Manual)
QA/QC & Release
10% – 15%
20% – 25%
25% – 35% (Complex Assays)
Facility/Overhead
25% – 30%
30% – 40%
30% – 40% (Cleanroom premium)
Market Trend
Commoditized / Efficient
High Value / Yield Focus
Volatile / Capacity Constrained
3. The Geopolitical Premium: BIOSECURE and the Cost of Decoupling
In 2025, geography is no longer just about logistics; it is about political survival. The U.S. BIOSECURE Act has landed like a meteorite in the center of the CDMO landscape, forcing a rapid and expensive restructuring of global supply chains.
3.1 The BIOSECURE Act Explained
The Act prohibits U.S. federal agencies (and by extension, companies relying on Medicare/Medicaid revenue) from contracting with “biotechnology companies of concern.” The legislation explicitly names Chinese industry titans such as WuXi AppTec and WuXi Biologics.10
The Scope: This is not a minor inconvenience. Approximately 120 U.S. drugs currently rely on Chinese CDMOs for their manufacturing.10
The Grandfather Clause: To prevent immediate drug shortages, the Act includes a “grandfather” provision allowing existing contracts to remain valid until 2032.11
3.2 The Financial Impact of Decoupling
While the grandfather clause provides a runway, the market is already pricing in the decoupling.
The “China Discount” Evaporates: Historically, Chinese CDMOs offered rates 30-50% lower than Western counterparts.12 As U.S. companies flee these providers, this deflationary pressure on the market is disappearing.
The “Western Premium”: As demand shifts back to U.S. and European CDMOs, capacity in compliant regions is tightening. We are seeing a surge in pricing for Western-based assets, with some analysts predicting FTE rate increases of 10-15% in North America as capacity utilization hits ceilings.
The “Lame Duck” Cost: Companies utilizing the grandfather clause face a unique financial burden: the cost of dual sourcing. To mitigate risk, they must continue paying their Chinese legacy partners while simultaneously funding the massive Tech Transfer fees (discussed in Section 5) to validate a new, non-Chinese supplier.
3.3 The Tariff War
Beyond BIOSECURE, the broader trade war is introducing direct costs. The threat of reciprocal tariffs—potentially up to 145% on Chinese goods—is a Sword of Damocles hanging over the industry.13 CDMOs are increasingly inserting “Tariff Pass-Through” clauses in their Master Services Agreements (MSAs), ensuring that any new border taxes are paid directly by the client, further inflating the Total Cost of Ownership.
4. The GLP-1 Black Hole: A Crisis of Fill-Finish Capacity
If BIOSECURE is the political shock of 2025, the rise of GLP-1 agonists (such as semaglutide and tirzepatide) is the commercial shock. These drugs, used for diabetes and obesity, have created a demand vortex that is distorting the entire global CDMO market.
4.1 The Scale of Demand
The numbers are staggering. The global market for GLP-1 drugs is projected to reach $157 billion by 2030.9 This is not just a blockbuster; it is a mega-trend comparable to the rise of statins, but with a much more complex manufacturing requirement: sterile injectable fill-finish.
4.2 The Novo Holdings-Catalent Deal
The defining moment of this trend was Novo Holdings’ $16.5 billion acquisition of Catalent.14
The Strategy: Novo Nordisk effectively bought the world’s largest independent CDMO to secure capacity for itself. The deal involves selling three massive Catalent sites (Anagni, Bloomington, and Brussels) directly to Novo Nordisk.
The Market Impact: This transaction removes significant sterile fill-finish capacity from the open market. Small and mid-sized biotech companies that relied on Catalent for their injectable products are now finding themselves crowded out.
4.3 The Pricing Ripple Effect
The “GLP-1 Effect” has created a seller’s market for sterile manufacturing.
Capacity Auction: With major lines booked for obesity drugs, “available slots” for other injectables are becoming scarce. CDMOs can now demand higher reservation fees, longer committed terms, and higher per-unit prices for sterile fill-finish services.
CapEx Response: The industry is responding with massive capital investment. CordenPharma, for instance, has pledged €900 million to expand peptide and injectable capacity in Europe and the U.S..16 However, building and validating sterile facilities takes 3 to 5 years. Until this new capacity comes online (likely 2027-2028), pricing for sterile manufacturing will remain elevated.
5. Hidden Costs: The Iceberg Beneath the Invoice
The most dangerous line item in a CDMO budget is the one you didn’t see coming. Experienced procurement teams know that the “sticker price” in a proposal often represents only 60-70% of the final invoice. The rest is comprised of “hidden” costs that can derail a project’s P&L.
5.1 The Technology Transfer Tax
Moving a pharmaceutical process from one facility to another is not a simple “copy-paste” operation. It is a forensic scientific reconstruction.
The Cost: A standard technology transfer for a biologic drug can cost between $2 million and $5 million.17
The Components: This fee covers analytical method transfer (validating that the new lab gets the same results as the old one), engineering runs (practice batches), and Process Performance Qualification (PPQ) batches.
The Time: It takes time—18 to 30 months.18 McKinsey data indicates that external tech transfers increase lead times by 5.8 months compared to internal transfers.18 This “time tax” delays revenue generation, a cost often far greater than the transfer fee itself.
5.2 Raw Material Markups
CDMOs often function as procurement agents, buying raw materials on behalf of the client.
The Markup: Standard industry practice is to charge a 15% to 25% markup on these pass-through costs.19
The Hidden Fee: Some CDMOs also charge “handling fees” for bringing client-supplied API into their warehouse. If a client supplies $10 million worth of API, a 2% handling fee is a $200,000 charge for simply moving a pallet from a truck to a shelf.
5.3 Stability Storage: The Silent Accumulator
Stability testing is mandatory, boring, and expensive.
The Rate: Storage is often quoted at seemingly low rates, such as $1 per month per cubic foot or per sample.20
The Accumulation: A 5-year stability study with multiple conditions (25°C/60%RH, 40°C/75%RH, -20°C) involves thousands of pull-points and tests. Over five years, these “small” monthly fees accumulate into hundreds of thousands of dollars.
The Exit Fee: The real sting comes if you try to leave. CDMOs often charge exorbitant “retrieval, packaging, and documentation” fees to transfer stability samples to a new vendor.
5.4 The “Shadow Team” of Offshore Management
Outsourcing to a low-cost region (like India or China) saves on the hourly rate, but it increases the internal management burden.
Management Premium: Managing offshore providers typically adds 6% to 10% to the total contract value in internal management time (invoicing, auditing, timezone coordination).21
Rework Cost: In poorly managed relationships, “rework” due to communication gaps or cultural misunderstandings can consume 18% of project time.22 This erosion of efficiency can completely negate the labor arbitrage savings.
6. The Legal Framework: Analyzing Batch Failure Clauses
The Master Services Agreement (MSA) is the battleground where financial liability is determined. The most contentious clause in any MSA is the “Batch Failure” provision.
6.1 The “Effort vs. Outcome” Debate
CDMOs fundamentally argue that they sell effort, not products. They claim that biology is unpredictable, and they should not be penalized if a scientifically sound process fails to yield product.
Standard CDMO Clause: “In the event of a batch failure, CDMO will repeat the batch at its own cost only if the failure was due to CDMO’s gross negligence or willful misconduct.”
The Sponsor’s Risk: Under this standard clause, if a batch fails due to a “process anomaly” or “inherent variability,” the Sponsor pays for the failed batch and the re-run.
6.2 Best Practice Negotiation
Sponsors must push for a middle ground.
Defining Negligence: The definition of “negligence” should be broadened to include “failure to follow the Master Batch Record (MBR)” or “operator error.”
Material Reimbursement: The biggest loss in a batch failure is often the API, not the manufacturing fee. A strong MSA includes a clause where the CDMO reimburses the cost of the API (up to a cap, e.g., $500,000 per batch) if the failure is their fault.23
The “Re-Make” Right: Sponsors should negotiate for a “re-make at cost” (materials only, no profit margin) for failures that fall in the grey area between negligence and scientific misfortune.
7. Competitive Intelligence: Turning Patent Data into Leverage
In a market characterized by asymmetric information—where CDMOs know their capacity but Sponsors don’t—data is leverage. Platforms like DrugPatentWatch have become essential tools for savvy business development and procurement teams.
7.1 The “White Space” Strategy for CDMOs
For CDMOs, patent data is a roadmap to future revenue.
The Mechanism: By analyzing patent expiry dates, CDMOs can identify the “Patent Cliff”—the moment a blockbuster drug loses exclusivity.1
The Play: A CDMO can identify that a major injectable biologic is going off-patent in 2028. They can proactively develop a non-infringing manufacturing process and offer it to generic companies 18 months before the cliff. This allows them to pitch a “turnkey” solution rather than just capacity.1
7.2 The “Validity Check” for Sponsors
For Sponsors, patent intelligence is a vetting tool.
Due Diligence: If a CDMO claims to have a “proprietary high-yield expression system,” a search on DrugPatentWatch can reveal whether they actually hold the patents or if they are licensing technology that might be encumbered by third-party IP rights.
Competitor Tracking: Sponsors can track where their competitors are filing manufacturing patents. A surge in filings related to “lipid nanoparticle formulations” by a competitor signals a shift in their pipeline, prompting the Sponsor to secure CDMO capacity in that niche before the market tightens.25
Expert Insight: “Using platforms… such as DrugPatentWatch, a CDMO’s business development team can create a pipeline of future targets… This is no longer guesswork; it’s strategic foresight.” 1
8. Regional Pricing Dynamics: The Global Map of 2025
While the gap is narrowing, geography remains a primary determinant of price.
8.1 North America & Western Europe (The Premium Tier)
Pricing: Highest globally. FTE rates for specialized scientists range from $250,000 to $400,000+ annually (fully burdened).
The Value: Proximity to innovation hubs (Boston, Basel), rigorous IP protection, and cultural/timezone alignment.
Outlook: Capacity is tightest here due to the reshoring trend driven by BIOSECURE. Expect rates to rise 5-10% annually.
8.2 China (The High-Risk Value Tier)
Pricing: Historically 30-50% lower than Western rates.12
The Shift: China offers unmatched speed (“China Speed”) and scale. However, the BIOSECURE Act has made this a “toxic” asset class for U.S.-facing companies. We expect pricing to soften further as Chinese CDMOs offer deep discounts to retain business, creating a “risk vs. reward” dilemma for cash-strapped biotechs.
8.3 India (The “China Plus One” Beneficiary)
Pricing:40-60% lower than U.S. rates.
The Trend: India is the primary beneficiary of the decoupling. Major players like Syngene and Piramal are seeing surging demand.
The Caveat: Regulatory compliance (FDA Form 483s) remains a watchpoint. The price discount comes with a higher requirement for QA oversight.
9. Future Trends: The 2030 Outlook
9.1 AI and Digital Maturity
There is a stark divergence in digital adoption. While 60% of pharma companies view AI as critical for process optimization, only 28% of CDMOs prioritize it.26
The Pricing Impact: CDMOs that successfully integrate AI (e.g., “Digital Twins” for predictive maintenance) will likely charge a premium for “reliability assurance,” selling guaranteed uptime rather than just capacity.
9.2 Continuous Manufacturing (CM)
The shift from batch processing to continuous manufacturing is accelerating.
Economics: CM offers lower operating costs (smaller footprint, less labor) but requires higher upfront Capital Expenditure (CapEx).
The Model: We may see CDMOs offering “CM-as-a-Service,” where the client pays for the dedicated line installation and amortizes it over a long-term supply contract.
9.3 The Consolidation Wave
The market is consolidating. High interest rates and private equity activity are driving mergers (e.g., Novo/Catalent).
Impact: Fewer, larger CDMOs mean more pricing power for vendors. The “middle class” of CDMOs will disappear, leaving only niche specialists and massive aggregators.
Key Takeaways
Analyze Total Cost of Ownership (TCO): Never select a CDMO based on the FTE rate or batch price alone. Calculate the TCO by adding Tech Transfer fees ($2M+), management overhead (10%), stability costs, and potential batch failure liabilities.
Diversify for BIOSECURE: If your commercial strategy includes the U.S. market, you must have a non-Chinese manufacturing source by 2030. Use the “China Plus One” strategy immediately to qualify a secondary supplier in India, Europe, or the U.S.
Leverage Patent Data: Use DrugPatentWatch to validate CDMO capabilities and identify competitor movements. In a tight market, knowing where the “white space” is can save millions.
Secure Sterile Capacity Now: The GLP-1 boom has consumed global sterile fill-finish capacity. Book your slots 18-24 months in advance, or risk being locked out of the market.
Contract for Failure: Negotiate the “Batch Failure” clause with extreme prejudice. Ensure you are not paying for the CDMO’s negligence and fight for reimbursement of API costs.
FAQ: Common Questions on CDMO Pricing
Q1: How can we accurately budget for a “Tech Transfer” when CDMO quotes vary so widely?
A: Ignore the “initiation fee” line item. Ask for a breakdown of “Engineering Runs,” “PPQ Batches,” and “Analytical Method Validation.” A realistic budget for a Phase III biologic transfer is $2 million to $5 million. If a quote is significantly lower, they are likely underestimating the engineering runs required, which will lead to change orders later.
Q2: What is the “Grandfather Clause” in the BIOSECURE Act, and can I rely on it?
A: The clause allows existing contracts with named companies (like WuXi) to continue until 2032.11 While legally valid, relying on it is strategically risky. You become a “lame duck” client, and as 2032 approaches, Western CDMO capacity will likely be fully booked, giving them immense pricing power over desperate switchers.
Q3: Is the “FTE” model always better for early-stage development?
A: Generally, yes. In early development, the Scope of Work changes constantly. An FFS model would require constant, costly Change Orders. FTE allows you to pivot the team’s focus instantly. However, it requires you to have a strong internal project manager to ensure the CDMO team remains productive.
Q4: How do we protect our IP in a “Risk-Sharing” or “Milestone” model?
A: This is the biggest risk of non-FFS models. If a CDMO lowers their price in exchange for a milestone, they may ask for “joint ownership” of process improvements. You must explicitly state in the MSA that “all improvements to the Client’s process, regardless of who invents them, are the sole property of the Client,” potentially in exchange for a slightly higher royalty or success fee.
Q5: Why are “reservation fees” for Cell & Gene Therapy so high?
A: CGT suites are not fungible. Unlike a chemistry reactor that can be cleaned and reused for a different product in hours, a CGT suite often requires days of decontamination and setup for a specific viral vector. If a client cancels, that time is lost revenue. CDMOs charge high, non-refundable reservation fees to cover this “opportunity cost” and the high salaries of the specialized staff required to run the suite.
Design and Features of Pricing and Payment Schemes for Health Technologies: A Scoping Review and a Proposal for a Flexible Need-Driven Classification – PMC – PubMed Central, accessed November 26, 2025, https://pmc.ncbi.nlm.nih.gov/articles/PMC11724778/
This MASTER SERVICE AGREEMENT (this “Agreement”), effective as of this 28 th day of July 2023 (the “Effective Date”), between, uBrigene (Boston) Biosciences Inc. (“Customer”), a Delaware corporation, and Mustang Bio, Inc. (“CDMO”), a Delaware corporation with a site generally applicable to manufacturing or production of cell and gene therapies located at 377 Plantation Street, Worcester, Massachusetts 01605 (the “Worcester Facility”). Customer and CDMO are referred to herein each as a “Party” and collectively as the “Parties”. – SEC.gov, accessed November 26, 2025, https://www.sec.gov/Archives/edgar/data/1680048/000155837023012508/tmb-20230728xex10d2.htm