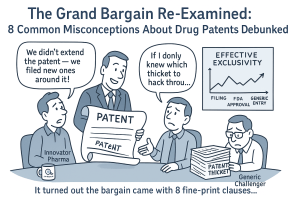
The ‘grand bargain’ of pharmaceutical patents is one of the most consequential, most contested, and most misunderstood arrangements in modern commerce. In exchange for public disclosure of an invention, the state grants a time-limited exclusivity right. Simple enough in theory. In practice, this bargain is a sprawling, multi-jurisdictional legal architecture where patent claims, FDA regulatory exclusivities, antitrust doctrine, and drug pricing policy collide daily.
What makes the debate so reliably unproductive is the persistence of foundational misconceptions that circulate across policy briefings, earnings calls, and newsrooms with equal authority. These are not minor errors. They shape legislation, influence litigation strategy, and distort portfolio decisions worth billions of dollars. For IP teams, portfolio managers, and R&D leads working on the front lines of pharmaceutical commercialization, accepting the simplified version of these concepts is a professional liability.
This guide systematically dismantles eight of the most consequential misconceptions about drug patents. Each section goes beyond the debunk to analyze the underlying legal mechanics, the IP valuation implications, and the strategic decisions that follow from an accurate understanding of how the system actually works. The goal is a working model sophisticated enough to inform real decisions in drug development, licensing, generic entry timing, and portfolio construction.
Misconception 1: A Patent Grants an Absolute 20-Year Market Monopoly
What the Misconception Gets Wrong
The idea of a ’20-year monopoly’ treats pharmaceutical market exclusivity as a single, uniform countdown clock that starts when a drug hits pharmacy shelves. This framing is wrong on at least three dimensions: it misidentifies what a patent actually grants, it confuses the patent’s filing date with the drug’s approval date, and it ignores a parallel universe of FDA-administered regulatory exclusivities that operate on entirely different statutory logic.
The Negative Right: Exclusion, Not Permission
A patent does not give its holder the right to commercialize anything. It grants the right to exclude others from making, using, selling, or importing the patented invention for a fixed term. This is not a semantic distinction. Consider a company that discovers a novel therapeutic use for an existing patented compound. They can file for and receive a method-of-use patent on that new indication, giving them the right to exclude others from that specific use. But they cannot actually practice that use without a license from the original compound patent holder. The new patent is purely a blocking instrument.
This ‘right to exclude’ architecture has direct implications for IP valuation. A patent’s value is not its permission to generate revenue; it is its power to prevent competition. The commercial value of a portfolio derives from the cost and risk it imposes on would-be competitors, not from the face value of the claims. Valuation models that treat patent ownership as synonymous with revenue entitlement systematically overstate the asset’s worth in multi-party IP environments.
The Effective Patent Life Problem
The statutory term of a U.S. patent runs for 20 years from the application’s filing date, not from the date of regulatory approval. For pharmaceutical products, this gap is substantial. Drug development from preclinical research through Phase III trials and FDA review averages 10 to 15 years. A company that files a composition-of-matter patent on a new molecular entity in Year 1 of the discovery program and receives FDA approval in Year 12 has, at best, eight years of patent-protected commercial life remaining. Industry data puts the average effective patent life after approval at roughly 11 to 13 years for established small molecules, and often shorter for complex biologics where development programs run even longer.
Congress partially addressed this through the Drug Price Competition and Patent Term Restoration Act of 1984 (Hatch-Waxman), which allows patent term extension (PTE) of up to five years for the time consumed by FDA review, subject to a cap that limits the total post-approval patent life to 14 years. In the EU, the analogous mechanism is the Supplementary Protection Certificate (SPC). But PTE is available for only a single patent per approved drug, and the selection of which patent to extend is one of the higher-stakes IP decisions a company makes. Selecting a process patent when a formulation patent would have provided broader commercial protection, for example, is an error that cannot be corrected retroactively.
The Regulatory Exclusivity Layer
Operating in parallel to the patent system, and governed by entirely different statutes, the FDA administers a set of regulatory exclusivities that are often more commercially decisive than the patents themselves.
New Chemical Entity (NCE) exclusivity under the Hatch-Waxman Act grants five years of data exclusivity for drugs containing an active moiety not previously approved by the FDA. During this period, the FDA will not accept an Abbreviated New Drug Application (ANDA) for a generic version. In practice, the bar is even higher: no ANDA can be submitted until four years have elapsed, and a Paragraph IV certification filed at the four-year mark triggers a 30-month automatic stay of generic approval while patent litigation is resolved.
Three-year new clinical investigation exclusivity is more limited. It protects FDA approval for applications supported by new clinical investigations essential to approval, such as a new indication or a new dosage form. This exclusivity does not prevent generics from entering the market for pre-existing formulations or indications of the same molecule, a distinction that regularly surprises IP teams who conflate label exclusivity with product exclusivity.
Orphan Drug Exclusivity (ODE) is seven years from approval for drugs granted orphan designation, protecting the specific orphan indication from competition. AstraZeneca’s use of orphan designation for new indications of established drugs has been scrutinized precisely because the exclusivity attaches to the indication, not the molecule, allowing the strategy to stack additional protection onto an otherwise maturing asset.
The most consequential regulatory exclusivity for portfolio strategy is the 12-year biologic data exclusivity established by the Biologics Price Competition and Innovation Act (BPCIA) of 2010. This 12-year period runs from the reference biologic’s first FDA licensure and blocks FDA approval of a biosimilar regardless of the patent situation. A biosimilar manufacturer might successfully challenge and invalidate every patent in the innovator’s portfolio and still be unable to receive FDA approval until the 12-year clock expires. For biologics, regulatory exclusivity is frequently the binding constraint on competitive entry, not patents.
Pediatric exclusivity adds six months to all existing patents and exclusivities in exchange for conducting pediatric studies requested by the FDA, making it one of the few instances in the system where a company can extend the effective life of every protection it holds through a single, bounded regulatory action.
IP Valuation Implications
Correct valuation of a pharmaceutical drug’s IP estate requires modeling each protection layer separately, with distinct expiry dates and distinct legal risks. A composition-of-matter patent, an NCE exclusivity, and a pediatric extension each expire at different times, are subject to different challenge mechanisms, and carry different probabilities of successful invalidation. The aggregate protection timeline is not the date of the last expiry; it is a probability-weighted composite that accounts for the likelihood that each layer holds. Treating the portfolio as a single ‘exclusivity date’ produces systematically inaccurate NPV calculations and misprices licensing and M&A transactions.
Key Takeaways
The ’20-year monopoly’ conflates four separate legal concepts: the statutory patent term, the effective patent life after approval, patent term extension, and FDA regulatory exclusivities. For small molecules, the commercially relevant exclusivity window after FDA approval typically runs eight to thirteen years, depending on PTE eligibility and the presence of NCE exclusivity. For biologics, the 12-year BPCIA data exclusivity is the primary constraint on biosimilar entry, not patent expiry. Any IP or portfolio analysis that fails to disaggregate these layers is analytically incomplete.
Investment Strategy
Analysts pricing a pharma asset approaching its patent cliff should first identify which protection is actually binding on generic or biosimilar entry. For a biologic, is it a specific composition patent, or the 12-year data exclusivity? The answer determines both the timing of competitive entry and the litigation risk premium. Assets where the binding constraint is regulatory exclusivity rather than patent protection carry structurally lower litigation risk, which should be reflected in discount rates applied to projected cash flows during the exclusivity window.
Misconception 2: Follow-On Patents Are ‘Trivial’ Tweaks Designed to ‘Evergreen’ a Monopoly
What the Misconception Gets Wrong
The charge of ‘evergreening’ carries a specific and loaded implication: that a patent’s extension is both trivial in scientific terms and cynical in legal terms. The reality is more precise and considerably more contested. The practice exists, it is commercially motivated, and its policy consequences are significant. But the blanket characterization of all follow-on pharmaceutical patents as illegitimate obscures a genuine tension between two frameworks for defining what counts as a meaningful innovation.
What a Follow-On Patent Actually Is
A follow-on, or secondary, patent covers a property of a known drug that is distinct from the original active moiety. Typical subject matter includes: specific polymorphic crystal forms (relevant to stability, bioavailability, and manufacturability), new salt forms, formulation technologies (extended-release matrices, nanoparticle delivery systems), new synthetic routes or manufacturing processes, new dosage forms or administration routes, and new therapeutic indications. Each of these can be, and regularly is, the subject of a valid patent claim that meets the legal standards of novelty, utility, and non-obviousness.
The term ‘evergreening’ is therefore imprecise. What critics actually describe is one of two distinct, though related, practices: the accumulation of follow-on patents around a core molecule to construct a defensive portfolio, and the deliberate migration of prescriptions to a new, follow-on-patent-protected formulation before the core molecule patents expire. These are different strategies with different competitive effects and different regulatory responses.
A new patent on a follow-on property does not extend the life of the original composition-of-matter patent. It has its own 20-year term from its own filing date. When the original patents expire, generic manufacturers can enter the market with copies of the original formulation, regardless of how many follow-on patents cover alternative versions of the product. The commercial question is whether the innovator has succeeded in migrating the market away from the original formulation before that generic entry occurs.
The Patentability Standard and Its Critics
Under U.S. law, non-obviousness is the primary legal hurdle for a follow-on patent. The test, established in Graham v. John Deere Co. (1966) and refined in KSR International Co. v. Teleflex Inc. (2007), asks whether the claimed invention would have been obvious to a person of ordinary skill in the relevant field at the time of filing, given the prior art. If a new polymorphic form produces unexpectedly improved dissolution rates, stability, or bioavailability that a skilled formulator would not have predicted from the prior art, the form is non-obvious and thus patentable.
This is not a low bar in well-resourced patent prosecution. But critics argue, with substantial empirical support, that the patent examination process at the USPTO allows too many follow-on pharmaceutical patents to issue because examiners lack the pharmaceutical domain expertise and the time to identify all relevant prior art for complex formulation claims. The result, according to the Institute for Medicines, Access and Knowledge (I-MAK), is a system that lavishes patent protection on incremental changes while the foundational public health rationale for those patents, incentivizing genuine therapeutic advance, goes unserved.
Data cited across multiple published analyses found that between 2005 and 2015, approximately 74 to 78 percent of new patents associated with drugs were granted for existing medicines rather than new active ingredients. This concentration of patenting activity on the tail end of drug lifecycles, rather than on the discovery of novel molecules, suggests a structural misalignment between the system’s incentive design and the actual behavior it produces.
The Gleevec Case: Patentability Meets Therapeutic Efficacy
No case illustrates the core conflict more precisely than Novartis AG v. Union of India & Others, decided by the Supreme Court of India in April 2013. The subject was imatinib mesylate, the active ingredient in Gleevec (branded as Glivec in Europe), a targeted therapy for chronic myeloid leukemia.
Novartis sought Indian patent protection not on imatinib itself, which had entered the prior art before India’s patent law was updated to comply with TRIPS obligations, but on the beta-crystalline form of imatinib mesylate. The company argued that the new form had materially improved bioavailability, making it a patentable improvement over the known compound.
The case turned on Section 3(d) of India’s Patents Act, a provision specifically enacted in 2005 to prevent evergreening. Section 3(d) denies patent protection to a new form of a known substance unless it demonstrates ‘significantly enhanced efficacy’ compared to the known substance. The critical interpretive question was whether ‘efficacy’ means pharmacokinetic properties (bioavailability, absorption), which the new crystal form arguably improved, or therapeutic efficacy, meaning clinical outcomes in patients.
The Supreme Court held that ‘efficacy’ under Section 3(d) means therapeutic efficacy. Improved bioavailability that does not demonstrably translate into better patient outcomes fails the test. Novartis had not provided clinical data showing that patients on the beta-crystalline form fared better than patients on the original imatinib compound. The patent was denied.
The immediate commercial consequence was that generic manufacturers in India and several other developing countries could continue producing imatinib at prices as low as $88 per month, compared to approximately $2,200 per month for branded Gleevec. Estimates from generic manufacturers and patient advocacy groups suggested that affordable access to imatinib in the five years following the ruling reached approximately 500,000 CML patients who would otherwise have faced branded pricing.
The ruling became a reference point for countries seeking to implement or defend stricter patentability standards for pharmaceutical increments. Argentina, the Philippines, and several African Union members have referenced the Section 3(d) standard in subsequent patent law reform debates.
The Technology Roadmap for Secondary Patent Filing
Lifecycle management IP strategy follows a predictable sequence that IP teams at innovator companies execute systematically. After a composition-of-matter patent is filed and a molecule enters development, the company’s IP group begins surveillance for subsequent patentable improvements. This typically proceeds through four phases.
First, during clinical development, process patents are filed covering the synthetic route, key intermediates, and purification methods. These protect manufacturing know-how and raise the technical barriers for generic entry even after the compound patent expires.
Second, as Phase II data generates dose-finding and PK/PD insights, formulation scientists work to develop improved delivery systems. Extended-release formulations, co-crystals, amorphous dispersions, and novel excipient combinations each generate potential patent claims that, if valid, extend commercial relevance beyond the compound patent.
Third, as the drug approaches approval and enters post-marketing surveillance, new indications are identified and filed. Method-of-use patents for each new indication have their own patent terms and can materially extend revenue streams by protecting label expansion even when the core molecule is off-patent.
Fourth, in the final years before compound patent expiry, the company may seek patents on formulation, device (if an inhaler or auto-injector is involved), or co-formulation combinations. AstraZeneca’s Symbicort inhaler portfolio, for example, includes patents on the device, the formulation, and the combination of budesonide and formoterol, each carrying different expiry dates and each requiring a separate challenge from any would-be generic.
Key Takeaways
Evergreening describes a real commercial practice, but the term conflates two distinct behaviors with different legal and policy implications: defensive portfolio accumulation and active market migration to new formulations. Secondary patents are valid under U.S. law if they meet the non-obviousness standard, and many do. The policy concern is not that companies obtain illegal patents; it is that the legal bar for patentability may be set at a level that rewards incremental formulation work disproportionately relative to the therapeutic value delivered. The Gleevec ruling offers one legislative model for calibrating this threshold toward therapeutic outcomes rather than pharmacokinetic proxies.
Investment Strategy
For analysts evaluating an innovator’s portfolio near a compound patent cliff, the commercial question is whether the secondary patent estate covers the actual commercial product being prescribed, or only the original formulation. If the market has been substantially migrated to an extended-release or reformulated product during the exclusivity period, the relevant competition date is the expiry of the secondary patent covering that new formulation. If the market has not been migrated, generic entry on the original form will capture the bulk of volume regardless of how many secondary patents remain in force on peripheral formulations.
Misconception 3: ‘Patent Thickets’ Are an Illegal Antitrust Violation That Courts Will Dismantle
What the Misconception Gets Wrong
The term ‘patent thicket’ implies that a dense accumulation of patents around a single drug product is inherently illegal, anticompetitive, and subject to straightforward judicial remedy. Courts have consistently declined to adopt this view. The construction of a large patent portfolio around a pharmaceutical asset is, as a general matter, lawful under both patent law and antitrust law. The problem is not its legality. The problem is that a portfolio strategy designed primarily for litigation burden rather than innovation protection creates market foreclosure effects that the current enforcement framework is poorly positioned to address.
The Mechanics of Economic Attrition
A patent thicket’s function as a competitive weapon does not depend on the innovator winning every lawsuit. It depends on making the cost of fighting every lawsuit higher than the profit from competing. The asymmetry is structural. A duplicative follow-on patent costs a pharmaceutical company between $20,000 and $50,000 to prosecute through the USPTO. Challenging that patent at the Patent Trial and Appeal Board (PTAB) through an Inter Partes Review (IPR) costs the challenger a minimum of $500,000 in legal and expert fees. Full district court litigation over a single patent costs between $3 million and $10 million per side through trial.
A biosimilar company facing a 100-patent portfolio, where each patent is potentially independently asserted, faces aggregate litigation costs that can reach hundreds of millions of dollars before a single patient receives their product. Even if 90 of those patents are invalid or non-infringed, the cost and timeline of establishing that fact through litigation creates a deterrent that operates independently of legal merit. The deterrent is especially powerful because the biosimilar must prevail on every single asserted claim; the innovator only needs one valid, infringed patent claim to maintain an injunction.
I-MAK research published in 2020 found that in the context of the most heavily patented biologic drugs, nearly 80 percent of the U.S. patent estate was comprised of patents linked by terminal disclaimers, a procedural mechanism that limits the independent term of each patent but allows a large portfolio to be built around a single foundational claim. Terminal disclaimer-linked patents are typically challenging to invalidate independently because their validity often depends on the validity of the foundational patent from which they derive.
The Humira Portfolio: A Documented Case Study in Thicket Construction
AbbVie’s patent strategy around adalimumab (Humira) is the most extensively documented example of thicket construction in the pharmaceutical industry. Humira received FDA approval in December 2002 for rheumatoid arthritis. The composition-of-matter patents covering the adalimumab antibody itself were set to expire in 2016. What followed over the next 16 years was a systematic effort to construct a portfolio that would make biosimilar entry commercially impractical regardless of when specific patents expired.
I-MAK’s analysis of the adalimumab patent estate identified at least 136 granted patents and pending applications in the U.S., compared to 76 applications filed at the European Patent Office. The European Patent Office rejected, withdrew, or revoked a substantial portion of AbbVie’s follow-on applications on grounds that the underlying innovations failed European standards for inventive step, the rough equivalent of non-obviousness. The divergent outcomes at the USPTO versus the EPO for the same portfolio is itself a data point about the relative stringency of examination standards.
Critically, 89 percent of AbbVie’s U.S. patent applications were filed after Humira’s 2002 FDA approval. Close to half were filed between 2014 and 2018, a period that coincides exactly with the years when the composition-of-matter patents were expiring and when biosimilar development programs at competitors were advancing through clinical trials. The clustering of filing activity at the precise moment when competition was becoming technically feasible suggests a portfolio strategy timed to create litigation burden rather than to protect ongoing innovation.
The commercial consequence was a five-year gap between European and U.S. biosimilar entry. Sandoz launched its biosimilar adalimumab (Hyrimoz) in Europe in October 2018. Despite the FDA approving Amgen’s Amjevita as the first U.S. adalimumab biosimilar in September 2016, biosimilar entry into the U.S. market did not begin until January 2023. Each of the biosimilar developers, including Amgen, Sandoz, Samsung Bioepis, and Boehringer Ingelheim, settled patent litigation with AbbVie on terms that included a negotiated U.S. entry date, a direct commercial consequence of the cost and risk calculation imposed by the patent thicket.
One economic analysis estimated that the delayed U.S. biosimilar entry for adalimumab alone cost the U.S. healthcare system approximately $45 billion in excess spending during the gap period relative to what biosimilar competition would have produced. A broader analysis by I-MAK, covering just three biologics with simultaneous European biosimilar markets, estimated excess U.S. spending of $167 billion during the period of asymmetric competition.
The Antitrust Question and Its Limits
Courts have addressed pharmaceutical patent accumulation under antitrust law in several contexts, but have generally declined to treat the mere assembly of a large patent portfolio as an antitrust violation. Walker Process Equipment v. Food Machinery Corp. (1965) established that enforcement of a patent obtained through fraud on the USPTO can constitute illegal monopolization. But establishing fraud requires proving intentional misrepresentation of material facts during prosecution, a high evidentiary burden that rarely succeeds in patent portfolio litigation.
More relevant to the thicket question is the line of cases addressing anticompetitive patent enforcement, where an innovator’s conduct in asserting a known-invalid patent against a competitor could constitute monopolization under Section 2 of the Sherman Act if it meets the standard articulated in Professional Real Estate Investors v. Columbia Pictures Industries (1993). But this standard requires that the litigation be objectively baseless, meaning no reasonable litigant could expect to prevail, a bar that is difficult to satisfy for patents that have received a presumption of validity upon issuance by the USPTO.
The practical result is that the current antitrust framework is poorly calibrated to address portfolio-level competition effects from individually valid patents. Each patent is assessed in isolation. The aggregate barrier created by 136 patents, each with individual validity, is not a recognized antitrust violation. Legislative remedies, such as Senate proposals to limit the number of patents assertable in PTAB proceedings for a single drug product, have been introduced but not enacted as of May 2026.
Enbrel and the Etanercept Situation
Amgen’s etanercept (Enbrel), approved in 1998, illustrates a different dimension of thicket strategy: the intersection of biologic data exclusivity stacking with patent portfolio construction. A 2021 New Jersey district court ruling in Immunex Corp. v. Sandoz Inc. upheld several key Enbrel formulation patents, effectively extending Amgen and Pfizer’s exclusive market position for etanercept in the U.S. well past the expiry of the molecule’s original patents, giving the product roughly three decades of effective exclusivity. Sandoz, which had launched its biosimilar etanercept (Erelzi) in Europe in 2016, challenged the U.S. patent landscape in federal court with limited success. The case is regularly cited in policy discussions about whether BPCIA’s combined patent and regulatory framework for biologics is correctly calibrated to balance innovation incentives against access.
Key Takeaways
Patent thickets are a commercially rational, largely legal strategy that exploits asymmetries in the cost and risk of patent litigation to deter competition. The strategy’s effectiveness depends not on the individual legal merit of any single patent but on the aggregate economic burden of the portfolio. The current patent and antitrust enforcement frameworks are poorly suited to address portfolio-level competition effects, because they evaluate patents individually rather than in aggregate. Legislative intervention is the most direct path to calibrating the system, but as of May 2026, no substantive U.S. reform legislation specifically targeting biologic patent portfolio accumulation has cleared Congress.
Investment Strategy
For biosimilar developers modeling their market entry timelines, the relevant analysis is not the expiry date of any single Humira, Enbrel, or equivalent biologic patent. It is the cost of the full litigation timeline against the full asserted portfolio, compared to the net present value of the commercial opportunity. Many biosimilar programs have been commercially rational as settlements even at negotiated entry dates several years later than theoretical patent expiry, precisely because the cost of litigating to an earlier entry date would exceed the incremental revenue from early entry. Analysts should model the ‘settlement date’ distribution, not the ‘patent expiry date’ distribution, when projecting biosimilar market entry for products with large patent portfolios.
Misconception 4: ‘Product Hopping’ Is a Patent Strategy
What the Misconception Gets Wrong
Product hopping is routinely grouped with evergreening and patent thickets as a ‘patent strategy.’ It is not primarily a patent strategy. It is a market-access strategy that uses a secondary patent as a pretext for a commercial maneuver whose real target is the automatic substitution mechanism that generics depend on to achieve market penetration. Understanding the distinction matters enormously for IP teams, compliance functions, and antitrust counsel because the legal risk from product hopping sits primarily in antitrust law, not patent law.
How Automatic Drug Substitution Works and Why It Matters
Under state pharmacy substitution laws that exist in all 50 U.S. states, pharmacists are permitted or required to dispense a therapeutically equivalent generic when presented with a brand-name prescription, unless the prescribing physician explicitly requires the brand. FDA determines therapeutic equivalence and publishes its ratings in the Orange Book. Products rated ‘AB’ are deemed therapeutically equivalent and are freely substitutable at the pharmacy level.
This mechanism is the commercial engine of the generic drug market. It allows generic manufacturers to capture prescriptions that were written for the branded product without conducting a competing physician-level marketing campaign. The prescriber writes ‘Lipitor 10mg,’ and the pharmacist dispenses atorvastatin 10mg. The generic captures the prescription without the prescriber ever making an active choice to switch.
Product hopping short-circuits this mechanism by ensuring that the new branded product, typically a reformulation or extended-release version, is not therapeutically equivalent, in the Orange Book sense, to the generic. When a prescriber writes a new prescription for the reformulated product, the generic version of the original formulation cannot be automatically substituted because the two products are not rated as equivalents. The commercial significance of this distinction is substantial. A generic that cannot capture prescriptions through automatic substitution must compete on the basis of physician detailing and formulary positioning, a far more expensive and uncertain route to market penetration.
The Hard Switch vs. the Soft Switch
Brand companies execute product hopping on a spectrum from commercial to coercive. A soft switch involves sustained marketing and promotional investment in the new formulation while the original formulation remains available, gradually migrating the prescriber base through commercial persuasion. Physicians are educated about the clinical benefits of the new formulation, patient assistance programs favor the new product, and promotional spending on the old formulation is cut to zero.
A hard switch adds an additional step: the innovator withdraws the original formulation from the U.S. market entirely, or makes it functionally unavailable by declining to distribute it through major pharmacy chains. When the generic copy of the original formulation arrives, there are no existing prescriptions to substitute into. The generic is commercially stranded.
The economic logic of a hard switch is straightforward: a company that abandons a highly profitable drug in the months before generic entry, and incurs the costs of transitioning its entire prescriber base to a new formulation, would not take that action absent the benefit of blocking generic entry. This is the ‘no-economic-sense’ test that antitrust courts have applied to evaluate whether a product switch is pro-competitive innovation or anticompetitive foreclosure.
The Warner Chilcott Actonel / Atelvia Case
Warner Chilcott’s handling of risedronate sodium provides one of the cleaner documented examples of a hard switch in the generic drug context. Actonel (risedronate) faced generic entry when its key patents expired. Warner Chilcott launched Atelvia, an enteric-coated formulation of risedronate that could be taken with breakfast rather than requiring a 30-minute fasting period, and simultaneously withdrew Actonel from U.S. distribution channels. The FTC examined the conduct and ultimately chose not to pursue enforcement action, a decision that was criticized by generic manufacturers and some academics as an insufficient response to a clear hard switch.
The Namenda (memantine) product hop by Actavis (later Allergan) generated more consequential litigation. Actavis launched Namenda XR, an extended-release formulation of memantine for Alzheimer’s disease, and announced the withdrawal of Namenda IR from the market before generic entry. The State of New York brought suit under state antitrust law. The Second Circuit Court of Appeals upheld a preliminary injunction preventing Actavis from discontinuing Namenda IR, holding that a hard switch from an established drug to a reformulated version with the specific purpose of impairing generic competition could constitute an antitrust violation. The case produced an important precedent: under the right factual circumstances, a court will use antitrust law to prevent a hard switch even before a final finding of liability.
Key Takeaways
Product hopping is an antitrust exposure issue, not a patent validity issue. The relevant legal question is not whether the secondary patent covering the new formulation is valid; it is whether the conduct of withdrawing the original formulation, when evaluated under the ‘no-economic-sense’ test, constitutes anticompetitive market foreclosure. Hard switches of widely prescribed drugs in the months before generic entry, particularly where the new formulation offers limited additional therapeutic benefit, carry material antitrust litigation risk from state attorneys general and the FTC. The Namenda litigation is the current leading precedent in the Second Circuit.
Investment Strategy
For generic drug developers, the commercial model for any product where an innovator has executed a soft switch should project penetration against the new formulation’s commercial install base, not the old formulation’s historical volumes. If a hard switch has been executed, the generic may face a de minimis addressable market at launch and should model accordingly. For biosimilar and generic manufacturers evaluating pipeline investment decisions, the product hopping risk at a target molecule should be part of the market intelligence assessment, not just the patent cliff analysis.
Misconception 5: The Patent Cliff Is a Simple Story of Revenue Loss
What the Misconception Gets Wrong
The ‘patent cliff’ is real, it is steep, and its financial consequences for individual products are severe. But it is not a passive event. It is a managed transition that a company’s commercial, legal, manufacturing, and corporate development functions spend years preparing for. More importantly, the patent cliff is a systemic driver of industry structure, forcing the M&A activity, pipeline replenishment, and generic market competition that define the industry’s economic cycles.
The Arithmetic of the Cliff
When a blockbuster small molecule loses its primary patent protection, generic entry typically produces a 70 to 90 percent erosion of brand market share within 12 to 18 months. For drugs with $5 to $15 billion in peak annual revenues, this represents a revenue destruction event with few parallels in any other industry sector. The concentrated nature of this loss, occurring over months rather than years, means it cannot be fully managed through operational adjustments; it requires strategic preparation at a corporate level.
The current patent cliff cycle is historically large. Industry projections from IQVIA and EvaluatePharma estimate that between 2025 and 2030, branded drugs with a combined annual revenue exposure in the range of $200 to $300 billion will lose patent protection in major markets. Key assets in this wave include Bristol Myers Squibb’s Eliquis (apixaban, peak annual revenues exceeding $12 billion globally), Merck’s Keytruda (pembrolizumab, which exceeds $25 billion in annual revenue as of 2024 but faces biologic exclusivity timelines rather than a traditional patent cliff), Novo Nordisk’s semaglutide portfolio, and multiple oncology agents from the 2014 to 2018 approval cohort whose compound patents are now in their final decade.
Authorized Generics as a Competitive Weapon
One of the most effective tactical responses to generic entry is the authorized generic (AG), a version of the branded product manufactured to the same specification but sold without the brand name, often through a partner distribution arrangement. AGs are strategically powerful because they enter the market alongside the first Paragraph IV challenger during its 180-day exclusivity period, directly competing for the prescription volumes the challenger expected to capture alone.
The 180-day first-filer exclusivity, established under Hatch-Waxman, was designed to reward the generic company that takes the legal risk of filing a Paragraph IV certification by giving it a head start over subsequent generic entrants. An AG launched by the brand company into this exclusivity window dramatically compresses the first-filer’s profit margins during the very period they were expected to be highest. The first-filer now competes with two versions of the same drug, the branded product (still supported by the payer rebate system) and the AG (priced competitively in the generic tier), while also facing the certainty that additional generics will enter after the 180-day period ends.
Pfizer’s response to Lipitor’s 2011 patent expiration demonstrated the full commercial power of this approach. Pfizer entered into an agreement with Watson Pharmaceuticals (now Allergan/Teva) to launch an authorized generic version of atorvastatin 10mg, 20mg, 40mg, and 80mg. This AG captured an estimated 70 percent of the generic atorvastatin revenue during Ranbaxy’s 180-day exclusivity window. Pfizer simultaneously deployed a direct-to-consumer copay card program under the ‘Lipitor for You’ branding that offered privately insured patients $4 monthly copays for branded Lipitor, matching or undercutting many generic copay tiers. Pfizer also secured exclusive mail-order supply arrangements with several large PBMs, effectively removing Ranbaxy’s generic from the highest-volume prescription channel during the exclusivity period.
The aggregate financial result was that Lipitor’s worldwide sales fell from $9.5 billion in 2011 to $3.9 billion in 2012, a 59 percent decline that was severe but substantially less catastrophic than the 80 to 90 percent market share erosion that would have occurred without active commercial defense. Pfizer’s strategy added hundreds of millions in revenue that would otherwise have been captured entirely by Ranbaxy and subsequent generic entrants.
M&A as Cliff Defense: The Structural Response
For companies facing a single-asset cliff from a blockbuster drug that constitutes a large fraction of total revenue, M&A is the strategic alternative to hoping that internal pipeline programs will fill the gap in time. The pharmaceutical M&A market has been consistently driven by this dynamic: a company with a large revenue base, temporarily inflated by patent-protected blockbuster sales, uses its financial resources to acquire assets that will generate revenue after the cliff.
This creates a predictable and exploitable transaction window. A company facing a material patent cliff in three to five years has both the financial capacity to pay full strategic value for pipeline assets and the urgency to close transactions. Their negotiating leverage relative to a target deteriorates as the cliff approaches and their cash flow position weakens. For transaction advisors and biotech companies with late-stage assets, identifying acquirers in this window and timing engagement to coincide with maximum buyer urgency is a core deal sourcing strategy.
Key Takeaways
The patent cliff is the pharmaceutical industry’s primary structural forcing function, driving R&D investment, M&A activity, commercial lifecycle strategy, and competitive dynamics in the generic market. It is managed, not passively experienced. Authorized generics, aggressive rebate and formulary strategies, and pre-cliff M&A are the three primary corporate responses, and the Lipitor case provides the most complete documented example of how these tools can be deployed in combination. For the generic industry, the patent cliff is the commercial opportunity that justifies the cost of an ANDA program; understanding how an innovator will defend the cliff is as important as understanding when the patent expires.
Investment Strategy
The most direct cliff-related investment signal is a brand company with a single product that constitutes more than 25 percent of total revenues and whose patent exclusivity expires within three years. Companies in this position face predictable cash flow compression and strong acquisition incentives. Their M&A activity will be driven less by strategic fit than by revenue replacement urgency, which often results in overpayment for pipeline assets. Analysts should apply acquisition premium scrutiny to deals struck by companies in active cliff defense mode.
Misconception 6: Patents Are the Primary Cause of High U.S. Drug Prices
What the Misconception Gets Wrong
Patents create the conditions under which high drug prices are possible. They do not, by themselves, determine the prices that patients and payers actually face. The gap between what patents enable in theory and what patients pay in practice runs through one of the most opaque and structurally distorted supply chains in any industry: the U.S. pharmaceutical distribution system. Attributing the entirety of U.S. drug pricing exceptionalism to patents misidentifies the problem and points policy toward reforms with limited impact.
What Patents Actually Do to Price
A patent removes direct price competition during the exclusivity period. The innovator can charge above marginal cost because no competitor can sell an identical product. This is the intended design: the temporary monopoly is the financial reward for innovation. But ‘above marginal cost’ does not specify how far above. The distance between marginal cost of production and the list price of a patented drug is not determined by patent law; it is determined by the payer negotiation environment, the price sensitivity of prescribers, the competitive landscape from therapeutic substitutes, and the reimbursement architecture of the relevant market.
The same patented drug sells at dramatically different prices in different national markets. Humira’s U.S. list price exceeded $60,000 per year at peak, while the same drug was available in Germany for approximately $13,000 per year and in the UK for approximately $9,000 per year under National Health Service pricing. These drugs are protected by the same or analogous patents in all three markets. The price difference is not a patent difference; it is a payer structure difference.
The PBM Architecture and the Rebate System
The U.S. drug pricing system routes the transaction between manufacturer and patient through an architecture dominated by Pharmacy Benefit Managers. Three PBMs, CVS Caremark, Express Scripts (now Evernorth), and OptumRx, manage prescription drug benefits for the majority of commercially insured Americans and a large share of Medicare Part D enrollees. Their consolidated market power, combined with the opaque structure of the rebate negotiations they conduct with manufacturers, creates pricing dynamics that work systematically against low-list-price drugs and in favor of high-rebate, high-list-price ones.
The mechanism is as follows: PBMs negotiate rebates from manufacturers as a condition of favorable formulary placement. Formulary placement determines which drugs are covered, at what tier, and with what patient cost-sharing. Better placement means lower patient cost-sharing, which drives prescriptions. A manufacturer with a high-list-price drug can offer a large rebate in absolute dollar terms, even at a modest percentage of list, and still maintain a net revenue per unit that justifies the arrangement. A manufacturer with a low-list-price drug offering the same clinical benefit has less room to rebate in absolute terms and thus has less to offer PBMs for preferential placement.
This structure creates a perverse incentive: list prices are maintained at elevated levels, in part, to have room to offer rebates that purchase formulary access. The rebate is the price of market entry. The patient faces the list price at the pharmacy counter for copay calculation purposes, even though the payer’s actual net cost is substantially lower after rebates. This bifurcation, between list price and net price, is at the center of ongoing policy debates about drug pricing transparency and PBM reform.
The Inflation Reduction Act of 2022 introduced direct government price negotiation for a limited set of high-cost, high-utilization Medicare drugs. The first 10 drugs subject to negotiation, announced in August 2023, included Eliquis (apixaban, BMS/Pfizer), Jardiance (empagliflozin, BI/Lilly), Xarelto (rivaroxaban, J&J), and seven others. Negotiated prices are scheduled to take effect in 2026. This is a material change to the policy landscape, but the negotiation authority is capped at a small number of drugs per year and applies only to Medicare, leaving the broader commercial and Medicaid market dynamics unchanged.
International Reference Pricing and QALY Frameworks
Every major developed economy outside the U.S. uses some form of cost-effectiveness analysis or international reference pricing to set drug reimbursement levels. The UK’s National Institute for Health and Care Excellence (NICE) uses a cost-per-QALY (quality-adjusted life year) framework with an implicit ceiling of approximately 20,000 to 30,000 GBP per QALY for standard appraisals. Germany’s AMNOG process requires manufacturers to demonstrate added therapeutic benefit over existing standard of care as a condition of pricing negotiations with the statutory health insurance system. France, Spain, and Italy conduct their own Health Technology Assessment (HTA) processes with similar structures.
These frameworks systematically constrain the price that a patent-protected drug can command in those markets, regardless of the manufacturer’s preferred price point. A drug that receives a NICE ‘not recommended’ decision faces a market where national NHS coverage is denied, and the manufacturer must either lower the price or accept minimal uptake. This is a payer negotiation constraint, not a patent constraint.
The U.S. historically lacked an equivalent national HTA framework. CMS did not conduct cost-effectiveness analysis as a condition of coverage or price for Medicare until the IRA’s new drug evaluation provisions. Private payers and PBMs conduct their own formulary reviews, but these are fragmented, non-transparent, and driven by rebate negotiation rather than rigorous clinical value assessment.
Key Takeaways
Patents establish the period during which a manufacturer can charge above competitive prices. The actual price charged is determined by the payer negotiation environment. The U.S. charges two to three times more than comparable developed countries for the same patented drugs not because U.S. patents are stronger, but because the U.S. payer system has fewer structural constraints on what manufacturers can charge during the exclusivity period. PBM consolidation, rebate opacity, and the historical absence of government negotiation authority are the proximate drivers of U.S. pricing exceptionalism. Patent reform that brings generics to market sooner does not address pricing during the exclusivity window; PBM reform and government negotiation address the pricing problem but do not accelerate generic entry.
Investment Strategy
The IRA’s drug price negotiation authority introduces a new risk factor for portfolio valuation of drugs that are high-cost, widely used, and have been on the market for several years without small-molecule generic competition. Medicare market revenue for selected drugs is now subject to negotiated price reduction effective in 2026. For institutional investors, IRA negotiation eligibility should be a line item in revenue projections for assets meeting the statutory selection criteria: no small-molecule generic or biosimilar competition, high Medicare spending, and nine-year or more post-approval age for small molecules, or thirteen years for biologics. The negotiated price discount from statutory list price has ranged from 38 to 79 percent in the first round, a substantially larger reduction than many analysts initially modeled.
Misconception 7: High R&D Costs Provide a Clear, Settled Justification for Patent Protection
What the Misconception Gets Wrong
The pharmaceutical industry’s standard defense of strong patents and high prices rests on a single, oft-repeated number: it costs roughly $2.6 billion to bring a new drug to market. This figure is deployed as if it were a measured fact that ends the policy conversation. It is not a measured fact; it is a modeled estimate derived from self-reported, unaudited industry data with methodological assumptions that critics have contested for over a decade. The figure is contested in absolute terms, questionable in its private-sector attribution, and increasingly difficult to reconcile with independent analyses that generate substantially lower estimates using different data sources.
The Tufts Estimate and Its Discontents
The $2.6 billion figure originates from a 2016 paper by DiMasi, Grabowski, and Hansen published in the Journal of Health Economics, produced by the Tufts Center for the Study of Drug Development. The Tufts CSDD receives significant industry funding. The study relied on confidential, self-reported data from ten large pharmaceutical companies. The raw out-of-pocket spending estimate was approximately $1.4 billion; the total capitalized figure of $2.6 billion was reached by adding approximately $1.2 billion in time costs, representing the opportunity cost of capital tied up in development over 10 to 15 years.
The time cost addition is methodologically reasonable as an economic concept: capital deployed in R&D over a decade cannot earn returns elsewhere, and this foregone return is a real cost of the decision to invest in drug development. However, the specific compound annual rate used to capitalize these costs (approximately 11 percent in the Tufts model) is itself a contested assumption. A lower discount rate produces a substantially lower total figure.
Independent analyses using public data have generated dramatically lower estimates. A 2024 study published in JAMA Network Open by Sertkaya and colleagues, drawing on public data and proprietary per-patient clinical trial cost benchmarks from 2000 to 2018, estimated a mean expected capitalized cost of approximately $879 million. A 2020 systematic review in PLOS Medicine found a range of $314 million to $2.8 billion for new molecular entities depending on data source and methodology. The tenfold spread between the low and high estimates reflects genuine uncertainty about actual costs, not just modeling differences.
The Tufts estimate’s reliance on a small, self-selected sample of large companies with extensive late-stage development programs also raises representativeness concerns. Large companies tend to develop drugs for larger markets with larger trial sizes and longer development programs. The average capitalized cost for a company primarily developing drugs for rare diseases using adaptive trial designs and breakthrough therapy designation would be substantially lower.
The NIH Contribution: The Foundational Role of Public R&D
The most consequential omission from the standard R&D cost narrative is the contribution of public funding through the National Institutes of Health. NIH annual funding exceeds $47 billion. A substantial and growing proportion of this investment flows into basic and translational research that directly identifies and validates the molecular targets and biological mechanisms that pharmaceutical companies subsequently develop into drugs.
A 2018 study in the Proceedings of the National Academy of Sciences examined NIH funding associated with the 210 drugs approved by the FDA between 2010 and 2016. NIH funding supported research associated with every single approved drug in the sample, totaling more than $100 billion in NIH expenditures. A 2023 paper from Bentley University’s Center for Integration of Science and Industry calculated that for the 354 drugs approved between 2010 and 2019, the NIH spent approximately $187 billion on basic and applied research associated with these drugs’ underlying biology and mechanisms. This NIH investment per approved drug was comparable in order of magnitude to the private sector’s reported investment.
This public investment is systematically excluded from the R&D cost narrative. When a pharmaceutical company reports the $2.6 billion cost of bringing a drug to market, that figure covers only the private sector’s spending on clinical development and regulatory approval. It does not capture the decades of federally funded academic research that identified the target, characterized the pathway, established proof of concept in animal models, and often produced the lead compound that the company subsequently licensed from a university or NIH intramural program.
The ‘double payment’ problem, as Mariana Mazzucato and others have articulated in academic and policy contexts, follows directly: taxpayers fund the foundational research, then pay again through monopoly-protected prices during the exclusivity period. If the public has already borne a material share of the total innovation risk, the policy question of what constitutes a fair period of exclusivity and a reasonable price becomes substantially more complex than the standard R&D cost justification suggests.
What the Data Actually Supports
The empirical evidence supports the following conclusions: drug development is genuinely expensive, the attrition rate in clinical development is high (approximately 88 percent of drugs entering Phase I fail to reach approval), and private sector investment in clinical development is a necessary complement to publicly funded basic research. It does not support the conclusion that any specific price level or exclusivity duration is uniquely justified by the cost data, because the cost data is too uncertain and its private-sector attribution is too incomplete to support that level of policy specificity.
Key Takeaways
The $2.6 billion R&D cost figure is a contested estimate, not an established fact, and its widespread use as a policy argument requires disclosure of its methodological limitations and its reliance on industry-funded research with non-transparent underlying data. Independent estimates using public data are substantially lower. Public NIH funding has contributed to the foundational research underlying virtually every modern drug approval. A complete accounting of pharmaceutical innovation costs requires integrating public and private contributions, which substantially changes the implied return calculation for private investors and the implied entitlement to exclusivity length and pricing level.
Investment Strategy
Analysts should treat publicly reported R&D cost figures as indicative ranges rather than precise inputs for innovation cost modeling. More useful for portfolio valuation purposes are program-level cost estimates derived from clinical development costs per patient enrollment in comparable trials, phase-specific success probability data from public FDA records, and time-to-approval estimates from the drug’s regulatory history. The aggregate industry R&D cost debate is a policy input, not a valuation input.
Misconception 8: The Patent System Is Failing Because Generic Competition Is Blocked
What the Misconception Gets Wrong
The most sweeping version of the anti-patent critique holds that the U.S. pharmaceutical patent system, through all the strategies described above, has effectively failed to deliver on its core promise of post-exclusivity competition. This is empirically wrong on the most basic metric: prescription volume. By the single most important measure of whether generic competition is occurring, the U.S. is not a country where the patent system blocks generics. It is a country where generics dominate.
The Generic Market by the Numbers
Before the Hatch-Waxman Act passed in 1984, generic drugs accounted for approximately 19 percent of U.S. prescriptions. By 2004, that share had grown to 53 percent. As of 2021, the FDA reports generic drugs account for over 90 percent of prescriptions dispensed in the United States, against a global average for developed countries of approximately 41 percent. When a therapeutically equivalent generic is available, U.S. pharmacies dispense it 97 percent of the time.
The economics of this penetration are equally striking. Generics account for 90 percent of prescriptions but only 18 percent of total drug spending. Brand-name drugs account for the remaining 82 percent of spending from a 10 percent share of prescription volume. The Association for Accessible Medicines reported that generic and biosimilar competition generated $373 billion in savings for the U.S. healthcare system in 2021. From 2009 to 2019, the cumulative savings attributable to generic and biosimilar competition exceeded $2.2 trillion.
The average out-of-pocket cost for a generic prescription is $6.16, compared to $56.12 for a brand-name prescription. Ninety-three percent of generic copays are under $20. These numbers describe a market where, after exclusivity expires, generic competition produces rapid, decisive price competition that delivers substantial savings to patients and payers.
Hatch-Waxman’s Design and Its Effectiveness
The Hatch-Waxman Act established the framework that produced these outcomes. Before 1984, generic manufacturers were required to conduct their own full clinical trials to establish safety and efficacy, an insurmountable barrier that effectively preserved brand monopolies indefinitely after patent expiry. Hatch-Waxman created the Abbreviated New Drug Application (ANDA) process, which allows a generic to reference the innovator’s clinical data and demonstrate bioequivalence rather than repeating the original clinical development program. It also created the ‘safe harbor’ for generic manufacturers to conduct patent-related research before expiration without infringement liability, enabling them to have products ready to launch the day the patent expires.
The Paragraph IV certification pathway is the specific mechanism that allows patent challenges. A generic company that believes the innovator’s patents are invalid or not infringed files a Paragraph IV certification with its ANDA, triggering notice to the patent holder and, typically, a patent infringement lawsuit. The first company to file a Paragraph IV certification for a given drug is entitled to 180 days of exclusivity from the date of its commercial launch before subsequent generic entrants can receive FDA approval. This 180-day exclusivity was designed to incentivize the legal risk of challenging patents by giving the first challenger a temporary period of elevated margins before the market becomes fully competitive.
The system has generated a substantial Paragraph IV challenge industry. Large generic companies like Teva, Mylan (now Viatris), Sandoz, and Hikma have built business models around the systematic identification of Paragraph IV opportunities, patent challenge litigation, and the capture of 180-day exclusivity periods on high-revenue branded drugs.
The Real Issue: Timing, Not Access
The evidence supports a precise restatement of the core complaint. The U.S. patent system does not prevent generic drug competition. It determines when generic competition begins. The strategies documented throughout this guide, evergreening, patent thickets, product hopping, and patent settlement agreements, are all tools that affect the timing of generic market entry, not its ultimate occurrence. For a drug with $10 billion in annual revenue, each additional year of patent-protected exclusivity before generic entry is worth on the order of $8 to $9 billion in brand revenue. This is the commercial stake that explains the intensity and sophistication of innovator strategies to extend that window.
The Hatch-Waxman-era innovation of patent settlement agreements, sometimes called ‘pay-for-delay’ or ‘reverse payment’ settlements, is the most direct illustration of this timing dynamic. These settlements, in which an innovator pays a generic challenger to delay its market entry to a specified future date, were found by the U.S. Supreme Court in FTC v. Actavis (2013) to be potentially anticompetitive and subject to antitrust scrutiny under a rule of reason analysis. The Court’s decision opened the door to FTC enforcement but did not categorically prohibit the settlements. Subsequent litigation has produced mixed outcomes, and reverse payment settlements remain a recurring feature of Paragraph IV landscapes for major drugs.
Biosimilar Adoption: The New Frontier for Timing Disputes
The biosimilar market, established under the BPCIA, is at an earlier stage of development than the generic small-molecule market and has encountered a different set of barriers. Despite the FDA approving biosimilars for adalimumab, etanercept, infliximab, bevacizumab, trastuzumab, and other major reference biologics, U.S. biosimilar market penetration has lagged significantly behind European equivalents. The reasons are multifactorial: the patent thicket dynamics discussed in connection with Humira and Enbrel, lower biosimilar interchangeability designation rates than initially projected (though FDA has been accelerating these approvals), formulary management by PBMs that prioritizes rebate-generating reference biologics over lower-list-price biosimilars, and provider familiarity with reference products built over decades of use.
The FDA’s interchangeability designation is a prerequisite for automatic pharmacy substitution of biosimilars, the same mechanism that drives generic small-molecule penetration. Without interchangeability designation, a biosimilar requires a physician-level prescribing decision rather than a pharmacy-level substitution, substantially increasing the commercial hurdle for market penetration. As of 2025, the FDA has been granting interchangeability designations more routinely than in the BPCIA’s early years, and several adalimumab biosimilars have received interchangeable status, which should accelerate market penetration as formulary negotiations mature.
Key Takeaways
The U.S. patent system has not failed to produce generic competition. By volume, the U.S. generic market is among the most penetrated in the world, a direct result of Hatch-Waxman’s deliberate policy design. The legitimate critique is narrower and more precise: the strategies available to innovator companies to extend the timing of generic market entry impose measurable costs on the healthcare system without commensurate innovation benefits. The fight is over months and years of delay, not permanent access denial. Policy interventions calibrated to this specific problem, tightening PTAB standards for duplicative follow-on patents, limiting assertable patents in BPCIA litigation, and strengthening antitrust oversight of product hopping and reverse payment settlements, address the actual market failure more precisely than broad indictments of the patent system as a whole.
Investment Strategy
For generic and biosimilar pipeline valuation, the primary analytical variable is the probability-weighted distribution of entry dates, not the latest possible entry date. A drug with a compound patent expiring in 2027 but an assertable secondary patent estate that could, in a fully contested litigation scenario, delay entry until 2031, should be modeled with a probability-weighted average entry date somewhere between these bounds. The probability mass depends on the strength of the secondary patents, the innovator’s litigation track record, the generic company’s litigation budget, and the likelihood of settlement. Entry date uncertainty is itself an asset in the innovator’s hands and a liability in the generic developer’s cost model.
Conclusion: Reforming What the Data Actually Shows Is Broken
The pharmaceutical patent system is not broken in the way its most aggressive critics describe. It has produced a generic drug market that covers over 90 percent of U.S. prescription volume. It has provided the exclusivity framework that incentivized the development of every major therapeutic class of the past 40 years. The Hatch-Waxman Act, specifically and deliberately, designed the current system, and by the metrics it was designed to optimize, it has largely succeeded.
What the data does show is a set of specific, addressable market failures concentrated in two areas. First, the systems for managing the transition from exclusivity to competition are exploitable through portfolio-level patent strategies, product switching, and settlement agreements in ways that systematically delay generic and biosimilar entry beyond what the innovation justification requires. Second, the U.S. drug pricing architecture during the exclusivity period is structurally distinct from every other comparable country, driven by PBM consolidation, rebate opacity, and historically absent government negotiation authority in ways that are not features of the patent system itself.
Effective policy responses need to be calibrated to these specific failures. Tightening USPTO examination standards for follow-on pharmaceutical patents and reforming the PTAB’s approach to pharmaceutical IPR petitions addresses the patent quality dimension of thicket construction. Legislating limits on the number of assertable patents in BPCIA biologic patent dance litigation addresses the scale asymmetry problem. Expanding antitrust scrutiny of hard-switch product hopping addresses the market access distortion. IRA drug price negotiation, PBM transparency requirements, and interoperability between biosimilar interchangeability designation and formulary placement policies address the pricing architecture separately from the patent structure.
The system does not need to be replaced. It needs to be recalibrated at specific stress points where the evidence shows that the grand bargain is being gamed in ways that cost patients and payers measurably more than the innovation incentive requires.
This analysis references real litigation, real regulatory frameworks, and real commercial events. All drug names, company names, court cases, regulatory filings, and data points cited reflect documented public record. Statistical data sourced from FDA, I-MAK, Association for Accessible Medicines, IQVIA, Tufts CSDD, JAMA Network Open, PNAS, Bentley University, and published federal court decisions.