The Unrelenting Mandate for Cost Leadership in a Hyper-Competitive Arena
Welcome to the generic drug market, a global behemoth valued at approximately $491 billion in 2024 and on a trajectory to nearly double, potentially exceeding $926 billion by 2034.1 This explosive growth, fueled by a confluence of factors—aging populations, the rising prevalence of chronic diseases, and government initiatives to curtail healthcare spending—presents an opportunity of immense scale.1 Yet, this opportunity is wrapped in a brutal paradox. The very size of the market attracts a relentless influx of competitors, creating an environment where the primary, and often only, basis for competition is price.
This is the central challenge every generic drug executive must confront. Generic medicines are the workhorses of modern healthcare, accounting for an astonishing 90% of all prescriptions dispensed in the United States, yet they represent a mere fraction—somewhere between 13% and 26%—of the nation’s total prescription drug expenditure.5 This disparity underscores the fundamental business model: high volume, low price. The moment a brand-name drug’s patent expires, the clock starts on a predictable and precipitous price decline. The entry of a single generic competitor can slash the price by nearly 40%. With two competitors, the price falls by more than half. In a crowded market with six or more players, prices can collapse by a staggering 95% from the original brand price.6
This dynamic creates what can only be described as a “Red Queen’s race,” where companies must run faster—becoming ever more efficient—just to maintain their position. In this unforgiving landscape, market leadership is not won by simply capturing market share; it is forged by building a cost structure that can profitably withstand the inevitable price wars that follow every patent expiry.
Therefore, we must reframe our thinking. Cost optimization in the generic drug industry is not a defensive, back-office financial exercise designed to preserve margins. It is the core of an offensive, market-shaping strategy. The company with the lowest sustainable cost of production holds the ultimate competitive weapon. It can not only survive the race to the bottom but can strategically dictate the pace, driving prices to levels that are unprofitable for less efficient rivals, thereby forcing consolidation and securing a dominant market position. This report is your blueprint for building that weapon. We will dissect every component of the production cost structure, from the sourcing of raw materials to the final packaging, and provide a comprehensive playbook of actionable strategies—leveraging advanced technology, operational excellence, and strategic foresight—to transform your cost base into the engine of market domination.
Deconstructing the Battlefield: An Anatomy of Generic Drug Production Costs
To win the war on costs, you must first understand the battlefield. The cost structure of a generic drug is a complex interplay of direct material inputs, sophisticated manufacturing processes, rigorous quality assurance, and intricate supply chains. While executives are often acutely aware of the price they pay for an Active Pharmaceutical Ingredient (API), a truly strategic approach requires a granular understanding of every component that contributes to the final Cost of Goods Sold (COGS). This detailed anatomy reveals not only the most significant cost centers but also the hidden inefficiencies where the greatest opportunities for optimization lie.
The Cost of Goods Sold (COGS): A Granular Breakdown
The journey from raw chemical precursors to a finished, packaged pill involves a series of value-adding steps, each with an associated cost. While the exact percentages can vary based on the drug’s complexity, dosage form, and manufacturing scale, a typical breakdown for a generic oral solid dosage form provides a clear strategic map.
Active Pharmaceutical Ingredient (API): The API is the therapeutic heart of the drug and, without question, the single largest and most volatile component of production cost. It typically accounts for 50% to 52% of the total manufacturing cost.6 The price of an API is not a simple commodity figure; it is a complex function of the chemical synthesis route’s complexity, the cost of raw materials (often tied to commodity prices like petroleum), the geopolitical stability of its country of origin, and the technological sophistication of the manufacturing process.6
Excipients & Formulation: Often referred to as “inactive ingredients,” excipients are anything but. These substances—binders, fillers, disintegrants, coatings—are the silent architects of the drug’s performance, ensuring its stability, proper dissolution, and bioavailability. While individually cheaper than the API, their collective cost is significant. The global pharmaceutical excipients market was valued at over $9.5 billion in 2022 and is projected to grow to nearly $15 billion by 2033, reflecting their critical and costly role in formulation.
Direct Labor: The skilled personnel who operate, monitor, and maintain the production lines represent a direct cost of manufacturing. This includes machine operators, quality control technicians conducting in-process checks, and packaging line workers. Industry data suggests that direct labor typically comprises 10% to 15% of the total manufacturing cost.15
Manufacturing Overhead & Facility Maintenance: This category encompasses the costs of running a state-of-the-art, Good Manufacturing Practices (GMP)-compliant facility. It includes utilities (electricity, water, specialized HVAC systems), depreciation of sophisticated equipment, and routine facility maintenance. These ongoing operational costs generally account for 10% to 20% of total manufacturing expenses.11
Quality Control & Regulatory Compliance: This is a substantial, non-negotiable, and often underestimated cost center. It includes the cost of the quality control laboratory (equipment, reagents, personnel), extensive product testing and validation, stability studies, and maintaining the documentation required for regulatory compliance. Estimates indicate that overall quality-related costs can account for at least 25% of the total manufacturing cost, with compliance activities alone consuming up to 25% of a production site’s operating budget (excluding raw materials).6
Packaging & Logistics: The final steps of enclosing the drug in its primary packaging (blisters, bottles) and secondary packaging (cartons), along with serialization for track-and-trace requirements, contribute to the final cost. This also includes the logistics of moving the finished product through the supply chain, which can involve specialized cold chain handling.16
This quantitative dissection reveals a critical strategic insight. While the API is the most visible and dominant cost driver, nearly half of the production cost is embedded in the processes of converting that API into a finished product. Within these process-dependent costs lies a “hidden factory”—the costs of inefficiency, rework, scrap, and batch failures. These are the Costs of Poor Quality (COPQ), and they represent one of the most significant opportunities for strategic cost reduction. A company that focuses solely on negotiating a lower API price while ignoring the inefficiencies in its own factory is fighting with one hand tied behind its back. A truly dominant cost leader attacks both fronts simultaneously: aggressive and intelligent sourcing of the API, coupled with a relentless pursuit of operational excellence on the factory floor.
The following table provides a strategic dashboard for visualizing this cost structure, connecting each component to its primary drivers and the key optimization levers that will be explored in detail throughout this report.
Cost Component
Typical % of COGS
Key Cost Drivers
Primary Optimization Levers
Active Pharmaceutical Ingredient (API)
50-52%
Synthesis complexity, raw material prices, supplier geography, scale of production.
Strategic sourcing, vertical integration, novel synthesis pathways (AI, Green Chemistry).
The Heart of the Matter: Strategic Sourcing and Synthesis of the API
Given that the Active Pharmaceutical Ingredient represents over half of a generic drug’s production cost, mastering its sourcing and synthesis is the single most impactful strategy for achieving cost leadership. This is not merely a procurement function; it is a complex strategic exercise involving global supply chain management, high-stakes make-or-buy decisions, and the adoption of cutting-edge chemical technologies. The companies that lead in this domain do not simply buy their APIs cheaper; they fundamentally re-engineer the cost, risk, and efficiency of creating the therapeutic core of their products.
Navigating the Global API Supply Chain
The modern pharmaceutical supply chain is a testament to globalization, but its efficiency comes at the cost of fragility. A deep understanding of its geography and dynamics is essential for mitigating risk and optimizing cost.
The supply of APIs for the global generics market is intensely concentrated. India stands as the largest supplier of finished generic drugs to markets like the United States, yet it is critically dependent on China for its own raw materials, sourcing an estimated 70% to 80% of its APIs and key starting materials from its neighbor.18 This creates a precarious, domino-like dependency. For certain essential medicines, such as antibiotics and antivirals, over 90% of the APIs are reliant on imports, primarily from China.
This geographic concentration offers clear cost advantages, leveraging lower labor rates and operational expenses. However, it exposes manufacturers to a host of significant risks. Geopolitical tensions can lead to the sudden imposition of tariffs—as seen with the threat of a 25% U.S. tariff on Chinese imports, which would render many low-margin generics financially unviable for the U.S. market. Furthermore, reliance on a single region creates vulnerability to supply disruptions from natural disasters, industrial accidents, or domestic policy changes in the source country.
To navigate this treacherous landscape, leading companies employ a multi-faceted sourcing strategy:
Supplier Diversification: The most fundamental risk mitigation strategy is to avoid single-sourcing, especially from a single geographic region. Engaging with multiple qualified suppliers across different countries, such as in Europe and emerging markets, fosters competitive pricing through bidding and provides crucial supply chain resilience.
Long-Term Contracts: For critical APIs, establishing long-term agreements with trusted suppliers can lock in favorable pricing and guarantee supply, insulating the company from short-term market volatility and ensuring stability during periods of disruption.
Effective Supplier Relationship Management (SRM): Moving beyond a purely transactional relationship to a strategic partnership can unlock significant value. This involves collaborative efforts on process improvement, value-based negotiations that consider factors beyond price (like quality and delivery reliability), and regular performance monitoring to drive continuous cost improvement.
Lifecycle Costing: A sophisticated approach to procurement looks beyond the initial purchase price. It evaluates the total cost of ownership, factoring in the costs associated with quality, reliability, and sustainability. Paying a slight premium for an API from a supplier with a stellar quality record can prevent millions of dollars in costs down the line from a batch failure or product recall.
The Vertical Integration Dilemma: To Make or To Buy?
One of the most profound strategic decisions a generic company can make is whether to manufacture its own APIs (vertical integration) or purchase them from third-party suppliers. This choice extends far beyond a simple cost-benefit analysis and has deep implications for a company’s competitive and legal strategy.
The classic efficiency motives for vertical integration include ensuring a stable and reliable supply of a critical input, capturing the margin that would otherwise go to the API supplier, and protecting proprietary process knowledge. However, in the generic pharmaceutical industry, the most powerful driver for vertical integration is often strategic.
The Hatch-Waxman Act, which governs generic drug approval in the U.S., created a powerful incentive for generic companies to challenge the patents of brand-name drugs. The first company to file an Abbreviated New Drug Application (ANDA) with a “Paragraph IV certification”—a legal challenge to the innovator’s patent—and win the subsequent lawsuit (or secure a favorable settlement) is granted 180 days of marketing exclusivity. This period, where the market is effectively a duopoly between the brand and the first generic, is exceptionally profitable.
Winning this “race to be first” requires immense speed and coordination. A company must be ready to file its ANDA, complete with all necessary bioequivalence and manufacturing data, on the earliest possible day. This is where vertical integration becomes a formidable strategic weapon. A company with in-house API development and manufacturing capabilities can tightly control the timeline, accelerating the synthesis, formulation, and testing required for the ANDA submission. It eliminates reliance on an external supplier whose timelines and priorities may not be aligned. In markets with these high-stakes patent challenges, the investment in API development becomes highly “relationship-specific”—its value is maximized only if it enables that first-to-file status. Vertical integration internalizes this relationship, aligning incentives and maximizing the probability of securing the 180-day exclusivity prize. This transforms the make-or-buy decision from an operational choice into a cornerstone of legal and commercial strategy.
The Next Frontier of API Synthesis: Technology-Driven Cost Reduction
While strategic sourcing and vertical integration are powerful levers, the most transformative opportunities for cost reduction lie in revolutionizing the very chemistry of API production. Forward-thinking companies are moving beyond optimizing existing synthesis routes and are using advanced technology to design entirely new pathways that are fundamentally cheaper, faster, and more sustainable.
Artificial Intelligence (AI) and Machine Learning: AI is emerging as a game-changer in retrosynthetic analysis—the process of working backward from a target molecule to identify potential starting materials and reaction pathways. Traditional drug synthesis often relies on established, but not necessarily optimal, chemical routes discovered through decades of trial-and-error. AI algorithms can analyze vast databases of chemical reactions and molecular properties to predict and design novel, highly efficient synthesis routes that a human chemist might never conceive.23 These AI-driven methods can evaluate potential pathways based on factors like yield, cost of starting materials, and environmental impact. The results are striking: case studies have demonstrated that AI-driven route optimization can reduce synthesis costs by as much as 30% and cut development time by 50%, by minimizing the number of costly and time-consuming laboratory experiments.
Biocatalysis and Green Chemistry: The principles of green chemistry offer a powerful framework for reducing both environmental impact and production costs. A major cost and waste driver in traditional chemical synthesis is the heavy reliance on harsh, petroleum-based organic solvents, which can account for up to 85% of the total mass of materials used.25 Green chemistry promotes the use of safer, cheaper, and more environmentally benign solvents (like water or ethanol) and the use of catalysts to make reactions more efficient.
Biocatalysis—the use of enzymes as catalysts—is particularly promising. Enzymes operate under mild conditions (ambient temperatures and neutral pH), which dramatically reduces energy consumption compared to traditional high-temperature, high-pressure reactions. They are also highly specific, leading to cleaner reactions with fewer byproducts, which simplifies purification steps and reduces waste.27 The economic benefits are tangible. Pfizer’s implementation of a greener, enzyme-catalyzed synthesis for the antidepressant Zoloft (sertraline) not only eliminated the use of four hazardous reagents but also doubled the overall product yield and eliminated nearly two million pounds of chemical waste. Similarly, Amgen’s greener synthesis for the cancer drug LUMAKRAS™ cut a purification step that generated large amounts of solvent waste, saving an estimated £3.17 million per year while boosting yield.
The convergence of these technologies represents a true paradigm shift. By using AI to discover novel synthesis routes that leverage the efficiency and sustainability of biocatalysis, companies can fundamentally re-engineer the cost structure of their most expensive input. The cost of an API is no longer a semi-fixed variable to be negotiated down; it becomes a dynamic element of the process that can be actively designed and engineered for maximum efficiency and minimal cost. This creates a powerful and sustainable competitive advantage that is incredibly difficult for slower-moving competitors to replicate.
The Modern Factory Floor: Revolutionizing Manufacturing Operations for Unprecedented Efficiency
While optimizing the API is paramount, the factory floor—where that API is transformed into a finished drug product—is a battleground ripe with opportunities for radical cost reduction. The traditional model of pharmaceutical manufacturing, characterized by discrete batch processes and after-the-fact quality testing, is notoriously inefficient. The pharmaceutical industry has historically lagged far behind other high-tech sectors in manufacturing productivity, with reject rates that can be orders of magnitude higher. Leading generic companies are closing this gap by embracing a new manufacturing paradigm built on continuous processing, real-time quality control, intelligent automation, and a deeply embedded culture of operational excellence.
The Paradigm Shift: From Batch Processing to Continuous Manufacturing (CM)
The move from traditional batch manufacturing to Continuous Manufacturing (CM) is arguably the most significant operational shift in the pharmaceutical industry in decades. Understanding the profound differences between these two models is key to unlocking a new level of efficiency.
Traditional Batch Processing: This is the legacy model. A specific quantity of material is processed in a series of separate, sequential steps (e.g., blending, granulating, compressing, coating). Between each step, the process stops, and the intermediate material is held, tested, and stored before moving to the next stage. This stop-and-start approach leads to extremely long production lead times—often measured in weeks or even months—requires large physical footprints to accommodate bulky equipment and extensive in-process inventory, and introduces variability with each new batch.32
Continuous Manufacturing (CM): In a CM process, raw materials are fed continuously into an integrated, end-to-end production line, and the finished product emerges nonstop from the other end. The entire process often takes place in a single, compact facility. The transformation is dramatic. Studies and real-world implementations have shown that CM can reduce capital expenditures by 20% to 76%, lower operating costs by 9% to 40%, and slash the required facility footprint to a fraction of that needed for a batch plant.34 A process that once occupied an entire building can now fit into a single room. This not only reduces capital and operating costs but also significantly cuts energy consumption—by an estimated 20%—and shortens production times from weeks to mere days.32
Despite these compelling advantages, the generic drug industry has been slow to adopt CM. The primary barriers are the high upfront capital investment required for new equipment, the uncertain return on investment (ROI) given the volatile demand and rapid price erosion characteristic of generic markets, and the significant costs and time associated with validating a new process and securing regulatory approval. However, for companies with the strategic foresight to make the investment, CM offers a path to a fundamentally lower and more flexible cost structure that can be a decisive competitive advantage, especially for high-volume products.
The table below provides a strategic comparison, framing the attributes of each manufacturing model in the context of achieving market leadership.
Attribute
Traditional Batch Processing
Continuous Manufacturing (CM)
Strategic Implication for Generic Dominance
Capital Expenditure (CapEx)
High (large equipment, large facilities)
Low to Moderate (smaller, integrated equipment)
Lower barrier to entry for new products; faster capital payback.
Operating Expenditure (OpEx)
High (labor, energy, inventory holding)
Lower (reduced labor, energy, and inventory)
Enables sustainable profitability even in highly eroded price environments.
Facility Footprint
Massive
Compact (often 70% smaller)
Reduces overhead; allows for more flexible, decentralized manufacturing networks.
Product Quality & Consistency
Variable (batch-to-batch variation)
High (real-time monitoring and control)
Reduces risk of batch failures, rework, and recalls (lowers COPQ).
Production Lead Time
Weeks to Months
Days to Hours
Extreme agility to respond to demand fluctuations and prevent drug shortages.
Scalability & Flexibility
Difficult (requires larger equipment)
Easy (run the line for longer)
Ability to precisely match supply to demand, minimizing waste and overproduction.
Regulatory Pathway
Well-established but rigid
Evolving; encouraged by FDA under QbD
Opportunity for pioneers to gain a competitive edge with regulatory support.
Building Quality In: The Role of Process Analytical Technology (PAT)
Process Analytical Technology (PAT) is the nervous system of the modern pharmaceutical factory. It is the enabling technology that makes the benefits of Continuous Manufacturing and Quality by Design (QbD) a reality. PAT represents a fundamental shift from the traditional approach of “testing quality into” a product after it’s made, to a modern paradigm of “building quality in” during the manufacturing process itself.
At its core, PAT is a framework for designing, analyzing, and controlling manufacturing through the real-time measurement of critical process parameters (CPPs) and critical quality attributes (CQAs).36 Instead of taking samples from a batch and sending them to a quality control lab for testing—a process that can take hours or days—PAT uses in-line or on-line sensors (e.g., near-infrared spectroscopy) to monitor attributes like blend uniformity, particle size, and moisture content in real time, directly within the production stream.
The economic benefits of this approach are profound. By providing an instantaneous window into the process, PAT allows for real-time adjustments to keep the process within its validated state, ensuring consistent product quality and preventing deviations before they result in a failed batch. This dramatically reduces scrap, rework, and the immense costs associated with investigating out-of-specification results. Financial analyses have shown that implementing PAT can yield a return on investment greater than 60%. Specific benefits include the ability to cut analytical laboratory labor costs by up to 90%, slash inventory costs by 50% by reducing cycle times, and, when integrated with Lean methodologies, save companies an estimated $6 million to $8 million annually through improved efficiency and reduced waste.
The Power of Automation and AI in Manufacturing
Layered on top of the physical infrastructure of CM and the sensory capabilities of PAT is the intelligence of automation and AI. These technologies optimize both the physical and digital aspects of the factory floor, driving efficiency to new heights.
Automation of Physical Tasks: Robotics and automation are increasingly used to handle repetitive and labor-intensive tasks with greater speed and precision than human operators. This includes automated material handling, robotic “pick and place” systems for packaging, and automated visual inspection systems. The primary benefits are increased throughput, reduced risk of human error and contamination, and lower direct labor costs.
AI-Driven Process Optimization: This is where the most significant value is being created. By analyzing the torrent of real-time data generated by PAT sensors, AI and machine learning algorithms can identify complex patterns that are invisible to human operators.
Predictive Maintenance: AI models can analyze sensor data from equipment (e.g., vibration, temperature) to predict potential failures before they occur. This allows maintenance to be scheduled proactively, reducing unplanned downtime by as much as 50% and avoiding the catastrophic costs of a production line stoppage.40
Golden Batch Analysis: AI can analyze data from thousands of historical batches to identify the precise combination of process parameters that leads to the highest quality and yield—the “golden batch.” This knowledge can then be used to control the process in real-time to consistently replicate these optimal conditions.
Computer Vision for Quality Control: AI-powered camera systems can perform real-time quality checks on tablets and capsules, identifying defects in color, shape, or integrity with superhuman accuracy and speed, improving labor productivity by over 30% compared to manual inspection.
Embracing Operational Excellence: Lean Six Sigma in Practice
Advanced technologies like CM and AI are powerful tools, but they are most effective when implemented within a culture of continuous improvement. Methodologies like Lean Six Sigma provide the systematic framework and problem-solving tools necessary to truly optimize manufacturing operations. Lean focuses on the elimination of “waste” (any activity that does not add value for the customer), while Six Sigma focuses on reducing process variation and defects.
The pharmaceutical industry’s historical reluctance to change validated processes has led to significant inefficiencies. The average reject percentage in pharma manufacturing can be as high as 5-10%, which corresponds to a quality level of less than 2 Sigma. In contrast, the semiconductor industry operates at a 6 Sigma level, with a defect rate of just 3.4 parts per million. This gap represents a multi-billion-dollar opportunity for cost savings.
A compelling case study from a facility manufacturing acetaminophen tablets illustrates the power of this approach.42 The site was facing significant backlogs due to downtime on its packaging lines. Using a structured, 7-step problem-solving methodology rooted in Lean Six Sigma principles, a cross-functional team embarked on a data-driven investigation.
Define & Measure: They analyzed Overall Equipment Effectiveness (OEE) data and identified that “short stops” on the blister packaging lines were the largest source of downtime. Further stratification of the data pinpointed “tablet feed issues” as the primary culprit, with one specific line, C80/2, accounting for a disproportionate share of the problem.
Analyze: Through direct observation on the factory floor (a “Gemba Walk”) and detailed data collection, the team discovered that the feed issues were being caused by broken half-tablets getting lodged in the feed chutes. A “5 Whys” analysis traced the root cause of the breakages to the design of the tablet feed hopper, which was creating excessive pressure on the tablets.
Improve & Control: Instead of a costly and time-consuming project to increase tablet hardness (which would have required re-validation and negatively impacted dissolution), the team devised a simple, elegant engineering solution. They modified the “riddle plate” in the feed system, enlarging its holes to allow broken tablet fragments to be sorted out before they could reach the feed chutes.
The results were transformative. The solution, which cost a mere £30,000 to implement across all affected lines, completely eliminated the tablet feed downtime. This led to conservative annual savings of £388,426, reduced the product backlog into the packaging area by 84%, and improved overall packaging line availability by 11%. This case study perfectly demonstrates that technology alone is not the answer. It is the combination of a rigorous, data-driven methodology like Lean Six Sigma with targeted engineering solutions that unlocks the most profound and profitable improvements in manufacturing efficiency.
The Economics of Excellence: Quality as a Cost Center and Competitive Advantage
In the pharmaceutical industry, quality is not a choice; it is a license to operate. However, a strategic disconnect often exists within organizations. The quality unit is frequently viewed as a pure cost center—a source of overhead and a bottleneck to production—rather than as a driver of value and a source of competitive advantage. This perspective is not only outdated but also financially dangerous. A sophisticated understanding of the “Economics of Quality” reveals that proactive investment in quality systems is one of the most effective cost-reduction strategies a generic company can pursue. It is the key to minimizing the immense and often hidden costs of failure.
The Cost of Quality (COQ) Framework: A Strategic Perspective
The Cost of Quality (COQ) is a management framework that provides a structured way to understand and quantify all quality-related costs. It helps shift the conversation from “quality is expensive” to “poor quality is expensive.” The framework divides costs into two primary categories, which are further broken down into four pillars 6:
1. Cost of Good Quality (COGQ) – Proactive Investments: These are the costs incurred to prevent defects from occurring in the first place.
Prevention Costs: These are the most strategic quality investments. They include the costs of developing a robust quality management system, validating manufacturing processes, training employees on GMP, and conducting quality planning for new products.
Appraisal Costs: These are the costs associated with measuring and monitoring to ensure that standards are being met. They include the costs of raw material testing, in-process and final product inspections, equipment calibration, and conducting internal and supplier audits.
2. Cost of Poor Quality (COPQ) – Reactive Expenses: These are the costs incurred as a result of failures.
Internal Failure Costs: These are the costs of defects that are caught before a product leaves the factory. They include the cost of scrap material, rework or reprocessing of a batch, downtime caused by a quality issue, and the significant labor costs associated with investigating the root cause of an out-of-specification (OOS) result or a batch deviation.
External Failure Costs: These are the most damaging and expensive failures, occurring after a product has reached the market. They include the direct costs of a product recall (logistics, product destruction, customer notifications), handling customer complaints, and warranty claims. More importantly, they include the immense, often unquantified, costs of reputational damage, lost sales, increased regulatory scrutiny (which can lead to warning letters or consent decrees), and potential litigation.
The financial impact of these costs is staggering. Industry analyses suggest that the total Cost of Quality can be as high as 15-20% of a company’s sales revenue, with some estimates reaching as high as 40% of total operations.44 The bulk of this is typically the Cost of Poor Quality, which in a thriving company can still represent
10-15% of its operational costs. This is not overhead; this is a direct drain on profitability that is almost entirely avoidable through smarter investment in prevention and appraisal.
The Iceberg of Failure: Quantifying the True Cost of Poor Quality
The most dangerous aspect of the Cost of Poor Quality is that its most significant components are often hidden. The visible costs of an internal failure—the value of the scrapped material, the hours spent on rework—are just the “tip of the iceberg”. The much larger, submerged costs include the lost production capacity during downtime, the management time consumed by crisis meetings and investigations, the disruption to production schedules for other products, and the impact on employee morale.
This effect is magnified exponentially with external failures. The direct cost of a product recall is substantial, but it pales in comparison to the indirect costs. A single high-profile recall can erode decades of brand trust, lead to a permanent loss of market share, and trigger a cascade of regulatory inspections and legal actions that can cost a company billions in market capitalization and potentially threaten its very existence.
A useful mental model for executives is the “Rule of Ten,” which posits that the cost of fixing a defect increases by a factor of ten at each successive stage of the value chain. A quality issue with a raw material that costs $1 to fix upon receipt will cost $10 to fix if it’s discovered during in-process manufacturing, $100 if the batch has to be rejected at final release, and $1,000 (or more) if the defective product has to be recalled from the market. This simple rule powerfully illustrates the immense ROI of investing in prevention and early detection.
Navigating the Regulatory Maze Efficiently: The ANDA Process as a Cost Lever
Nowhere is the interplay between the Cost of Good Quality and the Cost of Poor Quality more evident than in the regulatory submission process. For generic drugs in the United States, the gateway to the market is the Abbreviated New Drug Application (ANDA). While it is “abbreviated” because it can rely on the brand-name drug’s original safety and efficacy data, the ANDA is still a massive and complex submission that requires exhaustive data demonstrating bioequivalence, detailing every aspect of the manufacturing process, and proving that the product meets all quality standards.49
The regulatory review process itself is a critical cost lever. Before the implementation of the Generic Drug User Fee Amendments (GDUFA) in 2012, the median review time for an ANDA was a lengthy 31 months, with a backlog of thousands of applications. GDUFA, which collects user fees from the industry, provided the FDA with the resources to hire more reviewers and set performance goals, aiming to reduce the standard review time to just 10 months.
However, this timeline is contingent on the quality of the submission. A poorly prepared, incomplete, or inconsistent ANDA will be met with Information Requests (IRs) or, in more serious cases, a Complete Response Letter (CRL), which lists all deficiencies that must be rectified before the application can be approved.53 Each cycle of response and re-review can add many months, or even years, to the approval timeline.
This is where the COQ framework becomes strategically vital. Investing in the resources, expertise, and data integrity to submit a flawless, “first-cycle approval” quality ANDA is a high-return prevention cost. It directly mitigates the risk of incurring a massive external failure cost—not in the form of a product recall, but in the form of the immense opportunity cost of a delayed launch. In the generic market, where profitability is heavily skewed towards the first few entrants, a six-month delay can be the difference between a blockbuster product and an unprofitable one. Companies that treat their regulatory affairs department as a strategic, process-driven function focused on speed and quality, rather than a back-office compliance function, will consistently win the race to market and capture the lion’s share of the value.
From Plant to Patient: Optimizing the Pharmaceutical Supply Chain and Logistics
The journey of a generic drug does not end when it leaves the factory. A complex, global, and highly regulated supply chain is responsible for moving the finished product from the manufacturing site to the pharmacy shelf and ultimately to the patient. This intricate network of distributors, wholesalers, and logistics providers represents a significant cost center and a critical area for optimization. Inefficiencies in the supply chain can lead to excess inventory, wasted product due to expiration, stockouts that result in lost sales, and increased transportation costs. Leading companies are leveraging advanced analytics and lean principles to create supply chains that are not just cost-effective, but also resilient and responsive.
Lean Inventory Management and Demand Forecasting
One of the largest hidden costs in any supply chain is working capital tied up in inventory. For pharmaceuticals, this is compounded by the risk of product expiration, which turns excess inventory from a balance sheet asset into a total loss. The key to minimizing these costs is to precisely match supply with demand.
The Challenge of Demand Volatility: Forecasting demand in the pharmaceutical market is notoriously difficult. It is influenced by a complex web of factors, including seasonal disease patterns, changes in prescribing habits, competitor actions, and the purchasing cycles of large buyers like GPOs and PBMs. Traditional forecasting methods, often based on simple historical averages, are frequently inaccurate, leading to a perpetual cycle of overstocking and stockouts.
AI-Powered Demand Forecasting: This is where Artificial Intelligence is creating a revolutionary leap in capability. By analyzing massive, diverse datasets—including historical sales data, real-world prescription data, epidemiological trends, and even external factors like public health announcements—machine learning algorithms can generate demand forecasts with a level of accuracy that was previously unattainable.56 An accurate forecast is the single highest-leverage optimization point in the entire supply chain. It allows for optimized production scheduling, which in turn enables leaner inventory management.
Lean Inventory Methodologies: Armed with a more reliable forecast, companies can implement lean inventory strategies like pull planning and Just-in-Time (JIT) systems. Instead of “pushing” product into the supply chain based on a speculative forecast, a pull system replenishes inventory based on actual consumption signals from downstream partners. This drastically reduces the amount of inventory held at every node of the supply chain, freeing up working capital and minimizing the risk of obsolescence.
The impact of this shift is a positive cascade effect. An accurate forecast leads to optimized production, which allows for leaner inventory, which results in more efficient warehouse utilization and better transportation planning. Optimizing the flow of information (the forecast) is the most effective way to optimize the flow of the physical product, unlocking cost savings at every subsequent step.
Strategic Packaging and Distribution
The final physical stages of packaging and distribution are rife with opportunities for cost savings through standardization, network optimization, and technology adoption.
Cost Drivers in Logistics: Pharmaceutical logistics are inherently more expensive than those for many other industries. Key cost drivers include the need for temperature-controlled transportation (the “cold chain”) for many products, specialized packaging to protect sensitive drugs, robust security measures to prevent theft and diversion, and the technology required for serialization and track-and-trace compliance.
Optimization Strategies:
Network Modeling: Using supply chain modeling software, companies can analyze their distribution networks to optimize the location of warehouses and determine the most efficient transportation routes and modes (e.g., air vs. ground) to minimize costs while meeting service level requirements.
Standardization: Standardizing packaging components (e.g., cartons, vials, labels) across multiple product lines can generate significant savings through volume purchasing and reduced complexity in packaging operations.
Freight Audit and Payment (FAP): Transportation invoices are complex and prone to errors. Implementing a rigorous FAP system, either in-house or through a third-party provider, can systematically identify and recover overcharges, correct billing errors, and provide valuable data on shipping patterns that can be used to negotiate better rates with carriers. This is a direct and often immediate source of cost savings.
Logistics Partnerships: For many generic companies, logistics is not a core competency. Partnering with a specialized third-party logistics (3PL) or fourth-party logistics (4PL) provider can provide access to their scale, technology, and expertise. These partners can manage a company’s entire logistics function, from warehousing to transportation, often at a lower cost and with greater efficiency than could be achieved in-house.
By treating the supply chain not as a series of disconnected transactions but as an integrated system, and by applying the same principles of data-driven analysis and continuous improvement used on the factory floor, generic companies can transform this critical function from a major cost center into a source of significant competitive advantage.
The Competitive Playbook: Lessons from the Market Leaders
Theory and strategy are essential, but the ultimate test of any business model is its real-world application. By examining the strategies of the leading players in the generic and biosimilar space, we can distill actionable lessons and identify distinct archetypes of success. The giants of the industry—Teva, Sandoz, and Sun Pharma—each offer a unique masterclass in leveraging cost optimization and operational scale to achieve and maintain market dominance.
Teva Pharmaceuticals: The “Pivot to Growth” and Generics as a Powerhouse
Teva Pharmaceutical Industries, long the undisputed giant of the generics world, provides a compelling case study in how a legacy generics business can be optimized to fuel a strategic transformation. Facing years of declining sales and mounting challenges, the company launched its “Pivot to Growth” strategy in 2023 under new leadership.
The Strategy: The core of Teva’s strategy is to stabilize and grow its massive generics business, using it as a robust, cash-generating “powerhouse” to fund a strategic pivot towards higher-margin innovative medicines.59 This hybrid model recognizes that the scale and cash flow of the generics arm are critical strategic assets.
Cost Optimization as the Engine: A central pillar of this strategy is a massive operational efficiency program aimed at generating approximately $700 million in net savings by 2027.59 This is not a superficial cost-cutting exercise; it is a fundamental modernization of the organization. Key initiatives include streamlining the global manufacturing network, with plans to reduce the number of sites from 35 to 30, optimizing external spending, and simplifying the organizational structure to improve agility and reduce overhead.59
Strategic Focus in Generics: While streamlining operations, Teva is not abandoning its leadership in generics. Instead, it is focusing its pipeline on higher-value opportunities, particularly complex generics and biosimilars. The company boasts a pipeline of 13 biosimilars with five potential launches planned by 2027, which are expected to more than double the revenue of the biosimilar business in the coming years.58
Teva’s playbook illustrates the “Diversified Hybrid” archetype: leveraging the scale and efficiency of a world-class generics operation to de-risk and fund the high-cost, high-reward pursuit of pharmaceutical innovation.
Sandoz: Pure-Play Excellence and Margin Expansion
Following its spin-off from Novartis, Sandoz has emerged as a formidable pure-play leader in generics and biosimilars. Without a branded innovation arm to support, Sandoz’s strategy is a laser-focused pursuit of operational excellence and profitable growth within the off-patent market.
The Strategy: As an independent entity, Sandoz is rigorously focused on driving sustainable top-line growth while aggressively expanding its profit margins. The company has set an ambitious target to reach a core EBITDA margin of 24-26% by 2028, a significant increase from its current levels.62
Levers for Margin Expansion: Sandoz’s path to higher profitability is built on a foundation of comprehensive cost optimization. Key strategic levers include:
Supply Chain and Network Optimization: Enhancing the efficiency of its manufacturing network through consolidation, focused vertical integration for key products, and aggressive procurement optimization.
Organizational Efficiency: Implementing a leaner, more agile operating model to reduce overhead and improve decision-making speed.
Portfolio and Mix Shift: Actively managing its product portfolio to shift towards higher-value, higher-margin products like biosimilars and complex generics.
Proven Results: This focus on operational efficiency is already bearing fruit. The company has demonstrated its ability to manage costs effectively, achieving an increase in its operating profit margin from 10.1% to 11.7% and a 4% reduction in COGS relative to revenue in 2022, even before its full strategic plan is implemented.
Sandoz exemplifies the “Pure-Play Optimizer” archetype: a company dedicated to being the best-in-class operator in the generics and biosimilars space, winning not by diversifying but by achieving unparalleled efficiency and cost leadership within its chosen field.
Sun Pharma: Leadership Through Strategic M&A and Vertical Integration
Sun Pharmaceutical Industries, India’s largest pharmaceutical company, has built its global leadership position on a different model: strategic acquisitions to achieve massive scale, coupled with a deep commitment to vertical integration.
The Strategy: Sun Pharma’s growth has been punctuated by bold, strategic M&A. Its landmark $4 billion acquisition of Ranbaxy Laboratories in 2014 was a transformative move that instantly created the world’s fifth-largest generic company. This strategy is about more than just buying revenue; it’s about acquiring scale, market access, a broader product portfolio, and the opportunity to rationalize the combined manufacturing footprint for greater efficiency.
Cost Leadership through Scale and Integration: A core tenet of Sun Pharma’s competitive strategy is cost leadership, which it pursues through two primary avenues:
Operational Efficiencies: Like its peers, the company focuses on improving manufacturing processes, rationalizing R&D spending, and reducing fixed costs.
Vertical Integration: Sun Pharma places a particularly strong emphasis on backward integration into API manufacturing. By controlling its own API supply, the company achieves significant cost competitiveness, ensures supply reliability, and reduces its vulnerability to external market shocks—a critical advantage given the supply chain’s concentration in China.
Sun Pharma represents the “Scale-Driven Consolidator” archetype. Its playbook demonstrates how market leadership can be systematically built through the strategic acquisition and integration of assets, leveraging the resulting economies of scale and supply chain control to establish a dominant cost position.
These three case studies reveal that while the goal—cost leadership—is universal, the strategic pathways to achieving it can differ. Whether through a hybrid model, pure-play optimization, or scale-driven consolidation, the common thread is a relentless, C-suite-level focus on transforming the cost structure into a strategic weapon. A company’s optimal path will depend on its unique corporate structure, risk appetite, and core competencies, but the lessons from these leaders provide a clear framework for strategic evaluation.
The Strategic Starting Point: Leveraging Patent Intelligence for Market Entry
In the high-stakes world of generic pharmaceuticals, the race for market dominance begins long before the first pill is manufactured. It starts with a single, critical decision: which drug to pursue? This choice, more than any other, will determine the ultimate profitability and success of the venture. Making the right decision requires a deep, nuanced understanding of the complex and dynamic intellectual property landscape. Therefore, the first and most crucial step in any cost optimization strategy is the investment in high-quality patent intelligence.
Patent Intelligence as the First Step in Cost Optimization
The entire business model of the generic drug industry is predicated on the expiration of patents. The lifecycle of a generic product begins the moment a brand-name drug’s patent portfolio becomes vulnerable to challenge or expiry. A generic company’s ability to accurately identify these opportunities and strategically plan its market entry is the foundation of its commercial success.
The Paragraph IV Challenge and the 180-Day Exclusivity Prize: As discussed, the Hatch-Waxman Act provides a powerful incentive for generic companies to be the first to challenge a brand’s patents. Winning this race and securing the 180-day exclusivity period can generate hundreds of millions of dollars in revenue, creating a period of exceptionally high profitability before the market becomes fully commoditized.22 Identifying the best candidates for these Paragraph IV challenges—products with patents that may be weak or invalid—is a critical strategic function.
The High Cost of a Wrong Bet: The stakes are enormous. The average expenditure to develop a generic drug, including formulation and bioequivalence studies, ranges from $2 million to $10 million.6 Embarking on a patent challenge adds another $5 million to $10 million in legal fees. A failed attempt—pursuing a drug with a robust patent that is upheld in court—can result in a total loss of this investment and zero revenue.
This reality reframes the role of patent analysis. It is not merely a legal due diligence function; it is the most fundamental act of capital allocation and risk management a generic company undertakes. An investment in superior patent intelligence is the highest-leverage “prevention cost” an organization can make. By meticulously selecting the right products to pursue—those with the highest probability of a successful patent challenge, a clear regulatory pathway, and favorable market dynamics—a company avoids wasting tens of millions of dollars on R&D, legal fees, and manufacturing scale-up for a product that is doomed to fail.
“The U.S. Food and Drug Administration (FDA) has found that increased competition from generic drug manufacturers is associated with much lower prices for pharmaceuticals. Given that IP rights can deter or delay the market entry of generic drug or biosimilar competition, and thus may allow the rights holder to charge higher-than-competitive prices, some see changing IP rights as a potential way to lower prices for pharmaceutical products.”
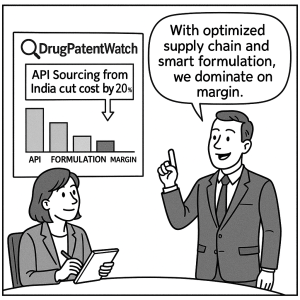
This is where specialized business intelligence platforms become indispensable strategic tools. Services like DrugPatentWatch provide the critical data and analytics necessary to execute a sophisticated market entry strategy. These platforms allow companies to systematically monitor the patent landscape, receive alerts on upcoming expirations, track ongoing litigation for specific drugs, analyze the strength and complexity of a brand’s “patent thicket,” and identify the most promising “first-to-file” opportunities.22 By leveraging such tools, companies can transform the high-risk, high-reward gamble of patent challenges into a calculated, data-driven business process. This ensures that precious R&D and capital resources are deployed with the highest probability of generating a return, optimizing the entire downstream investment before a single dollar is spent in the lab or the factory.
The Future of Cost Optimization: AI, Sustainability, and the Next Generation of Generics
The relentless pursuit of efficiency in the generic drug industry is entering a new and transformative phase. The cost optimization strategies of the future will be defined by the convergence of powerful digital technologies, a growing imperative for environmental sustainability, and a strategic shift towards more complex and higher-value products. Companies that anticipate and master these trends will not only lower their costs but will also build more resilient, intelligent, and competitive operations for the decades to come.
The Rise of the “Digital Twin”: AI-Powered End-to-End Optimization
Artificial Intelligence and Machine Learning are no longer futuristic concepts; they are practical tools being deployed across the entire pharmaceutical value chain, creating a pathway to a fully integrated, digitally optimized manufacturing ecosystem.
AI Across the Value Chain: As we have seen, AI is making a significant impact at every stage. In R&D, it is accelerating the design of more efficient API synthesis routes and predicting formulation behavior to reduce costly bioequivalence study failures. On the factory floor, it is enabling predictive maintenance, optimizing manufacturing processes in real-time, and automating quality control.41 In the supply chain, it is delivering unprecedented accuracy in demand forecasting.
The “Digital Twin” Concept: The ultimate expression of this digital transformation is the “digital twin.” This involves creating a highly detailed, dynamic virtual replica of the entire manufacturing process, from raw materials to the finished product. This virtual model is continuously fed with real-time data from sensors on the physical production line. The digital twin allows a company to simulate process changes, predict the impact of raw material variability, and optimize parameters in a virtual environment before implementing them in the real world. This capability to test and de-risk in silico dramatically accelerates process development, reduces the need for expensive pilot-scale runs, and enables a level of process understanding and control that is simply not possible with traditional methods.
Sustainability as a Cost Driver and a Brand Differentiator
The pharmaceutical industry, with its high consumption of energy, water, and solvents, has a significant environmental footprint. Historically, sustainability has been viewed as a compliance issue or a corporate social responsibility initiative. Today, it is increasingly being recognized as a key driver of both cost efficiency and competitive advantage.
The ROI of Green Chemistry: As the case studies from Pfizer and Amgen demonstrate, implementing the principles of green chemistry is not an act of corporate altruism; it is a sound business decision.29 By designing processes that use less energy, switch to cheaper and safer solvents, and generate less waste, companies directly reduce their operating costs for utilities and hazardous waste disposal. A McKinsey analysis suggests that implementing green-chemistry principles has the potential to reduce a manufacturer’s emissions by about 30%.
Market and Investor Pressure: The strategic calculus is also shifting due to external pressures. There is a growing movement among institutional investors towards “sustainable, responsible, and impact” (SRI) investing. Companies that can demonstrate a strong commitment to environmental stewardship and a lower carbon footprint may find it easier to attract capital. Furthermore, as payers and healthcare systems become more environmentally conscious, a strong sustainability record can become a valuable brand differentiator, influencing purchasing and formulary decisions.
The Evolving Generic Landscape: Complex Generics and Biosimilars
The traditional generic market for simple, oral solid dosage forms is becoming increasingly commoditized. In response, many leading companies are strategically shifting their focus towards more complex products that offer higher barriers to entry and more sustainable profit margins. This includes complex generics (e.g., long-acting injectables, drug-device combinations) and biosimilars (generic versions of biologic drugs).
This strategic shift fundamentally alters the cost optimization equation.
Higher Barriers, Higher Costs, Higher Margins: The development of these products is an order of magnitude more complex and expensive. Developing a simple generic may cost $2 million to $10 million, whereas developing a biosimilar can cost $100 million to $250 million and take 7 to 8 years. This is because biosimilars, which are produced in living cell systems, cannot be proven to be chemically identical to the originator biologic. Instead, they must be proven to be “highly similar” with “no clinically meaningful differences,” a standard that requires extensive analytical, preclinical, and often large-scale comparative clinical trials.
The Cost Equation Shifts: For these high-value products, the primary cost optimization challenge is not about shaving pennies off the per-unit cost of a high-volume commodity. Instead, the focus shifts to de-risking the complex and expensive development process. The key is to leverage advanced science, sophisticated analytical capabilities, and meticulous process control to ensure manufacturing consistency and achieve regulatory approval on the first attempt. A failed clinical trial or a manufacturing batch that does not meet the exacting similarity standards for a biosimilar can wipe out the entire multi-million-dollar investment. In this arena, the most important cost-saving measure is getting the science and manufacturing right the first time.
The future of the generic industry will belong to those who can master this dual challenge: driving down the cost of traditional generics to commodity levels through technology and operational excellence, while simultaneously mastering the complex science and manufacturing required to succeed in the higher-margin world of complex generics and biosimilars.
Conclusion: Forging Market Dominance Through Cost Leadership
The generic pharmaceutical market operates under a simple, yet unforgiving, set of rules. It is a landscape defined by immense scale, relentless competition, and the inexorable force of price erosion. In this environment, the path to market dominance is not paved with clever marketing or incremental product features; it is built on the bedrock of a superior cost structure. This report has laid out a comprehensive blueprint for achieving that cost leadership, demonstrating that optimizing production costs is not a tactical financial goal but the central, driving force of a winning competitive strategy.
The journey begins before a single molecule is synthesized, with the strategic use of patent intelligence to select the right market entry opportunities, transforming a high-risk legal gamble into a calculated business decision. It then moves to the heart of the cost structure: the Active Pharmaceutical Ingredient. Here, leadership is achieved through a sophisticated combination of global strategic sourcing, the calculated use of vertical integration as a competitive weapon, and the adoption of transformative technologies like AI and green chemistry to fundamentally re-engineer the cost of synthesis.
On the factory floor, the paradigm has shifted. The future belongs to those who replace the inefficiencies of traditional batch processing with the agility and precision of Continuous Manufacturing, enabled by the real-time insights of Process Analytical Technology and the intelligence of AI-driven automation. These powerful technologies, when guided by the rigorous, problem-solving discipline of Lean Six Sigma, can unlock unprecedented levels of efficiency and quality.
This pursuit of excellence extends to the very definition of quality, which must be viewed not as a cost center but as a critical driver of value. By embracing the Cost of Quality framework, companies can make proactive investments in prevention and appraisal to avoid the catastrophic and often hidden costs of internal and external failures. Finally, this operational excellence must extend beyond the factory walls into the supply chain, where AI-powered demand forecasting and lean logistics can minimize waste and ensure the seamless flow of products from plant to patient.
The lessons from market leaders like Teva, Sandoz, and Sun Pharma are clear: while the strategic archetypes may differ, the underlying principle is the same. They have all made a deliberate, C-suite-level commitment to transforming their cost structure into their most potent strategic asset. For the executives and strategists navigating this challenging market, the message is unequivocal: you do not need to merely compete on price; you must win on cost. The strategies outlined in this report provide the tools to do just that—to build an operation so efficient, so agile, and so cost-effective that it not only survives the competitive pressures but thrives on them, forging a lasting position of market dominance.
Key Takeaways
Cost Leadership is an Offensive Strategy: In the generic drug market, where price erosion is severe and predictable, the lowest-cost producer can strategically set market prices, making it unprofitable for competitors and securing a dominant market share. Cost optimization is a market-shaping weapon, not just a margin-protection tool.
The API is the Primary Target, but Not the Only One: The Active Pharmaceutical Ingredient (API) accounts for over 50% of production costs and must be a primary focus for optimization through strategic sourcing, vertical integration, and novel synthesis technologies like AI and green chemistry. However, nearly half of all costs reside in manufacturing processes, where a “hidden factory” of inefficiency and poor quality presents a massive opportunity for savings.
The Future of Manufacturing is Continuous, Intelligent, and Lean: The transition from traditional batch processing to Continuous Manufacturing (CM), enabled by Process Analytical Technology (PAT) and optimized by AI, offers a step-change in efficiency, reducing capital costs, operating expenses, and production timelines. This technological shift is most effective when implemented within a culture of operational excellence guided by methodologies like Lean Six Sigma.
Proactive Quality Investment is a Powerful Cost-Reduction Tool: Viewing quality as a cost center is a strategic error. The Cost of Poor Quality (COPQ)—including scrap, rework, recalls, and launch delays—can represent 10-15% of a company’s operational costs. Proactive investments in prevention and appraisal, such as ensuring a first-cycle approval for an ANDA submission, yield a massive return by avoiding these catastrophic failure costs.
Patent Intelligence is the Highest-Leverage First Step: The most critical financial decision in the generic drug lifecycle is choosing which product to develop. Investing in high-quality patent intelligence from platforms like DrugPatentWatch to identify the opportunities with the highest probability of legal and commercial success is the most effective way to optimize the entire downstream investment in R&D, legal, and manufacturing.
The Cost Equation is Evolving: For traditional generics, the goal is to drive down the per-unit cost of a high-volume commodity. For the growing market of complex generics and biosimilars, which have development costs that are 10-100x higher, the strategic focus shifts to de-risking the complex science and manufacturing process to ensure success on the first attempt.
Frequently Asked Questions (FAQ)
1. How does the rise of biosimilars, with their much higher development costs, change the traditional cost-optimization playbook for generic companies?
The rise of biosimilars fundamentally shifts the cost-optimization playbook from a focus on unit cost reduction to a focus on development risk mitigation. For a simple oral solid generic costing $2-10 million to develop, the strategy is about shaving fractions of a cent off each pill through manufacturing scale and efficiency.6 For a biosimilar costing $100-250 million, the financial leverage is entirely different. The primary goal is to ensure the massive upfront investment succeeds. Cost optimization here means:
Investing heavily in advanced analytics to meticulously characterize the reference biologic and de-risk the reverse-engineering of the manufacturing process.
Utilizing Quality by Design (QbD) and PAT from day one to build a deep, predictive understanding of the process, minimizing the risk of a batch failure that could derail the entire program.
Optimizing clinical trial design through AI and modeling to ensure the comparative clinical study (often the most expensive part) is successful on the first attempt. The failure of a single biosimilar program can have a material impact on a company’s finances, so the “cost” to be optimized is the probability of failure itself.
2. What is the realistic ROI timeframe for a mid-sized generic company investing in Continuous Manufacturing (CM), and what is the single biggest risk to that investment?
The ROI timeframe for a CM investment is highly variable but typically falls in the 5-10 year range. It is a long-term strategic play, not a short-term cost-cutting tactic. The initial capital outlay is significant, and realizing the full operating cost benefits (lower energy, labor, and inventory) takes time as the process is scaled and multiple products are brought online. The single biggest risk to this investment for a generic company is product portfolio volatility. CM lines are often most efficient when dedicated to a smaller range of high-volume products. If the market for the product(s) designated for the CM line collapses faster than expected due to intense competition, or if the company fails to win key supply contracts, the line may become underutilized. An underutilized CM facility can be more expensive to run than a flexible, fully depreciated batch facility. Therefore, the investment decision must be tightly linked to a long-range commercial forecast and a portfolio strategy that guarantees sufficient volume to “feed the machine.”
3. Beyond API price, what is the most overlooked yet impactful area for cost reduction in generic manufacturing?
The most overlooked yet impactful area for cost reduction is the Cost of Poor Quality (COPQ), specifically the costs associated with investigations and delays. When a batch deviates or a test result is out-of-specification, the visible cost is the potential loss of the batch. However, the invisible costs are far greater: the hours of highly skilled labor from quality, manufacturing, and engineering personnel dedicated to investigating the root cause; the disruption to the production schedule for all other products; and, most critically, the potential delay in product release and launch.45 By investing in robust processes, PAT, and a strong quality culture (Prevention Costs), companies can drastically reduce the frequency of these investigations. The savings are not just in materials but in freeing up the organization’s most valuable resource—its expert talent—to focus on value-adding activities instead of firefighting.
4. How can a smaller generic company use AI and data analytics to compete with larger, more established players that have greater economies of scale?
AI and data analytics can be a powerful “asymmetric” weapon for smaller companies to compete against larger rivals. While they may not be able to match the scale-based cost advantages in manufacturing, they can use data to be smarter and faster. Key strategies include:
Niche Product Selection: Using AI to analyze patent landscapes, clinical trial data, and real-world evidence to identify complex or niche generic opportunities that larger companies might overlook. These products often have fewer competitors and more stable pricing.
Formulation Acceleration: Leveraging ML models to predict optimal formulations can dramatically reduce the number of lab experiments and shorten development timelines, allowing a smaller, more agile company to potentially beat a larger, more bureaucratic competitor to market.
Hyper-Efficient Operations: A smaller company can implement advanced process controls and AI-driven predictive maintenance on a smaller scale, potentially achieving a higher OEE and lower scrap rate on its specific lines than a larger company with a vast, less-optimized network. They can be a “boutique” efficient producer rather than a mass-market one.
5. With increasing pressure to onshore manufacturing for supply chain security, how can U.S.-based generic producers remain cost-competitive against overseas manufacturers?
Remaining cost-competitive while manufacturing in a high-cost country like the U.S. is a significant challenge that requires a fundamental shift away from competing on labor costs. The strategy must be to compete on technology and efficiency. U.S.-based producers can achieve this by:
Embracing “Lights-Out” Manufacturing: Investing heavily in automation, robotics, and AI to create highly automated facilities that require minimal direct labor. The goal is to reduce the labor cost component of COGS to a negligible percentage.
Leveraging Continuous Manufacturing: CM’s smaller footprint and higher energy efficiency can offset higher construction and utility costs in the U.S. The agility of CM also allows for rapid response to domestic demand, reducing the need for large, costly inventories and long-distance shipping.32
Focusing on Quality as a Differentiator: By manufacturing domestically under direct FDA oversight and promoting a “Made in the USA” quality seal, producers can appeal to payers and health systems concerned about the quality and reliability of overseas supply chains, potentially commanding a slight price premium or securing preferential contract terms.79
The strategy is to replace the labor cost advantage of overseas competitors with a technology and quality advantage at home.
Green Chemistry Approaches in Pharmaceutical Synthesis: Sustainable Methods for Drug Development – MDPI, accessed August 1, 2025, https://www.mdpi.com/2673-9623/5/2/13
Economic Analysis of Integrated Continuous and Batch Pharmaceutical Manufacturing: A Case Study | Industrial & Engineering Chemistry Research – ACS Publications, accessed August 1, 2025, https://pubs.acs.org/doi/10.1021/ie2006752