Every year, pharmaceutical executives sit in board rooms and learn that a product generating hundreds of millions of dollars in annual revenue will, within 36 months, face the first generic or biosimilar entrant. Some of them knew it was coming and had already built a pipeline offset. Most had not.
Loss of exclusivity (LOE) is the most predictable catastrophe in business. Patent expiration dates are public. Generic filing timelines follow known patterns. Biosimilar development curves are observable years in advance. And yet, the pharmaceutical industry has an enduring habit of treating LOE as a future problem until it becomes a present crisis.
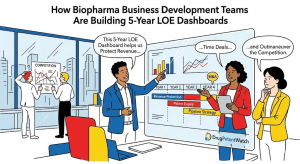
The best business development (BD) teams in biopharma are changing that. They are building structured, data-driven LOE exposure dashboards that project revenue at risk across a rolling 5-year window — and they are using those dashboards not just to manage risk, but to drive deal origination, set licensing priorities, and negotiate from a position of clarity rather than fear.
This article explains how those dashboards work, what data they require, how leading intelligence platforms like DrugPatentWatch power them, and what separates a genuinely useful LOE dashboard from a spreadsheet that collects dust.
The Scale of the Problem Is Not Abstract
Between 2025 and 2030, the pharmaceutical industry will see patent protection expire on branded drugs generating an estimated $300 billion in cumulative global revenue [1]. That figure is not a projection based on optimistic assumptions. It is derived from publicly available patent records, historical generic entry timelines, and known product revenues.
The so-called “patent cliff” is actually a series of rolling exposures. Some years will be worse than others — 2026 and 2028 are particularly heavy — but no year in the next decade offers meaningful relief for a diversified biopharma portfolio.
“The patent expiration window from 2025 to 2030 will see over $300 billion in branded drug revenue exposed to generic and biosimilar competition, with large-molecule biologics accounting for a growing share of that total.” — IQVIA Institute for Human Data Science [1]
The composition of that LOE wave has shifted. Small-molecule generic competition, which operates under well-understood Hatch-Waxman mechanics, now shares the stage with biosimilar competition for large-molecule biologics. Biosimilar market dynamics are less predictable — uptake curves vary by therapeutic area, payer behavior, and interchangeability designations — which makes 5-year LOE modeling for biologics considerably more complex than it was for traditional pharmaceuticals.
That complexity is precisely why manual analysis falls short, and why biopharma BD teams are investing in systematic dashboard infrastructure.
What LOE Exposure Actually Means for a Business Development Team
Before getting into dashboard architecture, it is worth being precise about why BD teams — as opposed to commercial or finance teams — are the primary consumers of LOE data.
BD teams operate at the intersection of two pressures. On one side, they are accountable for acquiring or licensing assets that can replace revenue currently at risk from patent expiration. On the other side, they are competing against other buyers for the same finite pool of attractive assets. Their ability to originate and close the right deals depends heavily on their view of the competitive landscape and their own portfolio’s vulnerability.
LOE exposure data does four specific things for a BD team:
It quantifies the revenue gap that deals need to fill. Without a projected revenue-at-risk figure, there is no rational basis for deal size, upfront payment, or milestone structure.
It identifies the therapeutic areas where the company needs new assets, because LOE exposure is rarely distributed evenly across a portfolio. A company losing 40% of its oncology revenue to patent expiry between 2026 and 2028 has a different BD mandate than one whose LOE exposure sits in mature primary care drugs.
It creates timing urgency that helps prioritize a long list of potential deals. If a company’s largest asset faces its first generic in 18 months, that reality should compress the deal review timeline for its most likely successor.
It provides leverage in negotiations. A seller who understands your LOE exposure better than you do will extract a premium for urgency. A BD team that has done its homework can resist that extraction.
The Data Architecture of a 5-Year LOE Dashboard
Building a LOE exposure dashboard that is actually useful requires assembling several data types that do not come from any single source. The core components are patent data, revenue data, competitive intelligence on generic and biosimilar development pipelines, and scenario modeling parameters.
Patent Data: The Foundation
The dashboard starts with patent expiration data. For every product in the portfolio, you need to know the relevant exclusivity dates — not just the primary composition-of-matter patent, but the full Orange Book or Purple Book patent landscape, including method-of-use patents, formulation patents, and any regulatory exclusivities (data exclusivity, pediatric exclusivity, orphan drug exclusivity) that extend effective protection beyond the primary patent.
This is not a trivial data collection exercise. A single branded drug can have a dozen or more listed patents with different expiration dates. The legally effective exclusivity date — the date on which a generic applicant could realistically receive approval and launch — depends on a combination of the last-expiring patent, any paragraph IV litigation outcomes, and applicable regulatory exclusivity periods.
DrugPatentWatch is one of the most comprehensive platforms for this kind of patent intelligence. It tracks Orange Book patent listings, patent term extensions, exclusivity periods, and Paragraph IV certification filings for thousands of drugs across the U.S. market. When BD teams need to understand not just when a patent expires but when a competitor is likely to enter the market, DrugPatentWatch’s litigation tracking and ANDA (Abbreviated New Drug Application) filing data provides the additional layer of competitive intelligence needed to generate realistic entry timelines.
The distinction matters. A patent that expires in 2027 may face generic entry in 2026 if a Paragraph IV challenge succeeds. It may face no entry until 2029 if the formulation patent and a pediatric exclusivity period extend protection. Neither extreme shows up in a simple patent expiration date lookup.
Revenue Data: Attaching Financial Weight
A patent expiration is only strategically meaningful if you know how much revenue it puts at risk. For internal portfolio planning, this means attaching current and projected revenue figures to each product and modeling the expected revenue decline curve under generic or biosimilar competition.
Generic entry typically causes rapid and severe revenue erosion for small molecules. Historical data across Hatch-Waxman patent expirations shows that branded drugs can lose 80 to 90 percent of their revenue within 12 months of multi-source generic entry [2]. The rate of decline is driven by the number of generic entrants, the degree of formulary substitution by payers, and whether the originator maintains a branded segment through co-pay card programs or alternative formulations.
Biosimilar erosion curves are flatter. The average branded biologic that faced biosimilar competition between 2015 and 2023 retained approximately 50 to 60 percent of its pre-biosimilar unit volume two years after first competitive entry [3]. That figure varies widely depending on therapeutic category — Humira’s U.S. erosion has been steep, while other biologics have maintained more durable market positions through contracting strategies.
A 5-year LOE dashboard needs both types of curves as modeling inputs. Hard-coding a single revenue decay assumption underestimates the range of outcomes and produces false precision that misleads strategic decisions.
Generic and Biosimilar Pipeline Intelligence
The third data layer is competitive pipeline intelligence: who is developing generics or biosimilars against your products, how far along are they, and when are they likely to receive approval.
For small molecules, this data comes primarily from FDA ANDA filings and Paragraph IV certification notifications. When a generic applicant files a Paragraph IV certification asserting that your patent is invalid or will not be infringed, you receive notice of that filing within 20 days [4]. That notification is the starting gun for a 30-month litigation stay — and it is publicly observable by anyone monitoring FDA records.
DrugPatentWatch aggregates this information systematically, allowing BD teams to see the current state of generic development activity against any Orange Book-listed product. The platform tracks first-to-file status, which matters because the first Paragraph IV filer for a given drug has the right to 180 days of generic exclusivity — a period that creates a temporary duopoly and moderates but does not eliminate the revenue impact of generic entry.
For biologics, biosimilar development intelligence requires monitoring the FDA’s Biosimilar Product Development (BPD) meetings, 351(k) application filings, and interchangeability designations. The European Medicines Agency (EMA) approval timeline is also a leading indicator for U.S. biosimilar entry, as sponsors frequently pursue parallel regulatory approval.
Modeling Parameters: Turning Data Into Decisions
The fourth component is scenario modeling. A static dashboard showing patent expiration dates and revenue figures is useful for reporting. A dashboard with scenario modeling is useful for decisions.
Useful scenario parameters include:
Best-case and worst-case patent litigation outcomes for products with active Paragraph IV challenges
Generic entrant count scenarios (first-mover duopoly vs. immediate multi-source competition)
Biosimilar uptake rate assumptions by therapeutic area and payer mix
Pipeline offset assumptions for products in late-stage clinical development
When these scenarios are built into the dashboard, a BD team can run a simple sensitivity analysis: “If we lose this litigation and face generic entry in 2026 rather than 2028, how does our revenue-at-risk figure change, and how does that affect the strategic priority of this licensing deal we are evaluating?”
Building the Dashboard: Architecture Options
There are three practical approaches to building a 5-year LOE exposure dashboard, and the right choice depends on a company’s data infrastructure, internal analytical capacity, and budget.
Embedded BI Tools with External Data Feeds
The most common approach in mid-to-large biopharma companies is to use a business intelligence platform — Tableau, Power BI, or Looker — and feed it with patent data from DrugPatentWatch or a comparable service via API, revenue data from internal financial systems, and pipeline data from commercial databases like Evaluate Pharma, IQVIA, or Citeline.
This approach is flexible and scalable. Once the data pipelines are established, the dashboard auto-refreshes as new information arrives. BD teams can build views tailored to their specific questions — by therapeutic area, by geography, by deal type — without waiting for an analyst to generate a custom report.
The setup cost is real. Cleaning and harmonizing data from multiple sources requires careful data engineering, particularly around drug name normalization (a product can appear under dozens of brand and generic names across different databases) and patent identifier mapping. Companies that underinvest in that plumbing spend more time debugging data quality than making decisions.
Specialized Pharma Intelligence Platforms
Several commercial platforms are now purpose-built for LOE exposure tracking, combining patent data, competitive intelligence, and financial modeling in a single environment. These platforms reduce the data integration burden but introduce dependency on a vendor’s coverage breadth and update frequency.
DrugPatentWatch offers structured data exports and API access that make it a common data backbone for these specialized builds. The platform’s coverage extends to patent term extensions, regulatory exclusivities, ANDA filings, and biosimilar development tracking — covering most of the patent data layer without requiring BD teams to manually parse FDA databases and Orange Book updates.
The practical advantage of DrugPatentWatch’s structured data is that it is maintained as a living dataset: when a new Paragraph IV certification is filed, when a patent is invalidated in litigation, when an ANDA receives tentative approval — these events update in the platform without requiring a team to monitor multiple federal registries independently.
Spreadsheet-Based Models (And Their Limits)
The honest answer is that a meaningful fraction of biopharma BD teams still manage LOE exposure in Excel. When the portfolio is small and the team is resource-constrained, a well-built spreadsheet can capture the core elements: patent expiration dates, revenue forecasts, scenario toggles, and a 5-year revenue-at-risk summary.
The limitations are practical, not conceptual. Excel models do not auto-refresh. They require manual updates when patent litigation outcomes change or new ANDA filings appear. They do not scale to large portfolios without becoming fragile. And they create version control problems the moment more than one person is editing them.
For companies evaluating their options, a reasonable intermediate step is to use DrugPatentWatch to generate structured patent and competitive intelligence data exports, load that data into Excel on a monthly refresh cycle, and then invest in a proper BI integration as the portfolio grows.
What the Dashboard Should Show: The Five Core Views
A 5-year LOE exposure dashboard that BD teams will actually use needs to answer five questions at a glance. Each question maps to a specific visual module.
Revenue at Risk Over Time
The primary view is a stacked bar or area chart showing projected revenue at risk from LOE by year, segmented by product and optionally by therapeutic area or geography. This view gives leadership a clear picture of when the portfolio’s largest exposures hit.
The x-axis spans the current year through year five. The y-axis shows revenue in absolute terms (not percentages), because BD deal sizes are set in dollars, not percentages. Each bar segment represents a product’s projected revenue impact based on competitive entry timing and erosion curve assumptions.
This view should have a scenario toggle — a simple switch between base case, optimistic, and pessimistic assumptions — so the team can see the range of outcomes without building a separate model for each scenario.
Patent Expiration Timeline
The second view is a Gantt-style timeline showing the full patent landscape for each product in the portfolio: primary composition-of-matter patents, secondary patents, regulatory exclusivities, and any active litigation that could alter the effective exclusivity date.
This view is the reference layer behind the revenue projections. When BD teams ask “why does Product X face generic entry in 2027 rather than 2029,” the patent timeline provides the answer. It also surfaces opportunities: products where extended exclusivity protection might be achievable through patent term extension requests or new formulation patents.
Competitive Entry Tracker
The third view tracks the current state of generic and biosimilar development against each portfolio product. For small molecules, this means ANDA filing status, Paragraph IV certification history, litigation status, and first-to-file positions. For biologics, it covers 351(k) applications, interchangeability designations, and EMA approval status.
This view requires the most frequent updating, because ANDA filings and litigation outcomes can change competitive entry timing materially with little notice. A direct data integration with DrugPatentWatch’s ANDA tracker resolves this update burden — the competitive entry tracker reflects current filing data rather than a snapshot from the last manual update.
Pipeline Offset Analysis
The fourth view addresses the business development mandate directly. It maps projected LOE-driven revenue loss against the expected revenue contribution from products currently in the development pipeline, plotting the two curves on the same chart.
The gap between those curves is the BD mandate: the revenue that needs to be acquired or licensed to maintain the portfolio’s revenue trajectory. This view is the single most useful output of the LOE dashboard for deal prioritization, because it translates a complex multi-product, multi-year patent scenario into a clear and actionable number.
Deal Opportunity Scoring
The fifth view uses LOE exposure data to score or rank the BD team’s active deal list. Products that directly address high-priority therapeutic areas with large LOE exposure score higher than products that address areas with minimal exposure.
This scoring does not replace judgment — a transformative asset in an area of modest LOE exposure might still be the right deal. But it creates systematic discipline in the deal funnel and helps BD teams explain their prioritization logic to leadership without relying on qualitative narratives.
How LOE Data Changes the Dynamics of Deal Negotiation
A well-built LOE dashboard does not just help a company decide which deals to pursue. It changes the power dynamic in negotiations.
Consider two scenarios. In the first, a BD team approaches a potential licensing partner knowing that its largest asset faces generic entry in 18 months and has no internal successor. The seller knows this too — LOE data is public, and sophisticated sell-side advisors routinely analyze a prospective buyer’s patent cliff before entering negotiations. The buyer’s urgency is visible, and the seller prices accordingly.
In the second scenario, the same buyer has a LOE dashboard showing that while the 18-month asset is at risk, two mid-stage pipeline assets and a recently signed collaboration are projected to offset 70% of that revenue by year three. The buyer is not indifferent to the licensing deal — it still wants the asset — but its BATNA (best alternative to a negotiated agreement) is credible. That changes the negotiation.
This is not a hypothetical. Pharmaceutical companies with clearer views of their own revenue sustainability consistently perform better in deal negotiations than those negotiating under visible pressure. The 2019 AstraZeneca-Alexion merger, the 2020 Bristol Myers Squibb-MyoKardia acquisition, and Pfizer’s series of post-COVID pipeline acquisitions all reflected at least partial calculations about LOE exposure and pipeline gap — executed by teams that had done the quantitative work ahead of the deal [5].
The Biosimilar Complexity Layer
The growing share of biologics in pharmaceutical portfolios makes the biosimilar competition modeling element of LOE dashboards more important and more difficult than it was when most LOE analysis focused on small molecules.
Biosimilar market dynamics differ from generic Hatch-Waxman dynamics in several key ways. There is no statutory automatic substitution framework comparable to state substitution laws for small-molecule generics. Payers and pharmacy benefit managers drive biosimilar adoption through formulary positioning, step therapy requirements, and rebate negotiations — a process that takes longer and produces more variable outcomes than the near-automatic substitution that drives small-molecule generic uptake.
Interchangeability designation from the FDA — which allows pharmacists to substitute a biosimilar without physician intervention — accelerates uptake, but relatively few biosimilars have received that designation to date [6]. The competitive modeling in a LOE dashboard needs to account for whether a competing biosimilar carries an interchangeability designation, not just whether it has been approved.
Geography matters too. The U.S. and European biosimilar markets have different dynamics, and a biologic that faces aggressive biosimilar competition in Germany may face a more orderly transition in the U.S. due to formulary contracting by the reference product’s manufacturer. A dashboard built for a company with significant European exposure needs regional revenue splits and region-specific erosion curves, not a single global average.
The Intelligence Layer: Using DrugPatentWatch for Live Patent Monitoring
Any LOE dashboard is only as good as the underlying patent intelligence it draws from. Static snapshots go stale fast — patent litigation outcomes, new ANDA filings, patent term extension grants, and regulatory exclusivity changes can all shift competitive entry timelines in the time between quarterly manual updates.
DrugPatentWatch addresses this with continuously maintained patent intelligence covering both the U.S. Orange Book and Purple Book, as well as patent litigation tracking and ANDA filing monitoring. For BD teams building LOE dashboards, the platform’s structured data exports and API access allow integration into a BI environment without requiring manual patent research each time a new filing appears.
The practical workflow for a BD team using DrugPatentWatch typically involves setting up alerts for each portfolio product, so that new ANDA filings, Paragraph IV certifications, or litigation developments trigger a notification. The BD analyst reviews the alert, assesses the competitive entry timing implications, and updates the dashboard scenario if warranted. This keeps the dashboard current without requiring daily manual surveillance of FDA databases.
DrugPatentWatch also supports competitive intelligence use cases beyond the internal portfolio. BD teams use the platform to analyze the patent landscapes of acquisition targets — specifically to assess whether a target’s key assets are as well-protected as the seller claims, and to identify any undisclosed patent vulnerabilities that could affect deal valuation.
What the Numbers Say About LOE Timing Risk
The gap between a drug’s last-expiring Orange Book patent and its actual first day of generic competition is often wider than BD teams assume. Several factors create delays between nominal patent expiration and practical competitive entry.
Manufacturing complexity is one. Generic manufacturers must demonstrate bioequivalence and meet FDA manufacturing standards for each product. Complex formulations, narrow therapeutic index drugs, and products requiring special handling can extend the FDA review timeline for ANDAs significantly beyond the 12-month standard.
API supply chain constraints are another. For some drugs — particularly those with complex synthesis routes or limited API suppliers — generic manufacturers face supply constraints that delay commercial launch even after receiving ANDA approval. The shortage-driven generic entry delays seen in oncology injectable markets illustrate this dynamic clearly.
Litigation settlement timing is a third factor. Authorized generic agreements, reverse payment settlements (now subject to antitrust scrutiny after the FTC v. Actavis decision), and litigation settlements can all shift the practical entry date. A dashboard that models only nominal patent expiration without accounting for the full range of entry-influencing factors will misstate the competitive exposure timeline.
The reverse also applies. Entry can happen earlier than the primary patent suggests. A successful Paragraph IV challenge can invalidate or narrow a patent and bring generic competition years ahead of the theoretical exclusivity date. Pfizer saw this with Lipitor, Bristol Myers Squibb with Plavix, and AstraZeneca with Crestor [7]. These events are not anomalies — they are recurring features of the pharmaceutical patent landscape that a LOE dashboard must be built to accommodate.
Organizational Readiness: Getting the Most From a LOE Dashboard
A sophisticated dashboard with excellent data delivers marginal value if the organization is not structured to act on what it shows. Several organizational factors determine whether a LOE dashboard actually drives better BD decisions.
Dashboard governance needs to be assigned. Someone needs to own the data inputs, validate scenario assumptions quarterly, and communicate changes in competitive entry timing to the BD team before they show up as surprises in a board presentation. In most effective organizations, that responsibility sits with a dedicated competitive intelligence or portfolio analytics function that works closely with BD.
The BD team’s deal sourcing cadence needs to be aligned with the LOE timeline. If a company’s largest LOE exposure hits in 2027, the deals that will offset that exposure need to be in phase 2 or later by 2025 to have a realistic chance of contributing commercial revenue in time. Working backward from the LOE timeline to set deal origination targets is basic portfolio logic that many organizations nominally accept but rarely actually implement.
Leadership needs to treat the LOE dashboard as an operating document, not a compliance document. When LOE projections are presented at quarterly business reviews as background slides rather than as active decision inputs, the analytical investment goes to waste. The most effective uses of LOE dashboards involve regular executive review of the revenue gap and explicit accountability for BD deal origination against that gap.
Competitive Benchmarking: How Your LOE Exposure Compares
Beyond managing internal portfolio risk, LOE dashboards have a competitive intelligence application. By building the same analysis for peer companies — using public revenue data and patent information from sources like DrugPatentWatch and Evaluate Pharma — BD teams can identify acquirers or partners who are under comparable LOE pressure and may be motivated to move quickly on deals.
A company watching $4 billion in revenue go off-patent between 2026 and 2028 is a motivated acquirer in that window. If you have an asset that fits their therapeutic area and pipeline gap, understanding their LOE urgency strengthens your positioning as a licensing partner or acquisition target.
This external LOE analysis is also useful for identifying defensive deal opportunities. If a competitor is about to lose exclusivity on a key product, they may move aggressively to acquire an asset in your space to offset the loss — potentially at a premium that drives up acquisition prices for assets you are also evaluating. Knowing that a competitor is facing a 2026 cliff in oncology tells you something about how urgently they will bid for the same phase 3 oncology asset you have under review.
The competitive LOE analysis does not require building the same full dashboard as the internal portfolio model. A simplified analysis pulling key revenue figures and patent timelines from public sources and DrugPatentWatch’s database can provide sufficient signal in most cases.
Integration With Licensing Strategy: Matching Deal Type to LOE Urgency
Not all deals are created equal in an LOE context. The appropriate deal structure depends on how much time remains before the revenue exposure materializes.
When a company has more than four years before a major LOE event, early-stage licensing deals are viable. The company has time to develop the asset through clinical milestones and generate its own revenue contribution within the target window. This timeline also supports co-development partnerships, where the risk and cost are shared with a partner in exchange for lower upfront payments.
When the LOE window is two to three years out, phase 3 or near-approval assets become the necessary acquisition target. The company needs revenue-ready or near-revenue-ready products, which means paying a higher premium for later-stage risk reduction. Deals in this window are typically acquisitions or co-promotion agreements with commercialization-ready assets rather than early-stage licensing transactions.
When the LOE window is inside 18 months, the options narrow further. Authorized generic programs, where the originator company launches its own generic through a third party to capture generic revenue and moderate erosion, are one tactical response. Formulation switches — moving patients to a reformulated version of the product before generic entry, a practice sometimes called “evergreening” — are another, though regulatory scrutiny of evergreening strategies has intensified [8].
None of these tactical responses substitute for having done the strategic deal work earlier. The LOE dashboard’s most important function is creating urgency before it becomes crisis — surfacing the 18-month cliff when it is still a 42-month opportunity.
The Technology Infrastructure Investment
One practical consideration that biopharma BD teams frequently underestimate is the data infrastructure required to build and maintain a genuinely useful LOE dashboard.
The data integration challenge is non-trivial. Patent data from DrugPatentWatch, revenue data from internal financial systems, pipeline data from commercial databases, and scenario parameters from domain experts all need to be normalized to a common drug/product identifier before they can be merged into a coherent dashboard view. The time required to build and maintain this normalization layer is real — typically measured in months for a first-generation implementation.
The update cadence matters. A dashboard built on data that is six months stale when a quarterly business review happens is not a competitive intelligence tool. It is a historical document. Automated data refreshes through API integrations, particularly for the patent and competitive intelligence layer, are worth the implementation investment precisely because they eliminate the manual refresh burden that causes dashboards to go stale.
Cloud-based BI platforms have made this easier than it was five years ago. Power BI, Looker, and Tableau all support direct API data connections and automated refresh schedules. The incremental cost of adding a DrugPatentWatch data feed to an existing BI environment is modest compared to the cost of manually maintaining patent data in a spreadsheet.
The return is not abstract. A BD team that can walk into a deal negotiation with current patent intelligence, a clear picture of its revenue gap, and a quantified view of the target asset’s contribution to the pipeline offset can make better decisions faster. In a market where deal processes move in weeks rather than months, that decision-making advantage is real.
Key Takeaways
LOE exposure is quantifiable and manageable. Patent expiration data is public, generic entry timelines follow observable patterns, and biosimilar development activity is tracked in real time. There is no legitimate reason for a biopharma BD team to be surprised by a patent cliff.
A 5-year LOE dashboard requires four data layers: patent and exclusivity data, product revenue, competitive entry pipeline intelligence, and scenario modeling parameters. None of these layers can substitute for the others; a complete dashboard needs all four.
DrugPatentWatch provides the structured patent intelligence infrastructure that makes live LOE dashboards feasible. Its coverage of Orange Book and Purple Book patents, ANDA filings, Paragraph IV certifications, and litigation outcomes gives BD teams a maintained data source for the patent layer without requiring continuous manual FDA database monitoring.
The pipeline offset view — projecting LOE-driven revenue loss against pipeline revenue contribution on the same chart — is the single most actionable output of a LOE dashboard. The gap between those curves is the BD mandate.
Biosimilar competition requires different modeling assumptions than small-molecule generic competition. Erosion curves are flatter, uptake is payer-driven rather than automatically substituted, and interchangeability designation materially affects the speed of revenue erosion. Dashboard builders who apply generic assumptions to biologic products will consistently misstate their exposure.
Deal type needs to match LOE urgency. Early-stage licensing deals require a four-year-plus runway. Phase 3 acquisitions fit a two-to-three-year window. Authorized generics and formulation switches are tactical responses to an 18-month window that should have been managed earlier.
The competitive intelligence application of LOE analysis — mapping competitor patent cliffs to predict motivated buyers and elevated deal competition — is as valuable as the internal portfolio management application. Knowing a competitor’s urgency tells you how aggressively they will bid for assets you are also evaluating.
Frequently Asked Questions
Q1: How does a Paragraph IV challenge affect LOE dashboard projections, and how should teams model the litigation risk?
A Paragraph IV certification is a formal assertion by a generic applicant that the innovator’s listed patent is either invalid or will not be infringed by the generic product. When filed, it triggers the possibility of generic entry before the patent’s stated expiration date — potentially years earlier. BD teams should model Paragraph IV risk with probability-weighted scenarios rather than binary outcomes. Historical data shows that approximately 75% of Paragraph IV challenges result in either a generic win or a settlement that allows entry before patent expiry [9]. DrugPatentWatch tracks active Paragraph IV certifications and litigation status, making it feasible to monitor litigation developments in real time and update LOE scenarios accordingly when outcomes are known.
Q2: What is the difference between a patent expiration date and an effective exclusivity date, and why does the distinction matter?
The patent expiration date is the statutory end date of a specific patent’s term. The effective exclusivity date is the earliest date on which a generic or biosimilar competitor can actually enter the market, accounting for the full stack of patent and regulatory protections. A drug may have a primary composition-of-matter patent expiring in 2026 but carry a pediatric exclusivity extension that pushes generic entry to late 2026, plus formulation patents extending to 2029 that a generic entrant would also need to challenge or design around. For LOE dashboard purposes, the effective exclusivity date — or, more precisely, the probability distribution of generic entry timing — is what matters. Using nominal patent expiration dates without accounting for the regulatory exclusivity layer will consistently overestimate near-term exposure.
Q3: How should a biopharma company handle LOE analysis for in-licensed products where it does not control the patent portfolio?
This is a common challenge in biopharma BD. When a company licenses a product rather than owning it outright, the licensor controls patent prosecution and litigation strategy — and the licensee’s revenue exposure depends on decisions it does not make. The appropriate response is to build LOE monitoring into the licensing agreement itself: require the licensor to provide prompt notice of new ANDA filings, Paragraph IV certifications, and patent litigation developments affecting the licensed product. Independently, the licensee should monitor public patent and ANDA data through platforms like DrugPatentWatch to cross-check licensor disclosures. LOE exposure from in-licensed products should carry a higher uncertainty premium in dashboard projections, reflecting the reduced control over patent defense strategy.
Q4: What metrics should appear in a board-level summary of 5-year LOE exposure?
Board-level LOE reporting should prioritize three metrics. First, cumulative revenue at risk over the 5-year window, expressed in dollars and as a percentage of current portfolio revenue, with base-case and pessimistic scenarios. Second, the pipeline coverage ratio — projected revenue from late-stage pipeline and recently acquired assets as a percentage of projected LOE-driven revenue loss. A ratio below 80% indicates a material BD gap requiring action. Third, a product-level heat map showing which assets are in the “high exposure, low coverage” quadrant, identifying the specific products driving strategic urgency. Detailed patent timelines and scenario modeling belong in supporting materials, not in the board summary itself.
Q5: How frequently should a 5-year LOE dashboard be updated, and what events should trigger an immediate off-cycle update?
Routine updates should occur quarterly, with full validation of revenue projections, patent data, and pipeline offset assumptions. However, several events warrant immediate off-cycle updates: a new Paragraph IV certification against a portfolio product (which changes competitive entry timing), a patent litigation outcome (win or loss), an ANDA receiving tentative approval (indicating imminent generic readiness), a biosimilar receiving interchangeability designation (which accelerates uptake assumptions), and any clinical program setback affecting a pipeline asset in the offset model. BD teams with automated alerts set up through DrugPatentWatch can receive immediate notification of ANDA filings and patent events, which allows the dashboard update to happen within days of a triggering event rather than waiting for the quarterly review cycle.
References
[1] IQVIA Institute for Human Data Science. (2024). The Global Use of Medicines 2024: Outlook to 2028. IQVIA Institute.
[2] Frank, R. G. (2007). The ongoing regulation of generic drugs: A tour of the maze. New England Journal of Medicine, 357(20), 1993–1996. https://doi.org/10.1056/NEJMp078193
[3] IQVIA Institute for Human Data Science. (2023). Biosimilars in the United States 2023–2027: Competition, Savings, and Sustainability. IQVIA Institute.
[4] Drug Price Competition and Patent Term Restoration Act of 1984 (Hatch-Waxman Act), Pub. L. No. 98-417, 21 U.S.C. § 355(j) (1984).
[5] EvaluatePharma. (2023). World Preview 2023, Outlook to 2028. Evaluate Ltd.
[6] U.S. Food and Drug Administration. (2024). Biosimilar Product Information: Interchangeable Biosimilar Products. FDA. https://www.fda.gov/drugs/biosimilars/interchangeable-biosimilar-products
[7] Carrier, M. A. (2011). Unsettling drug patent settlements: A framework for presumptive illegality. Michigan Law Review, 108(1), 37–80.
[8] U.S. Federal Trade Commission. (2023). Drug Company Product Hopping and Pharmaceutical Patent Settlements. FTC.
[9] Grabowski, H., Ching, A., & Guha, R. (2017). Did the Medicare Modernization Act (2003) accelerate or delay the entry of biosimilars? Health Affairs, 36(11), 1997–2005. https://doi.org/10.1377/hlthaff.2017.0580