Why Traditional Valuation Fails in the Life Sciences
Valuation in the life sciences deviates fundamentally from the rules governing software or consumer goods. In most industries, value is a function of current cash flow, user growth, or tangible assets. In biotechnology and pharmaceuticals, value is a prospective mathematical probability. A company with no revenue, a high burn rate, and a single clinical asset is not necessarily a speculative gamble; it is an entity whose worth is defined by the discounted present value of its future intellectual property. To value these firms, one must abandon the standard Price-to-Earnings (P/E) ratio and replace it with a rigorous assessment of technical, regulatory, and market risk.
The biopharmaceutical sector operates within a gauntlet of attrition. For every drug that reaches a pharmacy shelf, thousands of molecules have failed in labs or clinical trials. This binary nature—where a single data readout can increase or decrease a firm’s market capitalization by billions of dollars overnight—creates a volatility that scares the uninitiated. However, for the professional investor, this volatility is an opportunity to exploit the gap between a drug’s biological potential and its market price.
Turning patent data into a competitive advantage requires more than just reading FDA press releases. It demands a deep understanding of the risk-adjusted net present value (rNPV), the nuances of patent expiration timelines, and the shifting pricing environment introduced by federal legislation. Investors must act as both financial analysts and amateur pharmacologists, identifying the “operational alpha” that allows some companies to navigate the regulatory hurdle more efficiently than their peers.
The Risk-Adjusted Net Present Value (rNPV) Standard
The rNPV method is the industry standard for a reason: it decouples technical risk from financial risk.1 In a standard Discounted Cash Flow (DCF) model, an analyst might try to capture the high risk of a biotech startup by inflating the discount rate to 50%. This is mathematically lazy. Conflating the binary risk of a clinical trial failure with the continuous risk of holding an asset over time distorts the final number.2 The rNPV instead uses a standard Weighted Average Cost of Capital (WACC)—typically reflecting the cost of equity for a firm of its size—and weights each future cash flow by the probability that it will actually occur.2
The Mechanics of the rNPV Equation
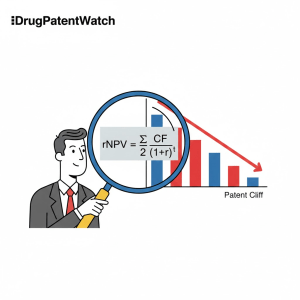
To build a defensible rNPV, one must model the entire life cycle of a drug, from the current phase of development to the eventual loss of exclusivity. The formula essentially sums the probability-weighted present values of all future cash flows:
In this formula, $CF_t$ represents the net cash flow (revenue minus costs) in period $t$. The $P(\text{Success}_t)$ is the cumulative probability that the project remains active. For a drug currently in Phase II, the probability of it generating revenue in seven years is the product of the probability of Phase II success, Phase III success, and regulatory approval.5
The likelihood of passing the next clinical milestone.
Historical benchmarks, therapeutic area data.6
Discount Rate ($r$)
The cost of capital (WACC).
Market rates, firm beta, risk-free rate.3
Time ($t$)
The duration of trials and the regulatory review.
FDA timelines, trial enrollment data.5
Limitations and Sanity Checks
The rNPV is highly sensitive to its inputs. A 5% change in the assumed peak market share or a 10% shift in the probability of success can swing the valuation by hundreds of millions of dollars. Consequently, professional analysts use rNPV as a primary tool but supplement it with “Comps” or relative valuation.4 For a pre-revenue company, revenue multiples are meaningless, so the market often looks at Enterprise Value-to-Pipeline (EV/Pipeline) or historical transaction values for similar assets at the same stage of development.2
The Probability of Success: Indication-Specific Risk
The integrity of any valuation rests on the accuracy of the Probability of Success (PoS) assumptions. These cannot be arbitrary. They must be grounded in empirical data stratified by therapeutic area, modality, and phase transition.2 The “overall” likelihood of approval (LoA) for a drug entering Phase I is approximately 7.9% to 9.6%, but this average masks massive variability.5
The Attrition Curve by Therapeutic Area
Not all diseases are created equal in the eyes of the regulator. Oncology remains the most active sector for R&D, but it is also one of the most competitive and prone to early-stage failure.6 Cardiovascular and metabolic programs often have higher success rates because their endpoints (such as blood pressure or HbA1c levels) are more objective and easier to measure.6
Therapeutic Area
Overall LoA (Phase I to Approval)
Primary Bottleneck Phase
Hematologic Oncology
~12-15%
Phase III 6
Solid Tumor Oncology
<10%
Phase II 6
CNS / Neurology
~6-8%
Phase II and III 6
Infectious Disease
~13-19%
Regulatory Review 6
Rare Disease
~15-20%
Phase III (Enrollment) 6
“Phase II is the graveyard for most therapeutic areas. It is where weak biology and weak endpoints finally get exposed. Operational error often looks like ‘biology failure,’ where poor rater training or underpowered sample sizes erase a real treatment effect.” — Clinical Research Analysis Report, 2025.6
Why CNS is the Graveyard of Good Intentions
Central Nervous System (CNS) disorders, particularly neurodegeneration and psychiatry, are historically the most difficult to value. Neurodegeneration trials suffer from slow endpoints—it takes years to see if a drug slows Alzheimer’s—and massive patient heterogeneity.6 Psychiatry trials are frequently undermined by a high placebo response, which can flatten the observed effect size of a drug even if the biology is sound.6 When valuing these firms, a higher discount rate or a lower PoS is required to reflect this “endpoint noise.”
The Economics of the Gauntlet: Costs and Cycle Times
The cost of bringing a single medicine to market is staggering. Recent data from Deloitte suggests an average cost of $2.23 billion to $2.6 billion per approved asset in 2024.5 This figure is “fully loaded,” meaning it accounts for the capital spent on the vast majority of drugs that fail during the process.5
Phase-by-Phase Cost Distribution
The financial burden increases exponentially as a drug moves from the lab to the clinic. Phase III trials are the most expensive, often costing upwards of $50 million for a single study, driven by the need for large patient populations and long-term safety monitoring.12
Trial Phase
Average Total Cost (USD)
Cost per Patient (USD)
Phase I
$5.26 Million
~$136,000 12
Phase II
$18.49 Million
~$130,000 12
Phase III
$52.84 Million
~$113,000 12
Note that while the total cost is highest in Phase III, the per-patient cost is often highest in Phase I due to the intensive monitoring and small cohort sizes required for safety testing.12 For an investor, understanding a company’s “cash runway” means knowing exactly how many patients they need to recruit and at what cost to reach the next data milestone.
The Shrinking Window of Exclusivity
The journey from IND filing to FDA submission takes an average of 90 months, an increase of 8% over the last decade.8 Because the patent clock starts ticking long before the drug is approved, the effective market life under patent protection is typically only 7 to 12 years.13 Every month a trial is delayed is a month of high-margin revenue lost forever. This makes “cycle time” a critical valuation metric. Companies that use AI for site selection or decentralized trial models to speed up enrollment are generating “operational alpha” that translates directly into a higher rNPV.14
Intellectual Property and the Competitive Moat
A drug is only as valuable as the wall of patents surrounding it. In the biopharma sector, patents provide a temporary monopoly that allows firms to recoup their R&D investments. When that wall collapses, the revenue stream follows.16
Leveraging DrugPatentWatch for Portfolio Audits
Sophisticated investors do not just look at the expiration date of the “composition of matter” patent. They use intelligence platforms like DrugPatentWatch to audit the entire patent estate.5 This includes secondary patents on formulations, methods of use, and manufacturing processes, which often form a “patent thicket” that can extend protection for years.13
By monitoring the “Orange Book”—the FDA’s registry of patents and exclusivities—investors can identify Paragraph IV filings.13 A Paragraph IV filing is a signal from a generic manufacturer that they intend to challenge the brand’s patents. For the brand-name company, this triggers a 30-month stay on generic approval, but for the investor, it is a loud warning that the competitive moat is being breached.13
Regulatory Exclusivities vs. Patents
It is a common mistake to assume patents are the only form of protection. The FDA also grants regulatory exclusivities that operate independently of the patent office.13
Orphan Drug Exclusivity (ODE): 7 years for treatments of rare diseases.
New Chemical Entity (NCE): 5 years for a drug with an entirely new active ingredient.
Pediatric Exclusivity: An additional 6 months of protection granted for conducting trials in children.13
A valuation model must identify which barrier—the patent or the exclusivity—falls last, as that determines the true date of generic entry.13
Modeling the Patent Cliff and Revenue Erosion
The “patent cliff” is the sudden, catastrophic drop in revenue that occurs when a drug loses its monopoly status. For traditional small-molecule drugs, this is a precipice. For biologics, it is more of a slope.13
The Small-Molecule Precipice
Because small-molecule drugs are simple chemicals, they are easy for generic manufacturers to replicate. Once a generic enters the market, the price can collapse by 80% to 90% within the first 12 to 18 months.13 In the U.S., pharmacy substitution is often automatic, meaning the brand-name drug loses nearly all its market share in weeks.13
Year Post-Exclusivity
Price Reduction (Oral Meds)
Generic Efficiency Rate
Year 1
~51-66%
High 13
Year 2
~57-74%
Very High 13
Year 5
~80%
Near Total 13
The Biologics Slope and Biosimilar Adoption
Biologics—complex proteins manufactured in living cells—face a different reality. Competitors, known as biosimilars, must undergo rigorous clinical trials to prove they are “highly similar” to the original.13 This creates a barrier to entry that excludes low-cost, small-scale players. Consequently, the revenue erosion for a biologic is more gradual, with the original drug often retaining 30% to 70% of its revenue in the first year after biosimilar entry.13 Furthermore, biosimilars lack automatic interchangeability in many jurisdictions, requiring a new prescription from a doctor, which slows market penetration.13
The Inflation Reduction Act: A New Pricing Paradigm
The Inflation Reduction Act (IRA) of 2022 has introduced the most significant change to biopharma valuation since the Hatch-Waxman Act of 1984. By granting the federal government the power to negotiate prices for top-selling drugs in Medicare, the IRA has essentially capped the “terminal value” of blockbusters.19
Maximum Fair Price (MFP) Mechanics
The government targets “single-source” drugs that have been on the market for a certain period without generic competition.19
Small-Molecule Drugs: Eligible for negotiation 9 years after approval.
Biologics: Eligible for negotiation 13 years after approval.19
This 4-year gap is critical for valuation. It has led to a strategic shift among investors toward biologics, which now have a longer window of “unfettered” pricing before the Maximum Fair Price (MFP) takes effect.19 For the first 10 drugs selected for negotiation in 2024, the negotiated prices (effective in 2026) represented a minimum of 38% off the 2023 list prices.20
Part B vs. Part D Behavior Patterns
Current pricing trends show that manufacturers are already recalibrating their strategies. In Medicare Part B (physician-administered drugs), price growth has doubled from 6.5% pre-IRA to 13.3% post-IRA.22 This suggests that manufacturers are trying to capture as much value as possible before their drugs are selected for the 2028 negotiation cycle.22 In contrast, some Part D (retail) drugs, particularly insulins like NovoLog, have seen proactive list-price reductions of up to 75% ahead of formal negotiations, as companies attempt to align with new Part D benefit redesigns and avoid the negative optics of federal intervention.22
Real Options: Valuing the Platform Beyond the Asset
The standard rNPV is a linear model; it assumes a set path. But management has choices. In reality, a biotech company is a collection of “real options”.2
The Option to Abandon: If a Phase II trial is disappointing, management can stop spending and pivot to a different molecule, preserving cash.
The Option to Expand: If a drug succeeds in one indication (e.g., Psoriasis), the company can “exercise the option” to test it in another (e.g., Crohn’s disease).2
The Option to Delay: If market conditions are poor, a company can wait to start a Phase III trial.
Valuing a “platform” company—one that has a core technology used to discover many drugs—requires Black-Scholes or Binomial Lattice modeling to capture this “optionality”.2 The value of the platform is the sum of the rNPVs of all potential assets plus the option value of future discoveries that haven’t yet entered the pipeline.2
The M&A Engine: Strategic Capital Allocation
Large pharmaceutical companies are currently facing a massive revenue gap due to upcoming patent cliffs. To fill this gap, they are aggressively acquiring smaller biotech firms with late-stage assets.9 In the first half of 2025, biopharma deal value reached $192 billion, a 5% increase over 2024.24
The Shift to Contingent Milestone Payments
The structure of these deals has evolved. Instead of paying a massive upfront price, buyers are increasingly using “de-risked” structures. Upfront payments now account for only about 15% of total deal value, with the remaining 85% tied to clinical or regulatory milestones.24 This “pay-for-success” model protects the acquirer from trial failure while allowing the biotech’s original shareholders to participate in the upside if the drug is approved.24
M&A Case Studies (2025 Transactions)
Acquirer
Target
Value
Strategic Asset
Johnson & Johnson
Intra-Cellular
$14.1 Billion
Caplyta (Neuropsychiatry) 9
Merck & Co.
Verona Pharma
~$10 Billion
Ohtuvayre (COPD) 9
Sanofi
Blueprint Meds
$9.1 Billion
Rare Immunological Portfolio 9
Pfizer
Metsera
$7.4 Billion
GLP-1 (Obesity) Pipeline 9
Oncology and GLP-1 obesity treatments remain the primary hotspots for M&A. The GLP-1 market alone is projected to reach $100 billion by 2030, explaining why Pfizer and others are willing to pay significant premiums for early-stage obesity assets.9
Market Sentiment and Regulatory Catalysts
For a stock market investor, the timing of data readouts is everything. The most critical catalysts are PDUFA (Prescription Drug User Fee Act) dates—the deadline by which the FDA must act on a new drug application.25
Biotech stocks exhibit significant volatility in the weeks leading up to these dates as the market attempts to “price in” the approval.25 Research suggests that “insider trading” or at least illegal share trading on non-public information may be common, with stock prices of clinical trial “winners” rising an average of 27% in the 120 days before a Phase III announcement, while “losers” saw no such pre-announcement move.28 For the savvy investor, monitoring volume and price action ahead of a PDUFA date can provide a hint about the likely outcome.
Conclusion: Turning Data into Advantage
Valuing pharmaceutical and biotech companies is a high-precision exercise that requires an equal understanding of finance and biology. The professional investor must look past the “breakthrough” rhetoric and focus on the rNPV, the patent wall, and the regulatory clock. Success in this sector is not about picking the best science, but about picking the best science at a price that doesn’t fully account for its probability of success.
By leveraging intelligence platforms like DrugPatentWatch to monitor patent cliffs and Paragraph IV filings, and by adjusting models for the pricing pressures of the IRA, investors can build a portfolio that thrives on the very volatility that scares others away. The biopharma sector is one of the few remaining areas of the market where deep research and technical knowledge can still generate significant outperformance.
Key Takeaways
rNPV is the Gold Standard: Never use a standard DCF to value a clinical-stage asset; separate technical risk from financial risk.2
The IRA has Changed the Game: Small molecules now have a 9-year window, and biologics have a 13-year window before federal price negotiations; factor this into terminal value.19
Phase II is the Graveyard: Most clinical failures happen in Phase II due to weak biology or poor trial design; discount these assets accordingly.6
Upfronts are Shrinking: In M&A, expect de-risked deal structures where only 15% of the value is paid upfront, with the rest contingent on milestones.24
IP is the Moat: Use platforms like DrugPatentWatch to audit the entire “patent thicket” and identify Paragraph IV challenges before they hit the headlines.5
FAQ
1. How does the rNPV method handle a drug that fails in a Phase III trial?
In an rNPV model, if a trial fails, the probability of success for all subsequent stages (and therefore the revenue) drops to zero. The asset’s value becomes the liquidation value of its data or remaining IP. However, if the company has “real options,” it may be able to pivot the drug to a different indication, which would have its own, separate rNPV.
2. Why is a biologic drug often worth more than a small-molecule drug with the same peak sales?
Biologics generally have a more favorable “erosion slope” after patent expiration. Because biosimilars are more expensive to develop and don’t benefit from automatic pharmacy substitution, the original brand-name drug typically loses revenue much more slowly than a small-molecule drug, which can lose 90% of its value in a single year.
3. What is a PDUFA date, and why does it cause so much stock volatility?
A PDUFA date is the deadline for the FDA to approve or reject a drug. It is a binary event: approval usually leads to a massive stock surge, while a “Complete Response Letter” (rejection) can cause a stock to crash. Investors trade heavily around these dates because they represent the final hurdle to commercialization.
4. How does the Inflation Reduction Act affect a biotech company that doesn’t yet have an approved drug?
Even for pre-revenue companies, the IRA impacts the “exit value.” If a large pharma company is considering acquiring a biotech, they will calculate how much that drug will be worth 10 years after launch. If the drug is likely to be targeted for Medicare negotiation, the acquirer will pay less for it today, which lowers the biotech’s current valuation.
5. What is “operational alpha” in clinical trials?
Operational alpha refers to a company’s ability to run trials faster and cheaper than its competitors. This is achieved through better patient recruitment, lower site-termination rates, and efficient data cleaning. Faster trials mean a longer effective patent life and a higher rNPV, regardless of the underlying science.


")


