An evidence-based analysis of FDA-approved oncology drug economics, patent strategy, and what the numbers actually mean for payers, investors, and policy makers
The pharmaceutical industry has a standing answer ready whenever a senator or a health minister asks why cancer drugs cost so much: research is expensive, failures are common, and without the promise of reward there would be no innovation. It is a coherent argument. It is also, based on the most comprehensive peer-reviewed data available, numerically unsupported.
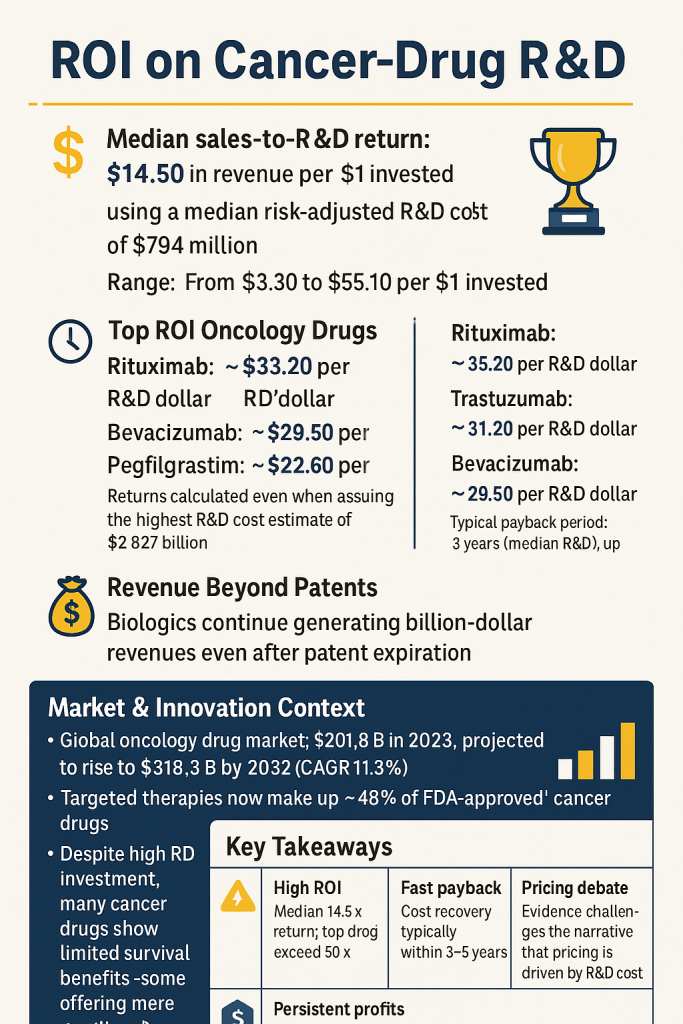
A 2019 study published in JAMA Network Open, authored by researchers at the World Health Organization, examined 99 FDA-approved cancer drugs across three decades of sales data. The median cumulative return was $14.50 for every $1 invested in research and development. Even using the most conservative, highest-cost R&D estimate in the literature — $2.827 billion per drug — the typical cancer medicine fully recovered that investment within five years of reaching the market [Tay-Teo et al., 2019].
Five years. Of a patent life that can stretch past 20.
This report unpacks that finding from the ground up. It examines how R&D cost estimates are constructed, where they diverge, how sales data was collected and what it shows, which drugs sit at the extremes of the return distribution, what happens to revenues after patent expiry — particularly for biologics — and what all of this implies for the competitive intelligence professionals, payers, investors, and policy makers who need to take positions on oncology pricing in 2025 and beyond.
Patent intelligence platforms like DrugPatentWatch make this analysis tractable for practitioners. The raw data — exclusivity timelines, patent clustering, biosimilar entry dates, filing histories — sits behind most of the commercial strategy decisions in oncology. Understanding the financial context in which those patent timelines operate is what turns raw data into usable insight.
Part I: The Economics of Cancer Drug Development
1.1 What R&D Costs Actually Mean — and Why the Estimates Vary So Widely
The range of credible R&D cost estimates for a single cancer drug spans nearly 30-fold: from $161 million at the low end to $4.54 billion at the high end, all expressed in 2019 U.S. dollars [Wouters et al., 2020; Tay-Teo et al., 2019]. That gap is not primarily a function of dishonesty on anyone’s part. It reflects genuine methodological choices that compound into dramatically different outputs.
The four biggest sources of divergence are:
Scope of costs included. Some analyses start the clock at first-in-human trials. Others reach back to target identification and preclinical work. The Tufts Center for the Study of Drug Development, which produced the often-cited $2.6 billion figure (in 2013 dollars), includes both [DiMasi et al., 2016]. Studies using SEC filings to look at single-product companies — a method used by Prasad and Mailankody in their 2017 JAMA Internal Medicine analysis — begin with the year a compound entered a company’s pipeline and end at approval, yielding a median of $648 million [Prasad & Mailankody, 2017]. That is not a contradiction. It is a different perimeter drawn around the same activity.
Risk adjustment. A drug that costs $300 million to develop in direct costs becomes far more expensive when you account for the compounds that failed before it reached approval. If nine drugs fail for every one that succeeds, the successful drug must effectively subsidize the other nine. How analysts model that failure rate — and oncology has historically had phase 2-to-approval success rates below 10% — drives enormous variation in final estimates [Wong et al., 2019].
Cost of capital. Tufts applied an 11% annual discount rate to its pre-approval spending, effectively doubling the direct cost figure. Studies that use lower rates or no rate at all produce lower numbers. Neither approach is wrong; they answer different questions. One asks what the accounting cost is; the other asks what it costs a company to tie up capital for a decade.
Therapeutic area specificity. Oncology is consistently the most expensive therapeutic domain when measured per approved compound. Therapeutic area-specific estimates place anticancer drug R&D costs between $944 million and $4.54 billion per approved medicine [Wouters et al., 2020]. Part of that reflects true complexity — solid tumor biology is harder to drug than a single-pathway metabolic disease — and part reflects the clinical trial architecture oncology requires, including the long observation windows needed to measure survival endpoints as treatments improve.
A 2024 analysis from HHS used a different approach still, estimating the mean cost of developing a new drug from 2000 to 2018 at $172.7 million in direct costs, rising to $515.8 million when failure costs were included and to $879.3 million when both failure costs and capital costs were factored in [Sertkaya et al., 2024]. This is not a low outlier. It reflects a different dataset and a different perimeter.
The practical implication: when the industry cites R&D cost numbers, always ask which perimeter they are using. When analysts cite the same numbers to argue for or against current pricing, they should ask the same question of themselves.
1.2 What the Tay-Teo Study Actually Measured — and What It Didn’t
The 2019 WHO-affiliated analysis by Tay-Teo, Ilbawi, and Hill is the cleanest large-scale head-to-head comparison of R&D investment against sales revenue for oncology drugs. It identified 156 FDA-approved cancer drugs from 1989 through 2017, retained 99 that had sales data for more than half of the years since approval, and pulled annual revenue figures from originator companies’ consolidated financial reports. Where gaps existed, researchers estimated from surrounding data points. In total, the dataset covered 1,040 data-year observations across a median of 10 years of sales history per drug [Tay-Teo et al., 2019].
Revenue was expressed in 2017 U.S. dollars adjusted for inflation and compared against three R&D cost benchmarks drawn from the peer-reviewed literature:
Lower bound: $219 million (risk-adjusted)
Median: $794 million (risk-adjusted)
Upper bound: $2,827 million (risk-adjusted)
The results at each threshold:
By end of 2017, 91.9% of the 99 drugs had generated cumulative sales exceeding the lower-bound R&D cost. 73.7% had exceeded the median estimate. 56.6% had surpassed even the highest estimate [Tay-Teo et al., 2019].
Among drugs with at least 10 years of commercial history, 99% had covered even the maximum risk-adjusted R&D cost. That is as close to a universal finding as observational economics gets.
The study does not claim to measure net profit. Companies incur costs beyond R&D: manufacturing, marketing, pharmacovigilance, and general and administrative expenses all sit on top of development spending. The researchers are explicit about this. What they measure is the gross return on R&D investment specifically — and on that metric, the data are unambiguous. <blockquote> ‘Cancer drugs, through high prices, have generated returns for the originator companies far in excess of possible R&D costs. Lowering prices of cancer drugs and facilitating greater competition are essential for improving patient access, health system’s financial sustainability, and future innovation.’ — Tay-Teo K, Ilbawi A, Hill SR. <em>JAMA Network Open</em>, January 2019. [PMC6324319] </blockquote>
1.3 The Prasad-Mailankody Baseline: A Different Angle, a Consistent Conclusion
Two years earlier, Prasad and Mailankody at MSKCC took a different approach to the same question. They examined 10 publicly traded oncology companies that had exactly one FDA-approved drug at the time of approval, allowing them to attribute all of each company’s R&D spending to that single product. Using SEC filings as the data source, they estimated a median development cost of $648 million and median post-approval revenue of $1.658 billion — generating a return ratio just under 3:1 in raw terms [Prasad & Mailankody, 2017].
The 3:1 figure looks smaller than Tay-Teo’s 14.5:1, but the studies measure different things. Prasad and Mailankody captured revenue at a single point in time — the analysis was published in 2017 using data current to that year — and their sample was 10 drugs, not 99. Their cost methodology also does not include a cost-of-capital adjustment. Each approach is internally consistent.
What matters for this article is that two independent research groups, using different datasets, different methodologies, and different sample sizes, reached the same qualitative conclusion: cancer drug sales revenues substantially exceed plausible R&D cost estimates.
1.4 The Tufts Counter-Position — and Its Limitations
The most-cited industry-aligned figure, $2.6 billion per approved drug in 2013 dollars [DiMasi et al., 2016], comes from the Tufts Center for the Study of Drug Development. Tufts uses proprietary data from a panel of large pharmaceutical companies, which it does not disclose. Critics — including Prasad, Mailankody, and the authors of the Public Citizen analyses — argue this creates a non-replicable methodology [NPR Health Shots, 2017].
More substantively: the Tufts estimate is for all drugs across all therapeutic areas, not specifically for cancer. It includes a large cost-of-capital adjustment at an 11% rate that critics argue overstates the opportunity cost of capital. And even if the $2.6 billion figure were taken at face value, Tay-Teo’s analysis shows that 56.6% of cancer drugs generated cumulative sales sufficient to cover even this upper-bound estimate by 2017 — with the remaining 43.4% simply needing more time to get there.
The industry’s argument that R&D costs justify current pricing is not disproved by acknowledging R&D is expensive. It requires demonstrating that current prices are necessary to recover those costs. The evidence does not support that claim.
Part II: The Return-on-Investment Distribution
2.1 The Median Hides the Extremes
A median return of $14.50 per R&D dollar invested is striking on its own. The distribution around that median is what makes it commercially significant for anyone tracking competitive dynamics in oncology.
The full range in the Tay-Teo dataset runs from $3.30 to $55.10 per dollar invested [Tay-Teo et al., 2019]. That spread tells you that oncology is not a monolithic business. Some drugs barely clear what any reasonable cost estimate would require; others generate returns so large they defy the conventional economic logic of innovation incentives. Understanding which drugs sit where — and why — is the core of competitive intelligence in this space.
2.2 The Blockbuster Tier: Rituximab, Trastuzumab, and the Biologics That Rewrote the Rules
Using the maximum risk-adjusted R&D cost of $2.827 billion as the benchmark — the most conservative test possible — five drugs stand out at the top of the return distribution:
Rituximab (Rituxan): $33.20 in cumulative sales per dollar of maximum R&D cost. Rituximab, Genentech and Biogen’s anti-CD20 antibody, received its first FDA approval in 1997 for non-Hodgkin lymphoma. Over the following two decades, it accumulated indications in chronic lymphocytic leukemia, rheumatoid arthritis, and several other autoimmune conditions, each approval extending both its clinical reach and its commercial runway. By 2017, cumulative global oncology and non-oncology sales were in the tens of billions [Tay-Teo et al., 2019].
Trastuzumab (Herceptin): $31.20 per dollar. Approved in 1998 for HER2-positive breast cancer, Herceptin is perhaps the clearest example of a targeted therapy that created an entirely new disease category — HER2-positive — whose definition was inseparable from the existence of the drug itself. The companion diagnostic requirement and the need for HER2 testing before treatment created a durable commercial moat alongside genuine clinical value.
Bevacizumab (Avastin): $29.50 per dollar. The VEGF inhibitor approved in 2004 for colorectal cancer expanded into lung, kidney, brain, and cervical cancer over subsequent years. Avastin’s trajectory illustrates both the power and the limits of indication expansion: several post-initial approvals were later restricted or withdrawn when confirmatory evidence failed to materialize, but the drug’s commercial machine was by then well established.
Pegfilgrastim (Neulasta) and Imatinib (Gleevec): Both at $22.60 per dollar. Gleevec’s story is particularly instructive. Imatinib, approved in 2001 for chronic myelogenous leukemia, was one of the first targeted therapies in oncology and is widely cited in textbooks as proof of concept for the precision medicine approach. Its price trajectory is equally instructive: the initial U.S. launch price of approximately $30,000 per year in 2001 had risen to over $120,000 per year by 2016, a fourfold increase in a drug whose R&D was by then many times recouped [Experts in Chronic Myeloid Leukemia, 2013].
A separate analysis from King’s College London’s Institute of Cancer Policy, covering drugs launched between 1997 and 2020, found even larger ROI figures for the same cohort. Trastuzumab’s ROI in that analysis reached 3,421%; Rituximab’s, 2,523%; and Bevacizumab’s, 3,200% [King’s College London, 2024].
These are not rounding errors. They represent a structural feature of how oncology drugs are priced and how long their patent protection and biosimilar-resistance last.
2.3 The Lower Tier: Why Some Drugs Barely Break Even
The $3.30-per-dollar floor in the Tay-Teo distribution also deserves attention. Not every oncology approval is a blockbuster. Drugs approved for rare tumor types with small patient populations, drugs that face rapid generic entry, and drugs that were later supplanted by more effective agents can generate returns that, while positive, do not fundamentally challenge any reasonable account of the costs required to develop them.
This heterogeneity matters for two reasons. First, it complicates the industry’s use of average or mean R&D cost figures in policy debates. The high average cost reflects both genuinely expensive programs and the statistical weight of frequent failures. But the financial performance of drugs once approved is far from average — it clusters toward high returns for biological therapies and toward lower, though still positive, returns for some small molecules in crowded or rapidly genericized markets.
Second, the lower-return drugs are where the case for innovation incentives is actually strongest. A drug that generates $3.30 per dollar over its commercial life, particularly if that commercial life was shortened by rapid generic entry or indication-specific competition, genuinely requires the promise of high returns elsewhere in a portfolio to justify the initial investment. The problem is not that this argument exists — it does. The problem is that it has been extended to justify pricing for drugs that are generating 30 or 50 times their development cost.
2.4 Cost Recovery Speed: The Timeline the Industry Doesn’t Publicize
Speed of cost recovery is where the ROI story gets most concrete for business analysts. The Tay-Teo data on payback periods does something the return ratio cannot: it shows when in a drug’s commercial life the investment is made whole, and how much remaining patent-protected time the company has to generate pure return after that point.
Using the median R&D cost of $794 million, the median payback period was 3 years, with a range of 2 to 5 years [Tay-Teo et al., 2019]. Using the maximum estimate of $2.827 billion, the median payback period extended to 5 years, ranging from 2 to 10 years.
A typical oncology drug’s data exclusivity period in the U.S. is 5 years for new chemical entities, with patent protection often extending 10 to 15 years beyond first approval when compound, formulation, method-of-use, and manufacturing patents are combined. If the median drug recovers its maximum possible R&D cost in 5 years and then retains patent-backed market exclusivity for another 10 to 15 years, the mathematics of what is happening with cancer drug pricing become straightforward.
This is where DrugPatentWatch’s utility becomes concrete. For any given drug, you can examine which patents are listed in the FDA Orange Book, when they expire, whether there are pediatric exclusivity extensions, whether any paragraph IV certifications have been filed, and what the realistic timeline to generic or biosimilar entry looks like. Mapping that timeline against the cost-recovery curves in the academic literature gives payers and investors a far sharper picture of a drug’s actual economic position than list price alone.
Part III: The Biology of Post-Exclusivity Revenue
3.1 Why Biologics Don’t Behave Like Small Molecules After Patent Expiry
In the generics world, the pattern after patent expiry is well-documented. Small molecule prices drop sharply — often by 80 to 90% within two years — as multiple generic entrants flood the market. That pattern, for most therapeutic categories, makes the post-exclusivity commercial question simple: originator revenue collapses, generic volume grows, net spending often falls.
Oncology biologics do not follow this pattern. The Tay-Teo analysis explicitly found that biological cancer therapies ‘continued to generate billion-dollar returns for the originator companies after the end of market exclusivity’ [Tay-Teo et al., 2019]. This is not a minor exception. It is a fundamental structural feature of the biologic oncology market, and it compounds the already-high ROI figures discussed above.
Four forces drive this persistence:
Manufacturing complexity as a competitive barrier. Monoclonal antibodies, fusion proteins, and other biological therapies are produced in living cell systems — Chinese hamster ovary cells being the most common — under tightly controlled conditions. The exact glycosylation patterns and tertiary protein structures that result from this manufacturing process cannot be precisely replicated by a biosimilar manufacturer. Biosimilars are, by definition, ‘highly similar’ to the reference product, not identical. Demonstrating that ‘high similarity’ through analytical and clinical studies is itself a substantial undertaking, typically costing hundreds of millions of dollars and taking 8 to 10 years.
Regulatory pathway design. The Biologics Price Competition and Innovation Act (BPCIA) created a biosimilar approval pathway in 2010, but it is materially more demanding than the Hatch-Waxman pathway for small molecule generics. Biosimilar applicants must conduct additional clinical studies that generic manufacturers do not. Interchangeability designation — which allows pharmacists to substitute without prescriber approval — requires even more evidence and has been slow to accrue across the biologics market.
Prescriber and patient behavior. Oncologists treat patients with life-threatening disease. Switching a stable patient from an originator biologic to a biosimilar introduces a degree of uncertainty — about immunogenicity, about clinical performance in a specific patient — that many oncologists are not willing to accept absent clear payer pressure or formulary mandate. This conservatism is not irrational from a clinical perspective. Its effect on biosimilar uptake is real and persistent.
Originator defensive strategies. Pharmaceutical companies do not passively accept biosimilar competition. They deploy contracted rebate programs that make their products cheaper for payers under certain conditions, pursue ‘authorized biosimilar’ strategies through their own affiliates, and use patient support programs to maintain prescriber loyalty. These tactics are legal, well-documented, and effective.
3.2 Case Study: Trastuzumab After Herceptin’s Patent Expiry
Herceptin’s core composition-of-matter patent expired in 2019 in the U.S. market. By that point, multiple trastuzumab biosimilars had received FDA approval — Kanjinti, Herzuma, Ontruzant, Trazimera, and Ogivri were all available.
Despite this, Roche/Genentech maintained substantial market share into 2020 and beyond, sustained partly by contract rebates and partly by physician familiarity. The erosion was real but gradual, and it occurred primarily in payer-driven segments rather than in Medicare fee-for-service, where providers retained buy-and-bill incentives that favored originators.
The trastuzumab biosimilar market is now well established and price competition has intensified. But this took several years after formal patent expiry to materialize at scale — years during which Roche continued generating meaningful Herceptin revenue on top of an R&D investment that had already been recovered many times over.
3.3 Case Study: Rituximab’s Extraordinary Commercial Longevity
Rituximab’s original U.S. patent expired in 2016. Biosimilar applications followed, and Truxima, Ruxience, and Riabni eventually received approval and gained market share. But the transition was slow. In 2019, three years after patent expiry, the originator product still held the majority of the CLL and NHL treatment market in Medicare Part B.
The Part B setting — where oncologists purchase and administer drugs in-office and are reimbursed at Average Sales Price plus 6% — creates a structural incentive to use the higher-priced product, since the 6% add-on generates more absolute dollars per administration on expensive drugs. This incentive does not disappear with biosimilar entry; it simply shifts in favor of whichever product has the higher ASP, which, initially at least, is still the originator.
For practitioners using patent and exclusivity data, understanding the interplay between biosimilar entry dates, ASP dynamics, and Part B reimbursement mechanics is as important as knowing the patent expiry date itself.
Part IV: The Market Context — $518 Billion and Growing
4.1 The Oncology Drug Market: Scale, Growth, and Concentration
The global oncology drugs market was valued at $201.75 billion in 2023. By 2024, it crossed $220 billion, and industry projections — which carry their own methodological limitations but are broadly consistent across forecasting firms — put it at $518.25 billion by 2032, representing an 11.3% compound annual growth rate [Fortune Business Insights, 2024].
For context: that CAGR is approximately three times the underlying rate of global economic growth and substantially above the growth rates of most other pharmaceutical therapeutic areas. Oncology has been, for a decade, the single largest and fastest-growing category in the pharmaceutical market.
North America accounts for roughly 46% of that market — approximately $92.65 billion in 2023 — driven by a combination of higher cancer incidence screening rates, higher per-drug prices relative to other high-income countries, and reimbursement structures that have historically placed fewer constraints on drug pricing than European frameworks [Fortune Business Insights, 2024].
The American Cancer Society reported approximately 1,958,310 new cancer cases expected in the U.S. by end of 2023, representing a 28% increase from 2010 figures. That rising incidence base is a genuine driver of market growth — more patients, more treatment lines, longer survival that converts what were formerly terminal conditions into chronic ones requiring continuous treatment. Chronic use, in economic terms, is transformative for a drug’s revenue trajectory.
4.2 Targeted Therapies: The Commanding Commercial Position
Targeted therapies — drugs designed to interfere with specific molecular targets involved in cancer growth — hold the dominant market position within oncology. By 2023, they represented approximately 48% of all FDA-approved cancer treatments, nearly half of the 573 total approved agents [Fortune Business Insights, 2024].
The commercial logic of targeted therapies is layered. They typically require a companion diagnostic, which creates patient selection that improves response rates in trials and therefore accelerates regulatory approval. Improved response rates translate into stronger clinical trial data, which supports value-based pricing arguments. They are often first-in-class within their molecular target category, giving them years of market exclusivity without therapeutic competition. And because they are frequently biologics or complex small molecules with significant formulation IP, their patent lives can be extended well beyond the original composition-of-matter expiry.
Regulatory data from the FDA confirms the trend: the agency’s approval rate for targeted therapies accelerated significantly through the 2010s and into the 2020s, with breakthrough therapy designation, accelerated approval, and priority review pathways increasingly concentrated in the oncology space.
New cancer drugs with costs above $200,000 per year accounted for 44% of launches in the past five years, according to IQVIA Institute for Human Data Science reporting. That figure encapsulates where the market is heading: higher prices, more targeted patient populations, and longer treatment durations.
4.3 The Immunotherapy Wave: A New Cost Layer
The data underlying the Tay-Teo analysis runs through 2017. The checkpoint inhibitor revolution — pembrolizumab, nivolumab, atezolizumab, and their successors — was just beginning to show its commercial scale at that cutoff point. The PD-1/PD-L1 inhibitor class has since become one of the highest-revenue categories in all of pharmaceuticals.
Keytruda (pembrolizumab) alone generated $25 billion in global sales in 2023, across more than 30 indications spanning virtually every major solid tumor type. That revenue figure, for a single molecule approved in 2014, would place it in the top tier of the Tay-Teo return distribution were the analysis repeated today.
The immunotherapy class also illustrates the indication expansion phenomenon at its most commercially powerful. Each new indication approval does not require developing a new molecule. It requires a clinical trial — expensive but a fraction of the original development cost — and produces a new patient population eligible for a drug that may already have recovered its full R&D cost several times over. When Merck pursues a new Keytruda indication, it is not taking on $794 million of R&D risk. It is funding a confirmatory trial in a drug whose core R&D investment is many years in the past.
Part V: Financial Toxicity, Access, and the Policy Response
5.1 What ‘High Returns’ Cost Patients
The financial returns generated by cancer drugs are not abstract numbers. They are the other side of the prices that patients pay — or cannot pay.
In 2019, the monthly cost of drug treatment for cancer was 2.3 times more in the United States than in comparable European countries where drug prices are subject to negotiation. A patient on ibrutinib for chronic lymphocytic leukemia was paying, at U.S. list prices, roughly $14,000 per month. That is approximately $168,000 per year for a drug that AbbVie launched at a price point set by what the market would bear, not by what the R&D required.
Financial toxicity — the measurable harm to patients’ financial wellbeing caused by high out-of-pocket medical costs — has become a recognized clinical phenomenon. Research has documented that patients who experience financial toxicity skip doses, forego follow-up appointments, and report lower quality of life scores. For Medicare patients in particular, the pre-IRA absence of an out-of-pocket cap on Part D spending left many patients with costs that consumed retirement savings.
Even insured patients face cost-sharing structures that can reach thousands of dollars per month for specialty oncology drugs. Copay assistance programs from manufacturers address some of this gap, but they do not function in government insurance programs and do not reduce the overall cost to payers and taxpayers.
As the King’s College London Institute of Cancer Policy analysis noted, ‘there is no connection between the prices set for individual drugs and their prior R&D costs, or subsequent returns on investment’ [King’s College London, 2024]. The industry’s consistent ROI pattern, and the equally consistent pricing pattern it sustains, reflects pricing power rather than cost recovery.
5.2 Healthcare System Sustainability
Public payers in Europe reached this conclusion decades ahead of the U.S. Most European countries operate health technology assessment processes — NICE in the UK, IQWIG in Germany, HAS in France — that set a ceiling on what the health system will pay for a drug based on its demonstrated clinical benefit relative to alternatives, regardless of the manufacturer’s list price. Drugs that do not meet the cost-effectiveness threshold are either not reimbursed or reimbursed only after substantial price negotiation.
The result is a persistent price gap between the U.S. and comparable markets. That gap is not primarily explained by higher R&D costs in the U.S. or by U.S. patients bearing a disproportionate share of global innovation funding, though industry makes both arguments. It is explained primarily by the absence, until recently, of any federal price negotiation mechanism in the U.S. system.
The sustainability concern is real. Oncology spending in the U.S. has grown at rates that outpace both general healthcare inflation and GDP growth. Payers — commercial insurers, self-insured employers, state Medicaid programs, and Medicare — face rising oncology drug costs with limited tools to manage them. The consequence is tighter utilization management: prior authorization requirements, step therapy protocols, and formulary exclusions that add administrative burden and sometimes delay access to appropriate treatments.
5.3 The Innovation Incentive Argument: What Does the Evidence Actually Support?
The standard industry response to pricing criticism is that high prices fund future innovation. If prices are reduced, the argument goes, companies will invest less in R&D, fewer drugs will be developed, and patients will ultimately suffer more harm from lack of new treatments than they currently suffer from high prices.
This argument has genuine force at the margin. Pharmaceutical R&D is genuinely expensive, genuinely risky, and genuinely dependent on the expectation of commercial return. The CBO has documented that the ratio of R&D spending to total sales in the pharmaceutical industry increased from 11.9% to 17.7% from 2008 to 2019, reflecting rising real costs [CBO, 2021].
But the evidence does not support using this argument to defend current pricing for drugs generating 14 to 55 times their development cost. The relevant question is not whether any reduction in price would harm innovation incentives — it would, at some level. The question is whether there is significant space between current prices and the floor at which innovation incentives would actually be compromised.
The data from Tay-Teo and others suggest that space is large. If cancer drug prices were cut by 50%, the median drug would still generate $7.25 per R&D dollar invested. At a 75% reduction, the median would be $3.63 per dollar. Neither figure suggests a market in which rational companies would exit oncology R&D.
What the ROI data does not address — and what is a legitimate concern — is the behavior of companies at the margin: the drugs with returns at the low end of the distribution, drugs for rare cancers with small patient populations, drugs at early clinical stages where the probability of approval is low and the cost of failure is high. Pricing policy that uniformly compresses returns without accounting for this heterogeneity could, in principle, reduce investment in precisely the areas where investment is most needed.
A research inquiry led by academics at King’s College London found that the return on investment for cancer medicines launched between 1997 and 2015 ranges between 435% and 551%, but ‘hides huge variation,’ with a substantial number of cancer medicines generating negative or flat ROIs [King’s College London, 2024]. The drugs with 3,000%-plus ROIs and the drugs with negative ROIs are both real. Policy that treats them identically makes neither group better off.
Part VI: The Inflation Reduction Act — Pricing Policy Meets the Oncology Market
6.1 What the IRA Actually Does
The Inflation Reduction Act, signed in August 2022, represents the most significant structural change to U.S. drug pricing policy since the creation of Medicare Part D in 2003. Its three main pricing provisions are:
The IRA alters the current structure of the Medicare Part D standard benefit, eliminating the infamous ‘donut hole’ under the new design and setting an annual out-of-pocket cap for beneficiary drug costs. The cap is set at $2,000 beginning in 2025.
The IRA grants the Centers for Medicare & Medicaid Services the authority to negotiate prices directly with manufacturers for high-expenditure drugs that have no generic or biosimilar competition. The process began with 10 Part D drugs in 2026, expands to additional drugs each year through 2029 and beyond.
Manufacturers face a penalty — in the form of an excise tax that escalates to as much as 95% of sales — if they refuse the negotiated price and want to keep their products in Medicare.
For drugs used to treat diseases common in the older population, the IRA price-setting process is projected to yield savings of $1.5 billion in 2026 after the first round of negotiations.
6.2 Oncology Drugs Already in the Negotiation Pipeline
Cancer drugs are well-represented in the IRA’s negotiation program. Ibrutinib (Imbruvica) was selected in the first cycle, with negotiated prices taking effect in 2026. The second cycle, with prices effective 2027, includes enzalutamide (Xtandi), palbociclib (Ibrance), and pomalidomide (Pomalyst) [AJMC, 2026].
The first round of price setting, set to take effect in 2026, affects ibrutinib [Imbruvica]. The second round, which will be implemented in 2027, includes enzalutamide [Xtandi] and palbociclib [Ibrance].
Each of these drugs represents billions of dollars in annual Medicare spending. Each also represents a drug where, when you apply the Tay-Teo analytical framework, the return on R&D investment is likely to be very high. Ibrutinib, approved in 2013 for mantle cell lymphoma and subsequently approved for multiple hematologic malignancies, generated global revenue exceeding $4 billion annually before biosimilar competition began. Xtandi, approved in 2012 for prostate cancer, generates comparable revenues.
The CMS negotiation process is not designed to return drugs to cost-plus pricing. It is designed to negotiate a ‘maximum fair price’ that reflects clinical benefit, available alternatives, and the drug’s remaining exclusivity period. The negotiated prices remain substantially above generic price levels. But they represent a structural compression of the returns that the Tay-Teo analysis documented, applied specifically to the drugs most used in Medicare.
6.3 The IRA’s Unintended Consequences for Small Molecules
IRA provisions reduce incentives for cutting-edge small-molecule R&D by shortening the market exclusivity period before CMS price setting begins. This can also discourage post-approval trials, with potentially significant consequences for oncology and other therapeutic areas where pursuing additional indications or patient populations after initial approval is crucial to address unmet medical needs.
The IRA distinguishes between small molecules and biologics in its negotiation timeline: small molecules become eligible after 9 years; biologics, after 13. This gap creates a commercial distortion. A company developing a new oncology drug that works equally well as a small molecule or a biologic now has a financial incentive to pursue the biologic path, regardless of which is more scientifically appropriate for the indication.
Many have proposed other impacts of the IRA, such as an even greater shift toward biologics vs small molecules or shifts away from early-stage R&D in areas where a major player is likely to have its price cut soon under the IRA.
This distortion is measurable and consequential. Small molecule drugs treat a broad range of cancers, can be taken orally (eliminating infusion requirements), and are often substantially cheaper to manufacture than biologics. A policy environment that systematically disadvantages small molecules in favor of biologics will, over time, shift the oncology pipeline in ways that may not serve patients’ interests — or payers’.
The concern about post-approval indication expansion is similarly grounded in data. More than half of new approvals for orphan oncology conditions from 2013 to 2017 were subsequent indications. If IRA-driven price setting applies to all indications of a drug simultaneously, the incentive to pursue additional indications — which are often the most innovative and the most important for patients with rare cancers — is materially reduced.
6.4 The Part D Out-of-Pocket Cap: The Provision That Matters Most for Patients
Among the IRA’s provisions, the $2,000 out-of-pocket cap for Medicare Part D beneficiaries is likely to have the most immediate and widespread impact on cancer patients’ financial wellbeing. Cancer care, including high-priced prescription cancer drugs, is often burdensome or entirely cost-prohibitive for patients in the U.S. Historically, there has never been a limit on out-of-pocket spending on prescription drugs for people enrolled in Medicare Part D, which left many beneficiaries struggling to cover costs of expensive, but necessary, cancer drugs.
A cancer patient on an oral targeted therapy — ibrutinib, palbociclib, or a similar agent — prior to 2025 could face out-of-pocket costs of $10,000 or more annually after insurance. The $2,000 cap does not reduce the drug’s price. It shifts the cost above $2,000 from the patient to the plan and manufacturer through a new discount program structure. For patients, the effect is straightforward: the drugs become substantially more affordable in terms of personal cash outlay.
Part VII: Patent Intelligence as a Commercial Tool
7.1 Reading the Patent Landscape in Oncology
Understanding the financial returns that oncology drugs generate requires understanding the patent architecture that sustains those returns. The 5-year median cost recovery period sits inside a much longer period of commercial exclusivity. How that exclusivity is structured — how many patents of which types cover the product, when they expire, and what the biosimilar or generic entry landscape looks like — determines how long the return on R&D investment continues to compound.
DrugPatentWatch tracks the patent and exclusivity landscape for FDA-approved drugs in detail that goes substantially beyond the FDA Orange Book’s statutory listings. For any cancer drug, the platform maps composition-of-matter patents, method-of-use patents covering specific indications, formulation patents, manufacturing process patents, and dosing regimen patents — all of which can extend effective market exclusivity well past the original compound patent expiry. It also tracks paragraph IV certifications, which signal that a generic or biosimilar manufacturer has filed a challenge to listed patents and intends to enter the market.
For payers analyzing a drug that may be generating a 20:1 return on R&D investment, the key question is not whether competition will eventually arrive, but when. A drug whose compound patent expires next year but whose method-of-use patents run for another 12 years is in a fundamentally different commercial position than a drug facing a clean patent cliff. That distinction does not appear in any single public source; it requires synthesis of patent data, exclusivity dates, litigation status, and biosimilar development timelines.
7.2 The Evergreening Pattern in Oncology Biologics
Patent evergreening — the practice of filing secondary patents that extend effective exclusivity beyond the primary compound patent — is particularly prevalent among oncology biologics. A large biologic may have a compound patent expiring in year 10 post-approval, but a portfolio of manufacturing process patents, device patents (covering delivery systems), and formulation patents that collectively keep potential biosimilar manufacturers in court for years afterward.
The patent dance provision of the BPCIA — a mandatory exchange of patent information between biosimilar applicants and reference product sponsors — has itself become a tool for delaying entry, as originator companies use the process to force litigation timing that extends their exclusivity period. Monitoring the specific patents asserted in BPCIA litigation, and tracking their individual expiry dates, is one of the more data-intensive tasks in oncology competitive intelligence.
This legal complexity is part of what produces the post-exclusivity revenue persistence that the Tay-Teo analysis documented in biologics. It is not simply physician conservatism or manufacturing complexity: it is, in many cases, deliberate intellectual property strategy that effectively keeps the market exclusivity period running longer than a nominal patent expiry date would suggest.
7.3 Generic and Biosimilar Entry Dynamics: What the Data Shows
For small molecule cancer drugs, the Hatch-Waxman framework has worked roughly as intended. Generic entry after patent expiry typically reduces originator prices dramatically within two to three years, and market share shifts heavily to generics. The economic returns from the originator’s commercial perspective are largely front-loaded — hence the importance, documented above, of the rapid cost recovery timeline.
The competitive intelligence task for small molecule oncology generics is primarily about timing: which patents are actually enforceable, which are vulnerable to invalidity arguments, and whether a paragraph IV challenge has any reasonable chance of succeeding. These are legal questions with financial implications, and the outcomes materially affect the commercial value of the originator product in its final years of exclusivity.
For biologics, the question is more complex. Biosimilar entry is not binary — even after a biosimilar is approved, its market penetration depends on payer formulary decisions, GPO contracting, ASP dynamics in the Part B setting, and prescriber behavior. Tracking which biosimilars are approved, which are FDA-designated as interchangeable, and which have actually gained material market share requires ongoing monitoring rather than a one-time patent review.
Part VIII: Structural Accountability and Transparency
8.1 The Transparency Gap
One of the consistent findings across the literature on oncology drug pricing is that the gap between list prices, net prices, and actual R&D costs is almost impossible to close using publicly available data alone. Pharmaceutical companies report total R&D spending in annual financial statements, but they do not report drug-specific R&D costs. They negotiate confidential rebates with payers that make net prices substantially lower than list prices. And they routinely invoke trade secrecy to resist disclosure of pricing calculations.
This opacity is not accidental. It is structurally useful. A company that discloses it spent $400 million developing a drug it is now selling at a list price that will generate $10 billion in revenue has a harder time maintaining the R&D-cost justification for that price than a company that keeps the numbers separate.
The researchers behind the Tay-Teo study had to construct their dataset from originator companies’ annual reports, which do not disaggregate by product in a standardized way. For years where data was missing, they estimated. The result is still the most comprehensive dataset of its kind, but it required substantial methodological labor that would be unnecessary if pharmaceutical companies disclosed product-level financial data as a matter of course.
The WHO Transparency Resolution of 2019 called for exactly this kind of disclosure, including ‘actual net prices paid by governments and other purchasers’ and ‘costs of research and development.’ Progress toward implementation has been slow.
8.2 Public Funding of ‘Private’ Cancer Drug R&D
The conversation about R&D costs and pricing returns consistently understates one factor: the substantial public contribution to the basic science underlying cancer drug development.
A 2018 analysis examined every one of the 210 drugs approved by the FDA from 2010 to 2016 and found that every single one had received NIH funding at some stage of development, with total NIH support of $100 billion over the period [Cleary et al., 2018]. The number that entered private development was the result of decades of publicly funded research into the molecular biology of cancer — research into p53, into HER2, into BCR-ABL, into PD-L1 — that was conducted in universities and national laboratories using taxpayer money.
When a pharmaceutical company cites $2.6 billion in R&D costs per approved drug, that figure does not include the NIH funding that identified the target, validated the pathway, and produced the foundational biology that the company’s drug program built upon. Including public R&D contributions would require a substantially different conversation about what prices are actually justified.
The ecancer editorial analysis of cancer drug economics noted that ‘none of these figures take into account public underpinning R&D funding which is intimately woven into the private sector’ [ecancer, 2024]. That observation does not appear in the pharmaceutical industry’s standard pricing arguments.
8.3 Stock Buybacks and the R&D Investment Claim
There is a parallel question about where pharmaceutical profits go after cost recovery. The King’s College analysis cites the work of economist William Lazonick in noting that ‘the majority of pharmaceutical industry profits are not ploughed back into R&D but instead used for open market stock buybacks’ [ecancer, 2024].
Between 2009 and 2018, the 18 largest pharmaceutical companies in the S&P 500 spent $516 billion on stock buybacks — a figure that exceeds the $465 billion they spent on R&D over the same period [Lazonick et al., 2019]. This does not mean R&D investment was insufficient, but it does substantially undercut the argument that high prices are necessary to sustain R&D spending. If the marginal dollar of profit is going to buybacks rather than to the next drug candidate, the causal link between high prices and future innovation is more tenuous than industry arguments imply.
Part IX: Implications for Practitioners — Payers, Investors, and Analysts
9.1 For Payers and Pharmacy Benefit Managers
The Tay-Teo data has direct, usable implications for formulary and contracting strategy. A drug generating a 30:1 return on R&D investment has substantially more pricing headroom than a drug at 3:1. Knowing where in that distribution a specific drug sits — and knowing how much exclusivity runway it has left before biosimilar competition arrives — tells you how much negotiating leverage you actually have.
Payers who ask manufacturers to disclose product-specific R&D costs will not get answers. But they can use the academic literature, patent expiry data from platforms like DrugPatentWatch, and post-market revenue trajectories visible in financial statements to construct a reasonable picture of a drug’s economic position. That picture is more useful in negotiation than accepting the manufacturer’s framing at face value.
The IRA’s negotiation program does some of this work for Medicare. Commercial payers, Medicaid managed care organizations, and self-insured employers who cover non-Medicare populations do not have access to the same statutory negotiation authority, but they can use rebate structures, formulary placement, and utilization management to achieve some price moderation.
9.2 For Pharmaceutical Investors
For investors analyzing oncology companies, the Tay-Teo return distribution provides a useful calibration tool. A drug with a plausible indication in a large patient population, biological classification (which extends the pre-negotiation exclusivity window under the IRA), and limited near-term competition has the structural characteristics of a high-return asset. A small molecule drug in a space where generic competition is imminent, or where IRA negotiation timelines are short, requires a different valuation approach.
Patent expiry dates and exclusivity timelines are not the whole story. The post-expiry revenue persistence documented for biologics suggests that portfolio analysis should include a set of assumptions about how quickly biosimilar competition actually erodes originator revenues in the specific market segment — Part B vs. Part D, hematology vs. solid tumors, community practice vs. academic medical center — not just when the first biosimilar is approved.
The IRA introduces a new variable: drugs that CMS selects for negotiation will face price reductions effective 2 to 3 years after selection, and those reductions may affect commercial pricing through reference pricing dynamics. An oncology drug facing IRA negotiation in cycle 3 or 4 has a meaningfully different revenue trajectory than one with no near-term Medicare exposure.
9.3 For Policy Analysts and Health Economists
The most durable finding from this literature is the disconnect between the prices cancer drugs charge and the prices they would need to charge to recover their development costs and generate a reasonable return on investment.
That disconnect does not automatically translate into a specific policy prescription. Pharmaceutical pricing is embedded in a larger ecosystem of incentive structures, market dynamics, and geopolitical considerations. Reducing U.S. prices while other markets already pay less creates free-rider questions that are genuinely complex. The IRA’s small molecule/biologic distinction creates its own distortions. Value-based arrangements that tie price to outcomes sound appealing but require outcomes data that is expensive and slow to generate.
What the data does rule out is the use of R&D cost recovery as the primary justification for current oncology drug pricing. Drugs that recover their maximum possible R&D cost within 5 years and then continue to generate high returns for another 10 to 15 years are not priced to recover R&D costs. They are priced at the upper limit of what the market will bear. That is a legitimate business strategy. It is not a public health justification.
Part X: The Path Forward
10.1 Value-Based Pricing: The Architecture and Its Limits
Value-based pricing — setting prices according to the clinical benefit a drug delivers, measured in quality-adjusted life years or other standardized metrics — is the framework most commonly proposed as an alternative to cost-recovery pricing. It has the conceptual appeal of aligning payment with outcome. It also has real-world limitations.
Cancer drugs frequently receive initial approval based on surrogate endpoints — progression-free survival, response rate, biomarker change — rather than overall survival. The clinical value of many approved drugs, measured in additional life-years gained, is modest. A drug that extends median PFS by 2 months in a third-line setting has real clinical value for some patients in that specific situation. Whether that value justifies a $150,000 annual price is a question that value-based frameworks can address more rigorously than current pricing practices.
The core objection from manufacturers is that value-based frameworks, applied across all payers, effectively collapse to price controls. This is partly right — a QALY-based ceiling applied uniformly would constrain prices for drugs above that ceiling — and it is also partly irrelevant to the question of whether the current system is appropriately calibrated. A system that allows drugs to charge at the upper limit of what payers will accept, independent of clinical benefit or development cost, has no self-correcting mechanism.
10.2 Competition as the Simplest Mechanism
The most durable price discipline mechanism in pharmaceuticals is not regulation. It is competition. When multiple agents compete for the same clinical indication, prices come down — sometimes substantially, as the PCSK9 inhibitor category demonstrated after rebate competition intensified between Repatha and Praluent.
In oncology, competition works where the science has produced multiple agents hitting similar targets or mechanisms: multiple BTK inhibitors for CLL, multiple CDK4/6 inhibitors for breast cancer, multiple checkpoint inhibitors across tumor types. The IRA provisions that may discourage post-approval indication development for small molecules could, counterintuitively, reduce competition in exactly these settings over time.
Biosimilar competition, where it has actually taken hold, is another effective mechanism. The Humira biosimilar market, after years of delay, eventually saw meaningful price competition that reduced originator share and drove down net costs. Oncology biologic biosimilars are following a similar trajectory, with a lag. Policies that accelerate biosimilar uptake — through formulary incentives, interchangeability designation requirements, or ASP reform in Part B — can generate faster and more durable savings than negotiated price reductions for individual drugs.
10.3 Transparency as a Prerequisite for Everything Else
No pricing reform mechanism — value-based pricing, negotiation, increased competition — works well without better data. The fundamental information asymmetry in pharmaceutical pricing, where companies know their development costs and payers do not, is a structural feature of the market that benefits sellers.
Requirements for product-level R&D cost disclosure, even on a time-delayed basis, would substantially shift the information environment in which pricing negotiations occur. The industry’s objection is that such disclosure would give competitors proprietary intelligence. This is a real concern for early-stage development costs. It is considerably less compelling for drugs that have already been approved and are earning billions in annual revenue.
The WHO Transparency Resolution and various national legislative proposals have tried to move this agenda forward. Progress has been slow, but the analytical tools available to researchers and practitioners — patent databases, SEC filings, financial statements, and aggregators like DrugPatentWatch that synthesize IP and regulatory data into actionable intelligence — continue to narrow the information gap.
Key Takeaways
The core finding is durable across methodologies. Whether you use the Tay-Teo dataset of 99 drugs, the Prasad-Mailankody sample of 10, or the King’s College analysis covering 1997 to 2020, the conclusion is consistent: cancer drug revenues substantially exceed plausible R&D cost estimates. The specific ratios differ based on methodology, but none of the credible analyses supports the claim that current pricing is necessary for cost recovery.
The return distribution is wide, and that matters for policy. A uniform pricing intervention that compresses returns equally for drugs at $3.30 per R&D dollar and drugs at $55.10 per R&D dollar would treat structurally different situations identically. Effective policy needs to distinguish between drugs where returns are genuinely extraordinary and drugs where the margin above development cost is thin.
Post-exclusivity revenue for biologics is a structural feature, not a windfall. It results from manufacturing complexity, regulatory design, prescriber behavior, and originator defense strategies. Understanding the specific patent and exclusivity architecture behind any given biologic — available in detail through platforms like DrugPatentWatch — is necessary for predicting how quickly and deeply competition will affect revenues.
The IRA is a significant intervention with significant side effects. The $2,000 Part D out-of-pocket cap is the provision most directly beneficial to cancer patients. The negotiation program will reduce Medicare spending on specific drugs. The small molecule/biologic timeline distinction is creating pipeline distortions that the policy’s designers may not have fully anticipated.
Transparency is the prerequisite for everything else. The R&D cost debate exists partly because companies are not required to disclose what they actually spent on specific drugs. The return-on-investment data documented in this report comes from researchers who had to construct it from incomplete public sources. Better mandated disclosure would make the relationship between prices and costs visible and verifiable rather than a matter of perpetual dispute.
The oncology market will be $518 billion by 2032. The financial stakes of getting pricing policy right — for patients, for payers, for the sustainability of healthcare systems, and for the innovation ecosystem that produces new treatments — will only grow. The analytical frameworks and data infrastructure to navigate those stakes are improving. The political will to use them is the remaining constraint.
FAQ
Q1: How was the $14.50 return per R&D dollar calculated, and can it be trusted?
The figure comes from a 2019 study published in JAMA Network Open by WHO researchers Tay-Teo, Ilbawi, and Hill. They collected 1,040 data-year observations of annual sales revenue from the annual reports of originator companies for 99 FDA-approved cancer drugs and compared cumulative revenues against three risk-adjusted R&D cost benchmarks drawn from the peer-reviewed literature. The $14.50 figure uses the median benchmark of $794 million as the denominator. The methodology has limitations — some data points were estimated where company reports had gaps, and the sample excludes drugs with insufficient sales history — but it is the most comprehensive analysis of its kind using publicly available financial data. Two independent studies using different methods reached the same qualitative conclusion, which strengthens confidence in the directional finding even if the specific ratio carries uncertainty.
Q2: Does the IRA’s drug price negotiation program actually change the economics documented in this report?
For the specific drugs selected for negotiation and for the Medicare segment of the market, yes. Ibrutinib, enzalutamide, and palbociclib face real price reductions under IRA-negotiated maximum fair prices. For the broader oncology market, including commercial insurance, Medicaid managed care, and non-U.S. markets, the IRA has no direct effect. The drugs that dominate the high-return tier of the Tay-Teo distribution — rituximab, trastuzumab, bevacizumab — have already transitioned to biosimilar competition and are in a different commercial phase. The IRA’s primary impact is on the next generation of mature, high-revenue drugs with remaining patent exclusivity.
Q3: If cancer drugs are generating such high returns, why do so many small biotech companies fail?
The survival rate for early-stage oncology drug candidates is genuinely low. Across all therapeutic areas, approximately 90% of drug candidates that enter clinical trials never reach approval, and in oncology the clinical failure rate has historically been even higher. Small biotechs developing single assets bear the full cost of failures with none of the portfolio diversification that large companies have. Many of these companies never generate revenue. The high returns documented in the Tay-Teo study are the returns on drugs that succeeded — they are not the average return across all investments, including failed ones. This is exactly the risk-adjustment issue at the center of the R&D cost debate. The return figures are large enough, however, that even after adjusting for the full portfolio failure rate, the economics of successful cancer drugs remain highly favorable for the companies that develop them.
Q4: How do biosimilar entry dynamics in oncology differ from the generic drug market for non-oncology drugs?
The key differences are regulatory pathway complexity, manufacturing barriers, and prescriber behavior. Generic small molecule drugs can be approved through the ANDA pathway without clinical trials if they demonstrate bioequivalence. Biosimilars require clinical immunogenicity studies and, for interchangeability designation, additional switching studies. This makes biosimilar development more expensive and time-consuming. Manufacturing biologics is also technically harder than synthesizing small molecules, creating a higher barrier to entry. In practice, biosimilar entry in oncology has taken 3 to 7 years to materially affect originator market share even after formal approval, compared to 2 to 3 years for most small molecule generics. Patent litigation under the BPCIA’s patent dance provisions adds further delay. Tracking where specific oncology biologics are in this cycle — using patent expiry data, biosimilar approval status, and market share data together — is the core analytical task for anyone managing exposure to these drugs from a payer or investor perspective.
Q5: Is there a fair price for a cancer drug? What would it look like?
‘Fair’ depends on what objective function you are optimizing. A price that covers development costs plus a reasonable return on investment is one definition. A price that maximizes affordability subject to maintaining innovation incentives is another. A value-based price linked to clinical benefit in quality-adjusted life years is a third.
These three definitions produce different numbers. A cost-recovery price for a drug with $794 million in risk-adjusted R&D costs, recovering that cost over 5 years with a 15% return on capital, implies an annual revenue target of roughly $230 million — a figure that, for most oncology drugs, would be achievable at a price point well below current list prices given the patient populations involved. A value-based price based on QALY thresholds used by NICE (approximately £30,000 per QALY in the UK, roughly $37,500) would produce prices substantially below U.S. list prices for most oncology drugs but above what many lower-income countries can sustain. The academic literature has proposed models that incorporate R&D costs, manufacturing, clinical benefit, and market size into a single pricing equation — none has achieved broad adoption.
The most honest answer is that ‘fair’ is a normative concept that economics alone cannot settle. What the data can do — and what this analysis has attempted — is establish what the prices are, what the returns are, and what the claimed justifications for those prices actually support.
Citations
[1] Tay-Teo, K., Ilbawi, A., & Hill, S. R. (2019). Comparison of sales income and research and development costs for FDA-approved cancer drugs sold by originator drug companies. JAMA Network Open, 2(1), e186875. https://doi.org/10.1001/jamanetworkopen.2018.6875
[2] Prasad, V., & Mailankody, S. (2017). Research and development spending to bring a single cancer drug to market and revenues after approval. JAMA Internal Medicine, 177(11), 1569–1575. https://doi.org/10.1001/jamainternmed.2017.3601
[3] Wouters, O. J., McKee, M., & Luyten, J. (2020). Estimated research and development investment needed to bring a new medicine to market, 2009–2018. JAMA, 323(9), 844–853. https://doi.org/10.1001/jama.2020.1166
[4] DiMasi, J. A., Grabowski, H. G., & Hansen, R. W. (2016). Innovation in the pharmaceutical industry: New estimates of R&D costs. Journal of Health Economics, 47, 20–33. https://doi.org/10.1016/j.jhealeco.2016.01.012
[5] Congressional Budget Office. (2021). Research and development in the pharmaceutical industry. CBO. https://www.cbo.gov/publication/57126
[6] Sertkaya, A., Beleche, T., Jessup, A., & Sommers, B. D. (2024). Costs of drug development and research and development intensity in the US, 2000–2018. JAMA Network Open, 7(6), e2415445. https://doi.org/10.1001/jamanetworkopen.2024.15445
[7] King’s College London Institute of Cancer Policy. (2024, September 9). Oncology drugs estimated to be $1 billion cheaper to develop through a precision approach. King’s College London. https://www.kcl.ac.uk/news/oncology-drugs-estimated-to-be-1-billion-cheaper-to-develop-through-a-precision-approach
[8] Cleary, E. G., Beierlein, J. M., Khanuja, N. S., McNamee, L. M., & Ledley, F. D. (2018). Contribution of NIH funding to new drug approvals 2010–2016. Proceedings of the National Academy of Sciences, 115(10), 2329–2334. https://doi.org/10.1073/pnas.1715368115
[10] IQVIA Institute for Human Data Science. (2023). Global oncology trends 2023. IQVIA.
[11] NPR Health Shots. (2017, September 11). R&D costs for cancer drugs are likely much less than industry claims, study finds. https://www.npr.org/sections/health-shots/2017/09/11/550135932/r-d-costs-for-cancer-drugs-are-likely-much-less-than-industry-claims-study-finds
[12] Wong, C. H., Siah, K. W., & Lo, A. W. (2019). Estimation of clinical trial success rates and related parameters. Biostatistics, 20(2), 273–286. https://doi.org/10.1093/biostatistics/kxx069
[13] AJMC Editorial Staff. (2026, March 6). Inflation reduction act impact on the hematology/oncology treatment landscape. American Journal of Managed Care. https://www.ajmc.com/view/inflation-reduction-act-impact-on-the-hematology-oncology-treatment-landscape
[14] OncLive Staff. (2025, December 1). Inflation reduction act leads to seesaw effect between oncologic drug savings and development. OncLive. https://www.onclive.com/view/inflation-reduction-act-leads-to-seesaw-effect-between-oncologic-drug-savings-and-development
[15] ITIF. (2025, February 25). The Inflation Reduction Act is negotiating the United States out of drug innovation. Information Technology and Innovation Foundation. https://itif.org/publications/2025/02/25/the-inflation-reduction-act-is-negotiating-the-united-states-out-of-drug-innovation/
[16] AJMC Editorial Staff. (2023). Why does the Inflation Reduction Act exclude expensive cancer treatments in price negotiations? JCO Oncology Practice. https://ascopubs.org/doi/10.1200/OP.23.00400
[17] Sullivan, R. (2024). Cancer medicines: a private vice for public benefit? ecancer. https://ecancer.org/en/journal/editorial/131-cancer-medicines-a-private-vice-for-public-benefit
[18] Managed Healthcare Executive Editorial Staff. (2024, January 8). Analysis: R&D costs and innovation not sole drivers of cancer drug prices. Managed Healthcare Executive. https://www.managedhealthcareexecutive.com/view/analysis-r-d-costs-and-innovation-not-sole-drivers-of-cancer-drug-prices
[19] Public Eye. (2021). Big pharma rakes in up to 90% profit on expensive cancer treatments. https://www.publiceye.ch/en/topics/pharmaceutical-industry/no-secret-deals/big-pharma-rakes-in-up-to-90-profit-on-expensive-cancer-treatments
[20] Experts in Chronic Myeloid Leukemia. (2013). The price of drugs for chronic myeloid leukemia (CML) is a reflection of the unsustainable prices of cancer drugs. Blood, 121(22), 4439–4442. https://doi.org/10.1182/blood-2013-03-490003
[21] Lazonick, W., Hopkins, M., Jacobson, K., Sakinc, M. E., & Tulum, O. (2019). US pharma’s financialized business model. Institute for New Economic Thinking. https://doi.org/10.36687/inetwp60
[22] AJMC Editorial Staff. (2025). Unintended consequences of the Inflation Reduction Act: Clinical development toward subsequent indications. American Journal of Managed Care. https://www.ajmc.com/view/unintended-consequences-of-the-inflation-reduction-act-clinical-development-toward-subsequent-indications
[23] Cardinal Health. (2023). The Inflation Reduction Act: Drug pricing implementation progress. https://www.cardinalhealth.com/en/services/specialty-physician-practice/resources/healthcare-policy/inflation-reduction-act.html
[24] NORC at the University of Chicago. (2023). Inflation Reduction Act’s impact on prescription drug spending. https://www.norc.org/research/projects/inflation-reduction-act-impact-prescription-drug-spending.html