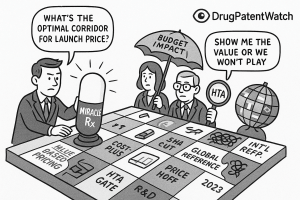
Welcome. You are about to embark on a journey into one of the most complex, high-stakes, and consequential decisions in modern business: determining the optimal launch price for a new medicine. This is not a simple calculation. It is the culmination of a decade or more of scientific struggle, billions of dollars in investment, and the hopes of countless patients. The final price tag on a new therapy is more than just a number; it is a statement of value, a strategic maneuver in a global chess match, and a critical determinant of a company’s future and a patient’s access to innovation.
We operate in a labyrinthine landscape, a multi-stakeholder arena where the pure economic principles of supply and demand are warped by the profound inelasticity of need, the intricate web of global regulations, and the often-conflicting objectives of manufacturers, payers, providers, and patients. How do you price a drug that can cure a fatal childhood disease? What is the value of an extra six months of life for a cancer patient? These are not just philosophical questions; they are the practical, daily challenges that define our industry.
The Core Dilemma
At the heart of this challenge lies a fundamental and enduring tension. On one hand, there is the societal imperative for broad and affordable access to life-saving medications. On the other, there is the economic reality of pharmaceutical innovation. Bringing a single new drug to market is a monumental undertaking, a high-risk gamble where failure is the norm. Recent analyses place the average capitalized cost per asset at a staggering $2.23 billion, a figure that accounts for the vast sums spent on the many promising candidates that never make it out of the lab. These immense R&D costs, coupled with the long timelines and high attrition rates, create a powerful argument for premium pricing at launch—not just to recoup the investment in one successful drug, but to fund the entire engine of innovation that will produce the cures of tomorrow.
This delicate balancing act is the central theme of our exploration. We will dissect the art and science of pricing, moving beyond simplistic formulas to build a comprehensive strategic framework. Our goal is to equip you, the business professional and strategic leader, with the nuanced understanding and actionable tools required to turn this complex challenge into a sustainable competitive advantage.
Roadmap of the Report
Together, we will navigate this complex terrain. We will begin by deconstructing the foundational pricing models that form the architect’s toolkit. From there, we will enter the “value gauntlet,” examining the powerful Health Technology Assessment (HTA) bodies that act as gatekeepers to global markets. We will then synthesize these concepts into a practical, step-by-step strategic framework, showing you how to leverage competitive intelligence and sophisticated financial modeling to define your price. We will ground our discussion in the real world, analyzing landmark case studies and comparing the unique pricing environments of the US, Europe, and Japan. Finally, we will look to the horizon, exploring the policy shifts, technological advancements, and innovative payment models that are shaping the future of pharmaceutical pricing. Let’s begin.
The Architect’s Toolkit: Foundational Pricing Models and Economic Realities
Before we can construct a sophisticated pricing strategy, we must first master the fundamental tools of the trade. The pharmaceutical industry employs a range of pricing models, each with its own logic, strategic application, and inherent limitations. Understanding these foundational approaches is the first step toward building a nuanced and defensible pricing architecture. While traditionally categorized into distinct models, in practice, the optimal strategy is often a hybrid, a sophisticated blend tailored to the specific drug, disease, and market landscape.
Value-Based Pricing (VBP): The North Star of Modern Pharma
If there is a single concept that has come to dominate modern pharmaceutical pricing discussions, it is Value-Based Pricing (VBP). At its core, VBP is the principle of setting a price commensurate with the value a drug delivers to patients, providers, and the broader healthcare system.1 This is a radical departure from older, cost-focused models. Instead of asking, “What did it cost to make this drug?” VBP asks, “What is this medical advancement
worth?”
Core Concept and Methodology
The “value” in VBP is a multifaceted construct, typically represented as a function of several key factors:
Price=f(Efficacy,Safety,QoL,CostOffsets)
Where:
Efficacy: How well does the drug work compared to the existing standard of care? Does it extend life, reduce symptoms, or achieve a cure?
Safety: Does it have a superior side-effect profile compared to alternatives, leading to better tolerability and adherence?
Quality of Life (QoL): Does the drug allow a patient to return to work, live independently, or experience less pain and suffering?
Cost Offsets: Does the drug reduce the need for other, more expensive healthcare interventions, such as hospitalizations, surgeries, or long-term care?
To be successful, a VBP strategy requires a robust and compelling value narrative, supported by a mountain of data. This evidence must come not only from the controlled environment of clinical trials but also from Real-World Evidence (RWE) that demonstrates the drug’s performance in everyday clinical practice. When executed properly, VBP is a powerful engine for innovation. It creates a direct financial incentive for companies to pursue genuine breakthroughs that deliver meaningful improvements in patient outcomes, rather than marginal, “me-too” products.
Challenges and the VBP Paradox
Despite its conceptual appeal, implementing VBP is fraught with challenges. Quantifying abstract concepts like “quality of life” is inherently difficult and subjective. The data requirements are immense, and the methodologies for calculating value are often complex and contested. This leads to a fundamental conflict in the pharmaceutical ecosystem. While the industry champions VBP as the most ethical and innovation-friendly model, its practical application is often complicated by the very systems designed to assess that value.
Payers and HTA bodies also employ value-based frameworks, but their perspective and objectives can differ dramatically from those of a manufacturer. A pharmaceutical company may define value broadly, incorporating long-term societal benefits, caregiver burden, and the intrinsic worth of innovation itself. A budget-constrained payer, however, may define value much more narrowly, focusing almost exclusively on short-term budget impact and direct, easily quantifiable cost offsets. This creates a situation where the VBP framework becomes less of a precise pricing calculation and more of a contentious negotiation framework. The “optimal price” is not a number derived from an elegant formula but the hard-won outcome of a power struggle over the very definition and quantification of value.
Cost-Plus Pricing: The Legacy Model
Cost-plus pricing is the most traditional and straightforward approach. The logic is simple: calculate all the costs associated with bringing a drug to market, add a desired profit margin, and divide by the expected number of units to be sold.3 The formula is a basic accounting exercise:
Historically, this model was more common, but in today’s value-driven environment, its application is limited. It is most often seen with generic drugs, where production costs are low and competition is high, or for certain established products where the primary goal is to ensure a predictable return. Its main advantages are its simplicity and the assurance of profitability, provided that cost and sales forecasts are accurate. In the early stages of development, when market data is scarce, a quick cost-plus analysis can provide a preliminary floor for pricing scenarios.
The Fatal Flaw
The critical weakness of the cost-plus model is its complete detachment from the value delivered to the patient and the healthcare system. A revolutionary, first-in-class therapy that costs little to produce would be dramatically underpriced using this method, stifling the incentive for future innovation. Conversely, an inefficiently developed “me-too” drug with marginal benefits could be overpriced, rewarding inefficiency rather than clinical advancement. In a healthcare ecosystem increasingly focused on outcomes, cost-plus pricing fails to answer the most important question: “Is the drug worth it?”.
Competitor-Based and Reference Pricing: The Market-Driven Approach
This strategy anchors a new drug’s price to the existing market landscape. Rather than looking inward at costs or outward at abstract value, it looks sideways at the competition.1 The price is set relative to the therapies that physicians and payers already use and understand.
Strategic Nuances
This is not simply a matter of matching a competitor’s price. The strategy is nuanced and depends on the new drug’s clinical profile:
Premium Pricing: If a new drug demonstrates clear superiority in efficacy, safety, or convenience over existing products, it can command a price premium. The size of that premium is a strategic decision based on the magnitude of the clinical advantage.
Parity Pricing: For a drug with a similar clinical profile to existing options (a “me-too” product), pricing at parity is a common strategy to gain market acceptance without triggering a price war.
Penetration Pricing: A company might choose to price its new drug at a discount to the competition. This aggressive strategy is often used to rapidly capture market share, especially in a crowded therapeutic area or when the new drug offers no significant clinical advantage but aims to compete on cost.
The Global Domino Effect of International Reference Pricing (IRP)
A crucial and complex variant of competitor-based pricing is International Reference Pricing (IRP). This is a cost-containment mechanism used by many governments—particularly in Europe and Canada—where the price of a drug in their country is determined by referencing a “basket” of prices for the same drug in other countries.
This practice creates an intricate global web of price interdependencies. A price negotiated in Germany, for example, can directly influence the maximum price achievable in Japan, Canada, and a host of other nations.5 This forces companies to think globally from day one, planning their launch sequence with meticulous care. Launching first in a country with stringent price controls can set a low price “anchor” that drags down the price potential across the globe.
This system, while designed to control costs, can generate perverse incentives. A rational, profit-maximizing company facing a low mandated price in a reference country might choose to delay or even forgo launching in that market altogether. The goal is to avoid “contaminating” the price potential in larger, more lucrative markets. This dynamic was a key driver of the “drug lag” and “drug loss” phenomena seen in Japan before recent pricing reforms, where innovative medicines reached Japanese patients years after their US and European launches, if at all. The unintended consequence of a policy designed to lower prices can be the complete denial of access for patients in certain regions.
The Value Gauntlet: Navigating Health Technology Assessment (HTA) Frameworks
In the modern pharmaceutical landscape, securing regulatory approval from bodies like the FDA or EMA is no longer the final hurdle to market access. A new, formidable challenge has emerged: the Health Technology Assessment (HTA). After a drug has proven its safety, efficacy, and quality—the first three hurdles—it must now clear a fourth: demonstrating its value and cost-effectiveness to the payers who will ultimately foot the bill.7 Navigating this “value gauntlet” is now one of the most critical competencies for any successful market access team.
The Rise of the Fourth Hurdle: What is HTA?
Health Technology Assessment is the systematic evaluation of the properties, effects, and broader impacts of a health technology, which includes new medicines. Its primary purpose is to inform policy decisions about pricing and reimbursement, ensuring that limited healthcare resources are allocated to interventions that are not only clinically effective but also represent good value for money. HTA bodies conduct a multi-dimensional review, considering:
Clinical Evidence: The drug’s efficacy and safety compared to the current standard of care.
Economic Evidence: The drug’s cost-effectiveness, or the additional cost required to achieve an additional unit of health benefit.
Social and Ethical Implications: The drug’s impact on health equity, patient quality of life, and societal values.
While the United States has a fragmented system, HTA is a mandatory and institutionalized part of the market access process across Europe, Canada, Australia, and many other parts of the world.9 Its influence is undeniable and growing, shaping which drugs get funded and at what price.
The QALY: The World’s Most Influential—and Controversial—Health Metric
At the heart of many HTA evaluations, particularly in Europe, lies a single, powerful metric: the Quality-Adjusted Life Year, or QALY. The QALY was developed as an attempt to create a common currency for health outcomes, combining both the quantity (length) and quality of life into a single index number.
Demystifying the QALY
The calculation is conceptually simple:
QALYs=Utility×YearsofLifeGained
Years of Life Gained: This is the additional survival time a patient receives from a new treatment compared to the old one.
Utility: This is a value assigned to a specific health state, ranging from 1.0 (perfect health) to 0.0 (death). A year lived in perfect health is worth 1 QALY. A year lived in a state with a utility value of 0.5 (e.g., being bedridden) is worth 0.5 QALYs. These utility values are typically derived from surveys of the general population or patients, using techniques like the “Standard Gamble” or “Time Trade-Off” to gauge how people value different health states.
Application in Cost-Effectiveness Analysis
The QALY allows HTA bodies to perform a Cost-Utility Analysis (CUA), a specific type of cost-effectiveness analysis. They calculate a metric known as the Incremental Cost-Effectiveness Ratio (ICER), which represents the additional cost to gain one additional QALY.
This resulting ICER (e.g., $50,000 per QALY gained) is then compared against a country’s implicit or explicit “willingness-to-pay” (WTP) threshold. In the UK, for example, the National Institute for Health and Care Excellence (NICE) generally considers an ICER below £20,000–£30,000 per QALY to be cost-effective and thus represent good value for the National Health Service (NHS).
The Great Debate: Criticisms and Controversies
Despite its widespread use, the QALY is one of the most fiercely debated concepts in health economics. The criticisms are significant and strike at the heart of how we define and value human life.
Inherent Discrimination: The most potent criticism is that the QALY framework is inherently discriminatory against the elderly and people with disabilities.12 A treatment that extends the life of an 80-year-old with multiple comorbidities will almost always generate fewer QALYs than one that extends the life of a 30-year-old. Similarly, a treatment for a person with a chronic disability may improve their quality of life, but their “utility” score will likely never reach 1.0, meaning the QALYs gained are systematically valued less. Critics argue this puts a lower monetary value on the lives of these populations, making it harder for drugs that treat them to be deemed “cost-effective.”
Lack of Transparency and Subjectivity: The utility values and WTP thresholds used by bodies like the Institute for Clinical and Economic Review (ICER) in the US are often criticized as being arbitrary and opaque. Who decides that one year of perfect health is worth $150,000, as ICER often suggests?. Why is the UK’s threshold £30,000? These figures are not derived from a transparent, universally accepted formula but are based on historical precedent and economic modeling that can be difficult for outsiders to replicate or challenge.
Legislative Pushback in the US: These concerns have been so significant in the United States that they have been written into law. Both the Affordable Care Act (ACA) of 2010 and the recent Inflation Reduction Act (IRA) of 2022 contain provisions that forbid or strongly discourage the use of QALYs and similar metrics in Medicare coverage and reimbursement decisions.14 This creates a major policy divergence, with the US government officially rejecting a metric that is the gold standard for value assessment in much of the rest of the world. In response to this criticism, some bodies like ICER have introduced alternative metrics like the Equal Value of Life Years Gained (evLYG), which measures only the extension of life without adjusting for quality, but this metric has its own limitations and is not endorsed by major disability rights groups.14
Spotlight on Key Value Assessors: A Global Tour
To succeed in the global market, you must understand the specific rules and methodologies of the key gatekeepers. While they share a common goal of assessing value, their approaches can differ significantly, requiring tailored evidence and engagement strategies.
The United Kingdom: NICE and the Pursuit of Cost-Effectiveness
The UK’s National Institute for Health and Care Excellence (NICE) is arguably the world’s most influential HTA body, a pioneer in the field since its establishment in 1999.
Role and Power: NICE’s primary function is to provide guidance to the NHS on whether new medicines are cost-effective. Its power is substantial: a positive recommendation from NICE creates a legal obligation for the NHS to make funding available for that treatment, typically within three months. This makes a NICE approval a critical gateway to one of the world’s largest healthcare markets.
Methodology: NICE is famous for its explicit use of the cost-per-QALY methodology. It rigorously scrutinizes a manufacturer’s clinical and economic data to determine if a new drug’s ICER falls within its established willingness-to-pay threshold of £20,000–£30,000 per QALY gained. While modifiers exist for certain circumstances (e.g., end-of-life care, highly severe conditions), this threshold remains the central benchmark for value.
The United States: ICER’s Growing (and Contentious) Influence
The US lacks a single, government-mandated HTA body like NICE. However, the Institute for Clinical and Economic Review (ICER) has emerged as a powerful and highly influential independent “watchdog”.
Role and Influence: ICER is a non-profit research organization that conducts its own value assessments of new drugs, often releasing its reports concurrently with a drug’s FDA approval. While ICER has no formal regulatory authority, its reports are heavily referenced by private payers and Pharmacy Benefit Managers (PBMs) during their own internal reviews and price negotiations.15 An unfavorable ICER report can create significant headwinds for a new drug, setting a low “value benchmark” that manufacturers are forced to negotiate against.
Methodology: ICER’s framework is a blend of clinical evidence review and cost-effectiveness analysis, heavily reliant on the QALY and the evLYG. Its reports conclude with a “health-benefit price benchmark,” which is the price range ICER believes would be fair based on the evidence. This benchmark is often significantly lower than the manufacturer’s list price, sparking intense debate and controversy, particularly from patient groups who are concerned about the discriminatory nature of the QALY metric.14
Germany: The AMNOG Process and Benefit Assessment
Germany’s system, established by the Pharmaceuticals Market Reorganisation Act (AMNOG) in 2011, offers a unique model that balances free-market principles with stringent government oversight.20
The Process: Upon launch, a manufacturer is free to set the initial price for a new drug, and this price is reimbursed by the statutory health insurance funds for the first six months.22 However, this freedom is temporary. Simultaneously, the manufacturer must submit a comprehensive dossier to the Federal Joint Committee (G-BA), the highest decision-making body in the German healthcare system. The G-BA, often with the help of the Institute for Quality and Efficiency in Health Care (IQWiG), conducts a formal “benefit assessment,” comparing the new drug to an appropriate standard of care.20
The Outcome: The G-BA assigns a rating based on the level of “added medical benefit” demonstrated (e.g., major, considerable, minor, or no added benefit). This rating becomes the basis for price negotiations between the manufacturer and the National Association of Statutory Health Insurance Funds (GKV-SV). If a drug is found to have “no added benefit,” it is typically placed in a reference price group, meaning its price is effectively tethered to that of older, often generic, comparators. The negotiated price is then applied retroactively from the seventh month after launch, meaning the manufacturer may have to pay back significant sums to the insurance funds. This system directly links negotiating power and final price to the strength of the clinical evidence.
France: The Dual Assessment of HAS (TC and CEESP)
The French system involves a two-stage evaluation process conducted by different commissions within the French National Authority for Health (Haute Autorité de Santé, or HAS).
Clinical Benefit (TC): The Transparency Commission (Commission de la Transparence, or TC) first conducts a clinical assessment. It determines the drug’s Service Médical Rendu (SMR), or actual clinical benefit, which influences the reimbursement rate (e.g., 100%, 65%, 30%). It also assesses the Amélioration du Service Médical Rendu (ASMR), or improvement in clinical benefit compared to existing therapies, on a scale of I (major improvement) to V (no improvement). The ASMR rating is a key driver in price negotiations.
Economic Evaluation (CEESP): For drugs that claim a high level of innovation (ASMR I-III) and are expected to have a significant budget impact, a second evaluation is required by the Economic and Public Health Assessment Committee (Commission d’Évaluation Économique et de Santé Publique, or CEESP).25 The CEESP reviews the manufacturer’s cost-effectiveness and budget impact analyses.
Price Negotiation (CEPS): The final price is then negotiated with the Economic Committee for Health Products (Comité Économique des Produits de Santé, or CEPS), which takes into account the ASMR rating from the TC, the economic opinion from the CEESP, and forecasted sales volumes.24
The Strategic Gauntlet: A Step-by-Step Framework for Optimal Launch Pricing
Having established the foundational models and the complex landscape of value assessment, we can now synthesize these elements into a practical, phased framework. Determining the optimal launch price is not a single event but a multi-year strategic process that begins long before a drug is submitted for regulatory approval. It requires a disciplined, cross-functional effort that integrates clinical development, competitive intelligence, health economics, and commercial strategy. This is the strategic gauntlet every new medicine must run.
The groundwork for a successful launch price is laid years in advance, during the mid-to-late stages of clinical development. This is the intelligence-gathering phase, where the goal is to build a comprehensive, 360-degree view of the market you are about to enter.
Mastering Competitive Intelligence (CI)
Competitive Intelligence is the systematic and ethical collection, analysis, and dissemination of actionable intelligence about your competitors, the market environment, and regulatory shifts.28 This is not merely about tracking competitor press releases. True, high-value CI goes much deeper, seeking to understand the
why behind a competitor’s actions—their strategic objectives, their assumptions about the market, and their capabilities.
A robust CI program involves several layers of analysis:
Market Intelligence: Understanding broad trends, patient demographics, shifts in clinical guidelines, and identifying unmet medical needs that your product can address.
Pipeline Intelligence: Meticulously tracking the clinical trial progress of all potential competitors. This includes monitoring trial databases like ClinicalTrials.gov, analyzing R&D investments, and assessing the probability of regulatory approval for rival assets. Knowing if a competitor’s Phase III trial is delayed can create a critical window of opportunity to accelerate your own timeline.
Regulatory & Policy Intelligence: Staying ahead of changes in pricing and reimbursement policies, new market access barriers, and the evolving evidence requirements of HTA bodies.
This deep intelligence allows you to anticipate competitor strategies, identify market opportunities, and begin shaping your product’s value proposition long before launch.
Unlocking Patent Data for Strategic Advantage
In the pharmaceutical industry, a patent is far more than a legal document; it is a strategic asset. A company’s patent portfolio is a map of its innovation, a declaration of its strategic intent, and a timer counting down to market disruption. Analyzing this landscape is a cornerstone of pre-launch strategy.
Freedom-to-Operate (FTO) Analysis: This is the foundational step. An FTO analysis is a comprehensive review to ensure that your product, its manufacturing process, and its intended use do not infringe upon any existing, valid patents held by others. Failing to conduct a thorough FTO can lead to costly litigation and potentially an injunction that blocks your launch.
Lifecycle Management and Patent Thickets: It is crucial to analyze not just a competitor’s core composition-of-matter patent (which protects the molecule itself), but also their secondary patents. Brand companies often build a dense web of overlapping patents covering new formulations, delivery methods, or methods of use. This strategy, known as creating a “patent thicket,” is designed to extend market exclusivity and delay the entry of generic or biosimilar competition long after the original patent expires.1 Understanding the strength and density of a competitor’s patent thicket is essential for accurately forecasting their revenue tail and the timing of future competition.
The structure of a company’s patent portfolio serves as a powerful leading indicator of its pricing power. A strong, early composition-of-matter patent with many years of remaining life signals a long period of monopoly pricing, allowing the company to set a premium price with confidence. Conversely, a portfolio that relies heavily on a thicket of weaker, later-filed secondary patents suggests a more vulnerable position. It may indicate that the core intellectual property is nearing expiration, and while the company might price aggressively to maximize revenue in the short term, payers will know that the monopoly is fragile and will have greater leverage in negotiations.
Navigating this complex patent data manually is a monumental task. This is where specialized competitive intelligence platforms become indispensable. Services like DrugPatentWatch provide curated, comprehensive databases that automate the tracking of patent expirations, regulatory exclusivities, and the real-time status of patent litigation. These tools transform patent analysis from a reactive, laborious legal check into a proactive, strategic forecasting function, enabling companies to map the competitive landscape and identify opportunities with remarkable precision.31
Phase 2: Value Demonstration & Evidence Generation (Years -3 to -1)
With a clear understanding of the competitive and IP landscape, the focus shifts inward to building the evidence base that will support your desired price. The value of your drug is not self-evident; it must be rigorously demonstrated with compelling data.
Building the Global Value Dossier (GVD)
The GVD is the master document, the central repository of all the evidence and arguments that will be used to communicate your drug’s value to payers, HTA bodies, and other stakeholders around the world. It is a living document that evolves throughout the development process, but its core components include:
Burden of Illness and Unmet Need: A clear articulation of the disease’s impact on patients, caregivers, and the healthcare system, highlighting the shortcomings of the current standard of care.
Clinical Evidence Package: All data from Phase I, II, and III clinical trials, focusing on efficacy, safety, and tolerability.
Economic Value Proposition: Health economic models demonstrating the drug’s cost-effectiveness and potential budget impact.
Patient-Reported Outcomes (PROs): Data that captures the drug’s impact on patients’ quality of life, symptoms, and functional status directly from the patient’s perspective.
Designing Clinical Trials with Market Access in Mind
One of the most common—and costly—mistakes in drug development is designing pivotal clinical trials without considering the needs of payers. A trial that satisfies regulators may be wholly inadequate for HTA bodies. To avoid this, market access considerations must be integrated into trial design from the earliest stages. This means:
Selecting the Right Comparator: Trials should compare the new drug not just against a placebo, but against the active comparator that is considered the real-world standard of care by payers and clinicians. The G-BA in Germany, for example, explicitly defines the “appropriate comparative therapy” against which a new drug will be judged.
Incorporating Economic Endpoints: The trial protocol should include the collection of health resource utilization data (e.g., hospital days, physician visits, concomitant medications). This data is essential for building the cost-effectiveness models required by HTA bodies.
Prioritizing Patient-Reported Outcomes: PRO instruments should be included to capture the drug’s impact on quality of life, a key component of the QALY calculation.11
The Power of Real-World Evidence (RWE)
Clinical trials, by their nature, are conducted in idealized conditions with highly selected patient populations. Payers are increasingly demanding to see how a drug performs in the messy, complex reality of everyday clinical practice. Real-World Evidence, derived from sources like electronic health records, insurance claims databases, and patient registries, can supplement trial data and strengthen the value proposition. RWE can be used to demonstrate a drug’s effectiveness in a broader and more diverse patient population, confirm its long-term safety profile, and validate the economic benefits predicted by models.
As the launch approaches and the clinical data matures, the process moves into a phase of intensive financial modeling and simulation. This is where the strategic intelligence and clinical evidence are translated into quantifiable financial projections to identify an optimal price corridor.
Forecasting Revenue and Costs
The foundation of any pricing model is a robust forecast. This involves several layers of analysis:
Epidemiology-Based Forecasting: The process starts by estimating the total addressable patient population, often broken down by country, disease severity, and line of therapy.
Market Penetration and Share: Based on the drug’s clinical profile and the competitive landscape, analysts project the peak market share the drug is likely to capture and the speed of uptake (the “launch curve”).
Cost Projections: This includes not only the direct manufacturing costs (Cost of Goods Sold – COGS) but also the significant ongoing investments in sales and marketing (SG&A) required to support the launch, as well as an allocation of the initial R&D investment.35
Core Valuation Methodologies: DCF and rNPV
To assess the financial viability of different pricing strategies, companies use sophisticated valuation methodologies.
Discounted Cash Flow (DCF): This is a standard financial technique that calculates the present value of an asset by projecting its future cash flows and “discounting” them back to today’s dollars to account for the time value of money and risk.37
Risk-Adjusted Net Present Value (rNPV): Because drug development is fraught with uncertainty, the standard DCF model is enhanced for the biopharma industry. The rNPV method is the gold standard for valuing pipeline assets.37 It adjusts the projected cash flows at each stage by the historical probability of success (POS) for advancing through that stage of development and ultimately gaining regulatory approval. This provides a more realistic, probability-weighted valuation that accounts for the high risk of failure inherent in the R&D process.
Scenario Planning and Price Corridor Analysis
A single price point is a target, but a successful strategy is built around a “price corridor”—a range of potential prices that are tested and validated. Financial models are used to run extensive sensitivity and scenario analyses.35 By creating best-case, base-case, and worst-case scenarios, companies can model the impact of different prices on key variables like:
Payer Restrictions: How does the price affect the likelihood of payers imposing restrictive prior authorizations or step-therapy requirements?
Physician Prescribing: At what price point do physicians become hesitant to prescribe the drug due to patient out-of-pocket costs or administrative hurdles?
Revenue and Profitability: How do different price points and the resulting market access scenarios impact the asset’s overall rNPV?
This analysis, which can involve in-depth interviews with payers and quantitative surveys with physicians, allows the company to identify the optimal price corridor that balances revenue maximization with broad patient access.
Phase 4: Stakeholder Engagement & Final Price Determination (Launch)
In the final months leading up to launch, the focus shifts to direct engagement with the key stakeholders who will ultimately determine the drug’s success in the market. The theoretical price corridor developed through modeling must now be tested against the realities of negotiation.
Engaging with Payers and PBMs
In the US, Pharmacy Benefit Managers (PBMs) are arguably the most powerful arbiters of market access.41 These massive entities manage prescription drug benefits for tens of millions of Americans, and their decisions can make or break a new drug launch.
The Formulary Gate: PBMs create formularies, which are tiered lists of covered drugs. A drug’s placement on a favorable tier (with low patient co-pays) versus an unfavorable tier (with high co-pays and restrictions) is a direct result of the net price the manufacturer offers through rebates.
The Gross-to-Net Bubble: The negotiation between manufacturers and PBMs is the primary driver of the “gross-to-net bubble” in the US—the large and often opaque gap between a drug’s publicly listed Wholesale Acquisition Cost (WAC) and the actual net price received by the manufacturer after all rebates and discounts are paid.
Early Engagement: It is critical to engage in pre-launch discussions with major national and regional payers and PBMs. These conversations provide invaluable insights into their evidence requirements, budget impact concerns, and their perception of the drug’s value relative to competitors. This feedback is the final, crucial input before setting the launch WAC.
The Growing Influence of Patient Advocacy
Patient advocacy groups have evolved from grassroots support networks into sophisticated and powerful stakeholders in the healthcare ecosystem. Their influence is felt across the entire drug lifecycle, from funding early research to lobbying regulators and payers.
Shaping Regulatory Decisions: The intense advocacy from the Alzheimer’s community played a significant, albeit controversial, role in the FDA’s decision to approve Aduhelm, even against the recommendation of its own advisory panel.45
Driving Reimbursement Negotiations: In the UK, the concerted efforts of groups like SMA UK were instrumental in securing NHS access for the high-cost gene therapy Zolgensma.47 Similarly, in Canada, Cystic Fibrosis Canada has been a relentless force in the fight for broad public funding of the transformative drug Trikafta.
Strategic Partnership: Engaging with these groups early and authentically is no longer optional. They can be powerful allies in communicating the burden of disease and the value of a new therapy to payers and policymakers. Their testimony can provide the qualitative, human context that is often missing from clinical trial data and economic models, adding a powerful dimension to the value story.
The Global Maze: Navigating International Pricing and Reimbursement Systems
A successful launch strategy cannot be confined to a single market. The interconnected nature of the global pharmaceutical landscape, driven by factors like International Reference Pricing and the global operations of major companies, demands a cohesive and carefully sequenced international strategy. The “optimal price” for a new medicine is not a single number but a complex matrix of prices, tailored to the unique rules, regulations, and values of each major market. Let’s compare the distinct environments of the United States, Europe, and Japan.
The United States: A Market-Driven, Payer-Dominated Landscape
The U.S. market is unique in its scale, complexity, and its reliance on private-sector negotiations to determine price and access.
System Overview: It is a fragmented, multi-payer system where, historically, the government has been explicitly forbidden from directly negotiating the launch prices of most drugs.1 Manufacturers have the freedom to set their initial list price, known as the Wholesale Acquisition Cost (WAC). However, this freedom is heavily constrained by the immense negotiating power of private insurance companies and their agents, the PBMs.1
The PBM Factor: PBMs are the central gatekeepers of access. They manage formularies for health plans covering hundreds of millions of Americans. Their primary leverage is the ability to place a drug on a preferred formulary tier with low patient cost-sharing, or to relegate it to a non-preferred tier with high costs and restrictive access controls like prior authorization.43 In exchange for preferred status, manufacturers pay substantial rebates, creating the significant “gross-to-net” spread that characterizes the US market. The final net price is a closely guarded secret, the result of intense, bilateral negotiations.
The IRA Revolution: The landscape is now undergoing its most significant change in decades with the implementation of the Inflation Reduction Act (IRA) of 2022. This landmark legislation introduces two powerful new mechanisms for government price control within the massive Medicare program 50:
Medicare Price Negotiation: For the first time, the federal government is empowered to directly negotiate a “Maximum Fair Price” (MFP) for a select number of high-spend, single-source drugs covered by Medicare. The program began with 10 Part D drugs for 2026 and will expand to include more Part D and Part B drugs in subsequent years.
Inflation Rebates: Starting in 2023, manufacturers are required to pay rebates back to Medicare if they increase the price of their drugs faster than the rate of inflation.
These provisions represent a fundamental shift in the US market, introducing direct government price setting into the world’s largest pharmaceutical market and creating new strategic challenges for launch pricing and lifecycle management.
Europe: A Mosaic of HTA-Led, Government-Controlled Systems
In stark contrast to the US, European healthcare systems are predominantly single-payer (like the UK’s NHS) or social insurance-based (like Germany and France). While each country has its own specific process, they share common themes of centralized control, mandatory HTA, and direct government involvement in price setting.9
United Kingdom: As discussed, the UK relies on NICE to conduct a formal cost-effectiveness analysis. The price must be low enough to meet the cost-per-QALY threshold to secure a positive recommendation and, consequently, mandatory funding from the NHS.13
Germany: The AMNOG process allows a free launch price for six months, followed by a negotiated price based on the G-BA’s formal assessment of “added benefit” compared to a standard therapy. No added benefit means no price premium.20
France: The French system uses a dual HTA assessment by the HAS to determine both the clinical benefit (which sets the reimbursement rate) and, for innovative drugs, the cost-effectiveness. These assessments then inform the final price negotiation with the CEPS.24
Japan: A Centralized System with Unique Pressures
Japan represents another distinct model, characterized by a universal health insurance system and direct, centralized price setting by the government.
System Overview: All drug prices are set by the Ministry of Health, Labour and Welfare (MHLW) and are listed on the National Health Insurance (NHI) price tariff. This price is applied universally across the country. A major strength of the Japanese system is that reimbursement and nationwide access typically follow very quickly after regulatory approval, often within a few months.5
The Challenge of Price Cuts: The defining feature and historical challenge of the Japanese market is its system of regular, mandatory price cuts. The government conducts market surveys and reduces the official NHI price to align with the actual, lower wholesale prices being transacted in the market. Furthermore, a “market expansion repricing” mechanism can trigger additional, steep price cuts for blockbuster drugs whose sales significantly exceed initial forecasts. This predictable downward pressure on prices historically created a “drug lag,” where companies delayed or avoided launching innovative drugs in Japan to protect their global price structure. In recent years, the MHLW has introduced reforms, such as the Price Maintenance Premium (PMP), to better reward true innovation and mitigate this disincentive.
Table 1: Comparison of Key Global Pricing & Reimbursement Systems
The following table provides a high-level summary of the key differences between these major global markets, highlighting the distinct strategic challenges each presents.
Feature
United States
United Kingdom
Germany
France
Japan
Key Decision-Making Body
Private Payers / PBMs; CMS (for Medicare)
NICE (HTA); NHS England (Payer)
G-BA (HTA); GKV-SV (Payer)
HAS (TC/CEESP for HTA); CEPS (Payer)
MHLW (Payer & Price Setter)
Primary Pricing Mechanism
WAC list price followed by negotiated rebates
Value-Based (Cost-per-QALY threshold)
Benefit Assessment vs. Comparator
Clinical Benefit (ASMR) + Economic Evaluation
Centralized Price Setting (Referenced)
Time to Access Post-Approval
Immediate (but access level varies by plan)
~3 months post-NICE recommendation
Immediate (price adjusts retroactively at 6 months)
~12.9 months (average)
~6 months (average)
Key Strategic Challenge
Securing favorable formulary placement from powerful PBMs; Navigating IRA negotiations
Meeting the stringent £20k-£30k per QALY threshold
Demonstrating “added medical benefit” to avoid reference pricing
Navigating dual clinical and economic HTA reviews
Managing frequent, mandatory price cuts and market repricing
This comparative overview makes it clear that a “one-size-fits-all” global pricing strategy is doomed to fail. Each market operates under a unique set of rules, values, and pressures. A successful global launch requires a deeply nuanced strategy, often involving a carefully planned launch sequence to manage the domino effect of international reference pricing, and bespoke value dossiers tailored to the specific evidence requirements of each country’s HTA body.
Case Studies in Action: Lessons from the Launch Frontlines
Theory and frameworks are essential, but the true test of any pricing strategy comes at the moment of launch. The history of the pharmaceutical industry is filled with stories of both brilliant successes and catastrophic failures, each offering invaluable lessons. By examining these real-world case studies, we can see the principles of pricing and market access in stark relief, learning from the triumphs and the missteps of those who have gone before.
The Blockbuster Cure: Sovaldi and the Price of a Revolution
In 2013, Gilead Sciences launched Sovaldi (sofosbuvir), a drug that effectively cured Hepatitis C, a chronic and often fatal liver disease. It was a monumental scientific achievement. It was also a lightning rod for controversy.
The Strategy and Justification: Gilead launched Sovaldi with a list price of $84,000 for a 12-week course of treatment, or $1,000 per pill.54 The company’s justification was firmly rooted in value-based pricing. They argued that the price, while high, was cost-effective when compared to the long-term costs of managing chronic Hepatitis C, which could include decades of monitoring, treatment for complications like cirrhosis, and, for many, the immense expense of a liver transplant. In essence, they were pricing a cure against the lifetime cost of the disease.
The Market Reaction: The reaction was immediate and explosive. Patient advocates, politicians, and payers were outraged by the “sticker shock”. While the cost-effectiveness argument was economically sound on a per-patient basis, the sheer number of people with Hepatitis C—an estimated 3 million in the US alone—created a budget impact crisis for payers. State Medicaid programs, which cover a large portion of the HCV population, were faced with the prospect of their entire pharmacy budgets being consumed by a single drug.
The Lesson: Sovaldi is the quintessential case study of the conflict between cost-effectiveness and budget impact. A drug can be a “good value” for an individual patient but still be unaffordable for the system as a whole when the eligible population is large. The backlash forced Gilead into significant discounting and highlighted a critical lesson for the industry: a value proposition must include not only a compelling clinical and economic argument but also a strategy to manage the affordability and budget impact for payers. It demonstrated that even a revolutionary cure can face severe access restrictions if the price is perceived as breaking the bank.
The Cautionary Tale: Aduhelm’s Controversial Launch and Commercial Failure
If Sovaldi was a story of a brilliant drug with a problematic price, Biogen’s Aduhelm for Alzheimer’s disease was the opposite: a story of a questionable drug with an impossible price.
The Strategy and Justification: Aduhelm was launched in 2021 with an annual price tag of $56,000, following a highly controversial accelerated approval by the FDA.56 The approval was granted despite conflicting clinical trial data and a near-unanimous vote against the drug by the FDA’s own independent advisory panel, three of whom resigned in protest.45 Biogen’s justification was based on the immense unmet need in Alzheimer’s and the drug’s ability to reduce amyloid plaques in the brain, a surrogate endpoint whose link to actual clinical benefit was—and remains—highly debated.
The Payer Response: The payer community’s response was swift and brutal. Citing the weak and contradictory evidence of clinical benefit, private insurers implemented strict access controls. The fatal blow, however, came from the Centers for Medicare & Medicaid Services (CMS). In an unprecedented move, CMS issued a National Coverage Determination that severely restricted Medicare coverage for Aduhelm only to patients enrolled in a qualifying clinical trial.57 This effectively cut off access for the vast majority of the Alzheimer’s patient population.
The Lesson: Aduhelm is a masterclass in the consequences of a failed value proposition. It proves that in today’s evidence-driven environment, regulatory approval is not enough. Without a clear and convincing demonstration of clinical benefit that is accepted by both clinicians and payers, even a drug for a devastating disease with no other options will fail to gain market access. The high price, combined with the weak data, created a value proposition that payers could not and would not accept. The drug was a commercial catastrophe, with Biogen ultimately pulling it from the market, and it stands as a stark warning that price must be anchored to proven value.
The Gene Therapy Frontier: Zolgensma, Hemgenix, and Multi-Million Dollar Prices
The emergence of one-time, potentially curative gene therapies has pushed the boundaries of pharmaceutical pricing, forcing the entire healthcare system to grapple with how to pay for transformative value delivered in a single dose.
The Strategy and Justification: Novartis launched Zolgensma for spinal muscular atrophy (SMA) in 2019 at $2.125 million, making it the most expensive drug in the world at the time.61 In 2022, CSL Behring surpassed this with Hemgenix for hemophilia B, priced at $3.5 million.64 The justification for these seemingly astronomical prices is the ultimate expression of value-based pricing. The argument is that a one-time cure provides a lifetime of value, offsetting decades of incredibly expensive chronic care. For hemophilia, this means avoiding lifelong, regular infusions of clotting factor, which can cost hundreds of thousands of dollars per year.
The Payer Response and Innovative Models: While the prices are staggering, the value argument has been compelling enough to gain coverage, albeit with challenges. The key has been the development of innovative payment models to manage the extreme upfront budget impact. Manufacturers have partnered with payers to offer:
Pay-Over-Time Models: Spreading the cost over several years, akin to an annuity, to make the initial budget hit manageable.
Outcomes-Based Agreements: Linking payment to the drug’s continued performance. If the treatment fails to work as promised after a certain period, the manufacturer provides a partial or full rebate.62
The Lesson: The gene therapy launches demonstrate that the market can accommodate extremely high prices if they are backed by transformative, curative value. However, they also prove that the traditional “pay-at-the-time-of-dispensing” model is inadequate for these therapies. Success in this new frontier requires not just a strong value story but also a willingness to partner with payers on flexible, innovative contracting solutions that share risk and manage budget shocks. These cases also highlight the growing role of value assessors like ICER, which conducted analyses on both Zolgensma and Hemgenix, providing influential benchmarks on what a “fair” price for a cure might be, even if their final figures differed from the launch prices.61
The Shifting Tides: Policy, Technology, and the Future of Drug Pricing
The pharmaceutical pricing landscape is not static. It is a dynamic environment, constantly being reshaped by new legislation, disruptive technologies, and scientific advancements that challenge our traditional models of value and payment. To develop a durable pricing strategy, we must not only master the present but also anticipate the future. Three major forces are currently redefining the rules of the game: the long-term impact of the Inflation Reduction Act, the rise of Artificial Intelligence, and the unique challenges posed by personalized and curative medicines.
The Long Shadow of the IRA: A New Paradigm for the US Market
The Inflation Reduction Act of 2022 represents the most significant pharmaceutical policy shift in the United States since the creation of Medicare Part D. Its provisions on price negotiation and inflation rebates will have profound and lasting effects on R&D investment, launch strategies, and lifecycle management.50
Long-Term Impact on R&D Incentives: One of the most debated aspects of the IRA is its differential treatment of small-molecule drugs versus large-molecule biologics. Small-molecule drugs are eligible for price negotiation just 9 years after their initial approval, while biologics are granted a 13-year exemption period. This four-year difference in protected market life creates a powerful financial incentive for companies and investors to shift R&D resources away from small-molecule development and toward biologics, which will have a longer runway to generate returns before facing government price controls. This could have significant consequences for therapeutic areas like oncology and neurology, where small-molecule drugs have historically been a major source of innovation.
Strategic Response in Pricing: The IRA will likely force a change in launch pricing philosophy. With a finite, predictable window before potential price negotiations, companies may be incentivized to launch their drugs at higher initial prices to maximize revenue during the protected period. The traditional strategy of launching at a moderate price and taking annual price increases is now penalized by the inflation rebate provision, further pushing the focus toward maximizing revenue at launch.
A critical, and perhaps unintended, consequence of the IRA’s structure is its potential to disincentivize post-launch research and development. Historically, many blockbuster drugs have achieved their status through lifecycle management—launching in an initial, often smaller indication and then investing heavily in further clinical trials to expand their use into new diseases or larger patient populations. Keytruda is a prime example of this successful strategy.70 Under the IRA, a drug becomes eligible for negotiation based on its total Medicare spending, regardless of the number of indications. Once a drug is selected for negotiation, the “Maximum Fair Price” applies to all of its approved uses. This creates a scenario where the potential return on investment for developing a new indication is significantly diminished if the drug is already subject to, or close to becoming subject to, price negotiation. A rational portfolio manager might conclude that it is more financially prudent to allocate R&D funds to a new, early-stage asset with a full 9 or 13 years of market life ahead of it, rather than investing in expanding the label of a drug whose price is about to be capped. This could stifle the very kind of follow-on innovation that has historically maximized the therapeutic value of many important medicines.
The Rise of Artificial Intelligence (AI) in Pricing and Market Access
Artificial Intelligence and machine learning are no longer futuristic concepts; they are rapidly becoming powerful tools in the pharmaceutical commercialization toolkit. AI’s ability to analyze vast, complex datasets at superhuman speed offers the potential to bring a new level of precision and predictive power to pricing and market access strategies.72
Predictive Analytics for HTA and Market Access: AI algorithms can be trained on historical HTA submission data, clinical trial results, and payer decisions to predict the likely outcomes of future value assessments with remarkable accuracy. Platforms are emerging that can forecast payer-relevant endpoints, anticipate the questions HTA committees will ask, and model the probability of a positive or negative recommendation.72 This allows companies to stress-test their evidence packages, identify potential weaknesses, and refine their submission strategies long before they are formally reviewed. Some analyses have found that companies leveraging AI for market access strategies have seen significant increases in market share compared to those using traditional methods.
Dynamic Pricing Optimization: Traditional pricing models are often static, based on data available at the time of launch. AI enables a more dynamic approach. Machine learning models can process real-time data feeds on market trends, competitor pricing moves, sales data, and even patient outcomes from RWE to continuously model and recommend optimal pricing adjustments.72 This allows for a more agile strategy that can adapt to a constantly changing market environment.
The Human Element: It is crucial, however, to recognize the limitations of AI. These models are only as good as the data they are trained on, and incomplete or biased data can lead to flawed outputs. Furthermore, AI cannot replicate the strategic judgment, ethical considerations, and nuanced negotiation skills of human experts. The optimal approach is not to replace human decision-makers but to augment them, using AI as a powerful analytical engine to provide deeper insights and more accurate forecasts, which then inform human-led strategic decisions.
New Frontiers: Pricing Personalized Medicine and Curative Therapies
Scientific advancements are creating new categories of medicine that challenge our traditional pricing and payment paradigms. Personalized medicines and one-time curative therapies require us to rethink how we define and pay for value.
Pricing Personalized Medicine: Personalized or precision medicine involves tailoring treatment to individual patients based on their unique genetic or biomarker profile.76 This often means a drug is highly effective, but only for a very small, well-defined sub-population. Pricing these therapies presents a challenge. The R&D costs may be just as high as for a traditional drug, but the potential patient pool is much smaller. This necessitates a move toward pricing models that can capture the extremely high value delivered to each individual patient, justifying a high per-patient price to ensure a viable return on investment.78
Innovative Payment Models for Curative Therapies: As we saw with the gene therapy case studies, the high upfront cost of potentially curative treatments is a major shock to healthcare budgets. This has spurred the development and adoption of a new suite of innovative payment models designed to align payment with long-term value and manage financial risk 1:
Outcomes-Based / Risk-Sharing Agreements: Payment is directly linked to the achievement of pre-defined clinical outcomes. If the patient does not respond as expected, the manufacturer provides a rebate.
Annuity / Milestone-Based Payments: The cost of the therapy is spread out over a number of years, with payments contingent on the patient remaining healthy or meeting certain clinical milestones. This turns a one-time capital expense into a more manageable operational expense for payers.67
Subscription Models (The “Netflix Model”): A payer (often a state government or national health system) pays a manufacturer a single, lump-sum fee for unlimited access to a drug for their entire eligible population for a set period. This model, which has been tested for Hepatitis C drugs, provides budget certainty for the payer and predictable revenue for the manufacturer.
These new models represent a fundamental shift from paying for pills to paying for outcomes. As more curative and personalized therapies come to market, their adoption will become increasingly central to ensuring sustainable patient access to the next generation of medical breakthroughs.
Conclusion: Mastering the Pricing Paradigm for Competitive Advantage
We have traversed the intricate and dynamic world of pharmaceutical launch pricing, moving from the foundational principles of value and cost to the complex realities of global HTA bodies, the strategic imperatives of competitive intelligence, and the disruptive forces shaping the future of the industry. The journey reveals a clear and powerful truth: determining the optimal price for a new medicine is the ultimate strategic exercise.
It is a discipline that demands a synthesis of art and science. It requires the scientific rigor of clinical evidence and health economic modeling, the analytical precision of financial forecasting and patent analysis, and the artful negotiation and communication needed to build a compelling value narrative for a diverse array of stakeholders. The process is not linear but iterative, a continuous cycle of intelligence gathering, evidence generation, modeling, and engagement that spans years.
The optimal price is not a single, static number discovered in a spreadsheet. It is a strategic position—a price corridor that is clinically justified, economically defensible, competitively differentiated, and sustainable across a complex global landscape. It is the outcome of a process that successfully balances the profound need to reward game-changing innovation with the equally profound need to ensure that those innovations can reach the patients who are waiting for them.
In the high-stakes, high-risk world of pharmaceutical development, where billions of dollars and countless lives hang in the balance, the ability to master this pricing paradigm is not just a commercial function. It is the ultimate competitive advantage. Those who can navigate this complex gauntlet with foresight, discipline, and strategic acumen will not only achieve commercial success; they will define the future of medicine.
Key Takeaways
Value is the Core, but Its Definition is Contested: Value-Based Pricing (VBP) is the dominant paradigm, but “value” is defined differently by manufacturers (long-term societal benefit, innovation) and payers (short-term budget impact, direct cost-offsets). The final price is the result of a negotiation over this definition.
HTA is the Global Gatekeeper: Success requires a deep understanding of the methodologies of key HTA bodies like NICE (UK), G-BA (Germany), and the influential US watchdog ICER. Evidence generation and clinical trial design must be planned with their specific requirements in mind from the earliest stages.
Intelligence is a Strategic Weapon, Not a Checklist: Competitive Intelligence (CI) and patent analysis are not passive data-gathering exercises. Platforms like DrugPatentWatch can transform patent data into a predictive tool, revealing competitor strategies and forecasting a drug’s true period of market exclusivity, which is a key driver of pricing power.
Financial Modeling Defines the “Price Corridor”: Sophisticated financial modeling, particularly risk-adjusted Net Present Value (rNPV), is essential for translating clinical and market data into financial projections. This allows for scenario planning that identifies an optimal “price corridor” that balances revenue, market share, and patient access.
The US Market is Undergoing a Tectonic Shift: The Inflation Reduction Act (IRA) fundamentally changes the rules in the world’s largest market. Its price negotiation and inflation rebate provisions will alter R&D incentives, launch strategies, and lifecycle management for years to come.
Global Strategy is Non-Negotiable: Due to International Reference Pricing (IRP), a price set in one country has a direct domino effect on others. A cohesive, carefully sequenced global launch strategy is essential to avoid setting a low price anchor that erodes worldwide revenue potential.
The Future is Flexible and Data-Driven: The rise of multi-million dollar curative therapies and personalized medicines is forcing the adoption of innovative payment models (e.g., outcomes-based agreements, pay-over-time). Simultaneously, Artificial Intelligence (AI) is providing powerful new tools for predictive analytics and dynamic price optimization.
Frequently Asked Questions (FAQ)
1. How early in the drug development process should a company start thinking about pricing?
Pricing strategy should be a consideration from as early as the pre-clinical or Phase I stage. While a final price cannot be set, early-stage “price potential” assessments are critical for making informed R&D and portfolio decisions. This involves developing an initial Target Product Profile (TPP), conducting preliminary landscape analysis to understand the unmet need and potential competitive environment, and building early economic models. Integrating market access and payer perspectives at this stage ensures that clinical trial programs (Phase II/III) are designed to generate the evidence needed to support the desired value proposition and price at launch. Waiting until Phase III is complete is far too late; by then, critical decisions about trial comparators and endpoints have already been made, potentially limiting the strength of the value story you can tell.
2. What is the single biggest mistake companies make when setting a launch price?
The most common and damaging mistake is a failure to align the price with a robust and clearly communicated value proposition. This was the fatal flaw of Aduhelm. A high price without compelling evidence of clinical benefit that is accepted by both clinicians and payers will be rejected by the market, regardless of regulatory approval or unmet need. This misalignment can manifest in several ways: weak or contradictory clinical data, choosing the wrong comparator in pivotal trials, failing to collect relevant patient-reported outcomes, or underestimating the payer’s focus on budget impact over theoretical cost-effectiveness. The optimal price is not simply what a company thinks its drug is worth; it’s what the company can prove it is worth to the stakeholders who control access.
3. How does the pricing strategy differ for a first-in-class drug versus a “me-too” drug in a crowded market?
The strategies are fundamentally different. For a first-in-class drug addressing a high unmet need, the strategy is centered on pure Value-Based Pricing. The goal is to quantify the significant clinical and economic value of introducing a new mechanism of action and establish a high price benchmark that reflects this innovation. The focus is on educating the market about the disease and the new treatment’s transformative potential. For a “me-too” drug, the strategy is dominated by Competitor-Based Pricing. The price is inherently anchored to the existing treatments. The company must decide whether to price at a premium (justified by a small, demonstrable advantage in safety, efficacy, or convenience), at parity (to be seen as a viable alternative), or at a discount (an aggressive penetration strategy to rapidly gain market share). The value story is not about transformation but about incremental benefit or cost savings.
4. With the rise of the IRA in the US, is International Reference Pricing (IRP) still a major concern for global launch sequencing?
Yes, IRP remains a critical concern, and the IRA may even heighten its importance. While the IRA introduces price controls within Medicare, the initial launch price in the US will still be set by the manufacturer and will be a key input for IRP baskets used by other countries. A company might be tempted to set an even higher US launch price to maximize revenue before the 9- or 13-year negotiation clock runs out. However, that higher US price could be referenced by other countries, potentially creating a higher price ceiling for them. Conversely, if a company launches first in a country with strict price controls (e.g., in Europe) and accepts a low price, that price will still be referenced, potentially anchoring the US price lower during future negotiations. The IRA adds another complex layer to the global chess match, making a carefully planned and modeled launch sequence more critical than ever.
5. How are innovative payment models like outcomes-based agreements actually implemented, and are they truly viable?
Implementing outcomes-based agreements is complex but increasingly viable, especially for high-cost therapies like gene therapies. The process involves several key steps: 1) Defining the Outcome: The manufacturer and payer must agree on a clear, measurable, and clinically meaningful outcome (e.g., remaining hospitalization-free for two years, achieving a certain level of motor function). 2) Data Collection: A robust system must be in place to track these outcomes for each patient over time, often relying on electronic health records, claims data, or patient registries. This data infrastructure can be a major hurdle. 3) Contracting: A legal contract is established that specifies the payment terms, the outcome metric, the measurement period, and the rebate mechanism if the outcome is not achieved. While operationally challenging, these models are gaining traction because they offer a solution to the core problem of uncertainty and affordability for transformative but expensive drugs. They allow payers to manage risk by ensuring they only pay for value that is actually delivered, while allowing manufacturers to secure reimbursement for their innovations based on real-world performance.62
Analysis of health economics assessment reports for pharmaceuticals in France – understanding the underlying philosophy of CEESP assessment – PMC, accessed August 9, 2025, https://pmc.ncbi.nlm.nih.gov/articles/PMC5533125/
Aduhelm: Biogen abandons Alzheimer’s drug after controversial approval left it unfunded by Medicare | The BMJ, accessed August 9, 2025, https://www.bmj.com/content/384/bmj.q281
Full article: Artificial intelligence in key pricing, reimbursement, and market access (PRMA) processes: better, faster, cheaper—can you really pick two? – Taylor & Francis Online, accessed August 9, 2025, https://www.tandfonline.com/doi/full/10.1080/13696998.2025.2488154
Value-Based Pricing and Reimbursement in Personalised Healthcare: Introduction to the Basic Health Economics – PMC – PubMed Central, accessed August 9, 2025, https://pmc.ncbi.nlm.nih.gov/articles/PMC5618156/
Financing and Reimbursement Models for Personalised Medicine: A Systematic Review to Identify Current Models and Future Options – PMC – PubMed Central, accessed August 9, 2025, https://pmc.ncbi.nlm.nih.gov/articles/PMC9206925/
Launch and Post-Launch Prices of Injectable Cancer Drugs in the US: Clinical Benefit, Innovation, Epidemiology, and Competition, accessed August 9, 2025, https://pmc.ncbi.nlm.nih.gov/articles/PMC10791980/
Real-world outcomes and direct care cost before and after elexacaftor/tezacaftor/ivacaftor initiation in commercially insured members with cystic fibrosis | Journal of Managed Care & Specialty Pharmacy, accessed August 9, 2025, https://www.jmcp.org/doi/10.18553/jmcp.2023.29.6.599
Leqembi Likely to Face 15% Price Cut Under Special CEA Rule – PHARMA JAPAN, accessed August 9, 2025, https://pj.jiho.jp/article/253368
Early Alzheimer’s Patients Continue to Benefit from Four Years of LEQEMBI® (lecanemab-irmb) Therapy New Clinical Data Presented at AAIC | News Release:2025 – Eisai, accessed August 9, 2025, https://www.eisai.com/news/2025/news202554.html
Financial interests of patient organisations contributing to technology assessment at England’s National Institute for Health and Care Excellence: policy review | The BMJ, accessed August 9, 2025, https://www.bmj.com/content/364/bmj.k5300