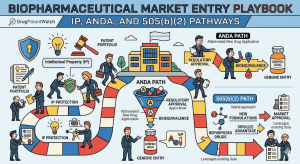
How pharma IP teams, portfolio managers, and R&D leads identify, evaluate, and time market entry opportunities across branded, 505(b)(2), and generic drug programs.
Why Most Pharma Market Entry Analyses Fail
The standard market entry report covers FDA pathways, patent expiry dates, and a peak sales estimate. Then it sits in a shared drive and ages badly. The reason most competitive analyses fail is not a lack of data. It is a failure to integrate patent intelligence, regulatory exclusivity stacking, IP asset valuation, and launch timing into a single operational framework.
This guide corrects that. It is written for pharma IP counsel, portfolio managers, business development leads, and analysts who need to move from ‘patent expiry in 2027’ to a defensible market entry thesis with modeled revenue scenarios, exclusivity windows, and litigation risk assessments. The frameworks here apply across small molecules, complex generics, 505(b)(2) differentiated products, and biologics approaching biosimilar competition.
Every section below ends with a Key Takeaways box for rapid executive use and, where relevant, an Investment Strategy note for analysts assessing asset value or M&A targets.
Part I: Drug Portfolio Evaluation as an IP Asset Exercise
The $2.23 Billion Problem
Drug development cost pharma an average of $2.23 billion per approved asset in 2024, per Deloitte’s annual R&D returns analysis. That figure includes the cost of failure baked in across all clinical-stage programs. With roughly 12% of candidates entering Phase I ultimately gaining FDA approval, the math demands rigorous portfolio screening well before Phase II spend escalates.
The conventional approach leans on Net Present Value (NPV), Internal Rate of Return (IRR), and hurdle rates. These are legitimate tools. But applied in isolation, they create a systematic bias against orphan indications and rare disease programs, where early market size projections are small, development timelines are long, and path-to-approval assumptions are punishing. A rigid NPV screen set at a 12% discount rate will kill many Orphan Drug Act candidates that would later generate blockbuster revenues once reimbursement dynamics are understood.
The better model treats the drug candidate’s IP position as a discrete input variable, not as a background assumption. Patent term, Patent Term Extension (PTE) eligibility, Orange Book listability, likelihood of Paragraph IV challenge, and regulatory exclusivity layering all change the NPV output materially. A composition-of-matter patent expiring in 2029 means something very different than a formulation patent backed by Orange Book listing, PTE, and pediatric exclusivity that extends effective market exclusivity to 2033.
IP Valuation as a Core Portfolio Input
Understanding the Exclusivity Stack
Pharmaceutical IP value is not a single number attached to a single patent. It is a stack of overlapping protections, each with its own duration, vulnerability, and commercial impact. Analysts who model only the composition-of-matter patent are systematically undervaluing or overvaluing assets.
The full exclusivity stack for a typical branded small molecule includes the primary composition-of-matter patent (20 years from filing, often filed 8-10 years before approval), a PTE of up to five years available under the Hatch-Waxman Act to restore time lost to FDA review, New Chemical Entity (NCE) exclusivity giving five years of data exclusivity from approval date during which the FDA cannot accept an ANDA or 505(b)(2) application that references the NDA, and any applicable regulatory exclusivities under Orphan Drug (seven years), pediatric (six additional months stacked on existing patents and exclusivities), or new indication (three years) designations.
In practice, a drug approved in 2022 with a composition-of-matter patent filed in 2005 might have a nominal patent expiry of 2025 but retain effective market exclusivity through 2030 when NCE exclusivity, a PTE, and a pediatric exclusivity extension are stacked. That gap, five to seven years of effective additional protection, is the difference between a declining asset and a multi-billion-dollar revenue extension.
IP Valuation for M&A and Licensing
When a large pharma acquires a mid-stage asset or licenses a development-stage compound, the IP position drives the deal economics more than the clinical data in most cases. A Phase II asset with clean composition-of-matter coverage, no relevant art threatening validity, and a realistic path to seven-year Orphan Drug exclusivity commands a structurally different multiple than a Phase II asset with a crowded formulation patent thicket and three pending inter partes review (IPR) petitions at the PTAB.
Standard royalty models, income-based IP valuation using discounted cash flows applied to exclusivity-period revenues, and market approach comparables should all reflect the specific exclusivity stack. A useful benchmark: for small molecules with strong composition-of-matter coverage and no filed Paragraph IV certifications, branded manufacturers typically achieve 7 to 10 years of effective market exclusivity post-launch. Assets with weak patent positions or already-challenged Orange Book patents often see generic entry within two to three years of launch.
Investment Strategy Note for Analysts: When screening pharma assets for acquisition or partnership, run a three-scenario IP model: base case assumes all listed Orange Book patents survive litigation and all exclusivities expire as scheduled; bear case assumes early Paragraph IV challenge with a 30% probability of successful invalidation at the PTAB or district court level; bull case includes successful pediatric study submission adding six months and a PTE awarded at maximum eligible term. The spread between these scenarios defines the IP risk premium on the deal.
Key Takeaways: Portfolio Evaluation
Effective portfolio evaluation prices the IP position before it models commercial opportunity. NCE exclusivity, PTE eligibility, orphan drug designation, and pediatric exclusivity each extend effective market exclusivity independently from the nominal patent term. NPV models that ignore exclusivity stacking systematically misprice assets. Hurdle rates above 12% tend to exclude orphan indications at early-stage review when reimbursement potential is not yet modeled. Treat IP valuation as a financial input, not a legal afterthought.
Part II: Branded Drug Strategy, Lifecycle Management, and the Evergreening Roadmap
From NDA Approval to Patent Cliff: The Revenue Lifecycle
A branded drug’s commercial life follows a predictable arc. Revenue grows through launch and peak sales, holds through the exclusivity period, then collapses within 12 months of loss of exclusivity (LOE). The collapse is not gradual. IQVIA data shows that branded drugs losing exclusivity to generic competition shed 80% or more of their market share within the first year, with price erosion accelerating from a 39% average drop with a single generic entrant to 79% with four entrants. Lipitor’s post-LOE decline is the textbook example: annual revenues fell from approximately $13 billion to under $3 billion within three years.
The window to act is narrow and closes fast. Planning for LOE should begin at NDA submission, not at the five-year mark. Companies that start lifecycle management four to five years before expected generic entry have enough runway to execute R&D-driven strategies, including new formulation development, new indication studies, and combination therapy programs. Companies that start one to two years out are limited to commercial plays: authorized generics, copay assistance programs, and formulary defense.
The Evergreening Technology Roadmap
Evergreening gets a bad reputation in public discourse, but it describes a real and legally sanctioned set of IP extension strategies. Understanding the full roadmap matters for both branded companies defending market position and for generics and 505(b)(2) developers identifying attack surfaces.
The primary tools are arranged below not as a list of three but as a continuum from highest to lowest IP defensibility:
A new composition-of-matter patent on a next-generation compound is the strongest protection. It requires meaningful medicinal chemistry work but produces an entirely new asset with its own 20-year clock and NCE exclusivity eligibility. AstraZeneca’s transition from omeprazole (Prilosec) to esomeprazole (Nexium) exemplifies this: the S-enantiomer isolation via chiral switching produced a patentable new chemical entity, extended AstraZeneca’s position in the proton pump inhibitor market by roughly a decade, and generated peak annual sales of approximately $5.7 billion for Nexium before its own exclusivity period ended.
Formulation patents on extended-release versions, combination products, or novel delivery systems are the next tier. Eli Lilly’s Prozac Weekly (extended-release fluoxetine) and GlaxoSmithKline’s Imitrex intranasal both relied on formulation innovations to create Orange Book-listed patents that extended exclusivity beyond the expiry of the original composition-of-matter coverage. These patents are more vulnerable to challenge than composition-of-matter claims but are far cheaper to develop.
Method-of-use patents covering new indications or dosing regimens occupy the weakest IP position in the stack. They are Orange Book listable and trigger Paragraph IV certification requirements from generic filers, but they are often the first to fall in litigation because method-of-use claims are easier to design around than composition or formulation claims.
Pediatric exclusivity sits outside the evergreening category strictly speaking. It requires conducting a pediatric study in response to an FDA Written Request. The reward is an automatic six-month extension applied to all existing patents and exclusivities. A drug with $2 billion in annual revenues gains roughly $1 billion in additional protected revenue from a pediatric study costing $10 to $50 million. The ROI is rarely matched elsewhere in the lifecycle management toolkit.
IP Valuation: Nexium Case Study
At its peak, Nexium carried an IP valuation estimated at $6 to $8 billion in net present value terms, driven by its composition-of-matter chiral switch patent, formulation coverage, and new method-of-use claims for erosive esophagitis. When analysts modeled AstraZeneca’s portfolio in the mid-2000s, Nexium’s IP stack accounted for roughly 35 to 40% of the company’s estimated enterprise value. This is the metric that matters in strategic planning: what fraction of current market cap is tied to a single LOE event, and what is the probability-weighted timeline of that event given active litigation?
Authorized Generics: The LOE Offensive Play
One response to patent expiry that shifted from defensive to offensive during the 2010s is the authorized generic (AG). An AG is a version of the branded drug sold under a different label, often by a subsidiary or contract manufacturer, at a price between the branded list price and the competing generic. The branded manufacturer files no ANDA but grants the AG partner the right to reference the original NDA.
The commercial logic is straightforward. A first-to-file generic challenger with 180-day exclusivity expects to capture 50 to 60% of prescription volume during its exclusivity window. If the branded manufacturer launches an AG simultaneously with generic entry, the first filer’s 180-day exclusivity is split with the AG, compressing revenue expectations for the generic challenger. Pfizer executed this precisely with Lipitor, launching Pfizer’s own generic sildenafil (for Viagra) alongside the first authorized generic entry, capturing a meaningful share of what would otherwise have been entirely captured by third-party generic competition.
AGs do not prevent generic entry. They slow the share loss curve and retain some revenue within the branded manufacturer’s P&L during the erosion period. For drugs with $500 million or more in annual revenues at LOE, even a two-year 20% revenue retention from AG sales represents $200 million in otherwise-lost revenue.
Investment Strategy Note for Analysts: When valuing a branded asset approaching LOE, model the AG probability separately from base case. If a company has internal generic manufacturing capability or an established AG partner, apply a 15 to 20% revenue upside to the post-LOE bear case. If no AG infrastructure exists and the company has historically declined to launch AGs (citing brand dilution concerns), treat that as a negative. The presence of a tentatively approved first-to-file ANDA with 180-day exclusivity on DrugPatentWatch is a signal that AG strategy discussions are already happening at the branded company.
Market Access, HTA, and the Pricing Defense
Branded drug pricing in 2025 operates under sustained government pressure. The Inflation Reduction Act’s Medicare drug price negotiation provisions, which took effect for the first selected drugs in 2026, represent the most structurally significant U.S. pricing policy shift in two decades. For small molecules, the IRA’s negotiation-eligible timeline begins at nine years post-approval (rather than thirteen for biologics). That compresses the high-revenue exclusivity window companies have historically used to recoup R&D costs.
Health Technology Assessment (HTA) bodies, including NICE in the UK, the Gemeinsamer Bundesausschuss (G-BA) in Germany, and the Haute Autorite de Sante (HAS) in France, each apply distinct cost-effectiveness thresholds and comparative effectiveness standards. Drugs that clear FDA approval without a comparator trial frequently face restricted formulary access in European markets until comparative data is generated post-approval. Payers increasingly require outcome-based contracts with clawback provisions tied to real-world evidence.
The commercial implication: a branded drug’s net realized price is increasingly detached from its list price. Gross-to-net discounts for branded drugs in specialty categories averaged 49% in 2024, per IQVIA. Portfolio managers modeling peak branded revenues using WAC pricing without applying realistic gross-to-net adjustments will systematically overstate commercial projections.
Key Takeaways: Branded Drug Strategy
Begin LOE planning at NDA submission, not at year five. The full exclusivity stack, including PTE, NCE, pediatric, and orphan extensions, determines effective market exclusivity, which routinely diverges from the nominal patent expiry date by five to seven years. Chiral switching and extended-release formulation represent the two most IP-defensible evergreening tactics. AGs are an underutilized LOE offensive tool for companies with manufacturing infrastructure. Gross-to-net discounts averaging 49% in specialty categories must be applied to any branded revenue model.
Part III: The 505(b)(2) Pathway as an IP and Commercial Strategy
What 505(b)(2) Actually Does
The 505(b)(2) New Drug Application pathway, established under the Hatch-Waxman Amendments of 1984, permits an applicant to rely on published literature or the FDA’s prior findings on a Reference Listed Drug (RLD) to satisfy safety and effectiveness requirements for a drug that is not identical to the RLD. The applicant still submits a full NDA with all required safety and effectiveness reports, but the clinical development burden is substantially reduced because existing data on the parent molecule substitutes for de novo clinical work.
The practical scope is broad. 505(b)(2) applications cover new dosage forms (tablets to oral films, injectables to subcutaneous delivery), new routes of administration, new strengths, new formulations including extended-release or abuse-deterrent designs, new indications, combination products pairing two previously approved actives, and prodrugs of approved molecules. By 2024, 60% of all NDAs approved by the FDA used the 505(b)(2) pathway, and average review times for these applications had compressed to approximately 10 months.
IP Strategy for 505(b)(2) Products
Creating Independent Exclusivity
The central IP opportunity in 505(b)(2) development is the creation of a new Orange Book-listed patent covering the modification, paired with an independent regulatory exclusivity grant that did not exist for the RLD. This is not a minor tactical point. It is the entire commercial logic of the pathway.
A 505(b)(2) product covering a new dosage form of an approved drug, if the dosage form has not been previously approved, qualifies for three years of new clinical study exclusivity, during which the FDA cannot approve an ANDA or another 505(b)(2) referencing that specific dosage form. If the drug is developed for a rare disease affecting fewer than 200,000 people in the U.S., Orphan Drug exclusivity of seven years applies regardless of the underlying patent position of the parent molecule. If the product addresses a pediatric indication, the Written Request pathway makes pediatric exclusivity available on top of existing exclusivities.
The structural implication: a 505(b)(2) developer can build an independent exclusivity position on a molecule whose composition-of-matter patent has already expired. The generic manufacturer who launches a generic version of the parent molecule is not competing with the 505(b)(2) product for purposes of regulatory exclusivity. The 505(b)(2) product’s three to seven year exclusivity window runs independently.
IP Valuation: Narcan Nasal Spray
Narcan (naloxone 4 mg nasal spray), approved by the FDA in 2015 via the 505(b)(2) pathway, illustrates how a delivery-system innovation converts a decades-old off-patent molecule into a defensible commercial asset. The composition-of-matter patent on naloxone itself expired long before 2015. Emergent BioSolutions’ 505(b)(2) NDA cited the existing naloxone safety database while generating new clinical data for the intranasal formulation’s pharmacokinetic profile.
The resulting Orange Book listing covered the novel drug-device delivery mechanism, the specific formulation, and the administration method. New clinical study exclusivity provided three years of FDA protection against generic substitution. At the time of FDA approval, Narcan carried an estimated IP value of $400 to $600 million in exclusivity-period net revenues, based on the opioid overdose reversal market size and the absence of an equivalent over-the-counter-ready formulation. When Emergent acquired the Narcan commercial rights and built the OTC switch strategy, the IP position underpinning the product was the 505(b)(2)-generated exclusivity stack, not any surviving composition-of-matter coverage.
IP Valuation: Emflaza (Deflazacort)
Emflaza’s 2017 approval for Duchenne muscular dystrophy via 505(b)(2) with Orphan Drug designation illustrates the highest-value application of the pathway. Deflazacort had been used off-label in the U.S. for years, available as imported product from Europe. Marathon Pharmaceuticals (later PTC Therapeutics) filed a 505(b)(2) NDA that formally established the compound’s safety and efficacy profile in the U.S. regulatory record, triggering seven years of Orphan Drug exclusivity. The IP asset created was not a new molecule. It was a U.S. regulatory exclusivity position on an existing steroid. Market pricing for Emflaza immediately post-approval drew scrutiny given the product’s international availability, but the exclusivity position itself was legally unimpeachable. The episode generated significant policy debate about Orphan Drug exclusivity as an IP asset, and it illustrates precisely why 505(b)(2) IP valuation requires separate analysis from scientific novelty assessment.
505(b)(2) IP Vulnerabilities
Two risks are specific to the 505(b)(2) structure. First, if the 505(b)(2) applicant references a competitor’s NDA as the RLD rather than published literature, that triggers a patent certification requirement under 21 U.S.C. 355(b)(2)(A). The applicant must certify either that it is not seeking approval before relevant listed patents expire (a Paragraph III certification), or that those patents are invalid or will not be infringed (a Paragraph IV certification). A Paragraph IV certification triggers a 30-month stay of 505(b)(2) approval while the NDA holder litigates, creating a structural litigation exposure that generic developers know well but that some 505(b)(2) entrants underestimate.
Second, when the 505(b)(2) product competes against a branded drug with a strong Orange Book presence, the innovator’s listed patents apply to the 505(b)(2) product even if the modification is genuinely distinct. Thorough freedom-to-operate analysis at the predevelopment stage is not optional. It is the primary diligence step before committing 505(b)(2) development spend.
Investment Strategy Note for Analysts: When valuing a 505(b)(2) pipeline asset, calculate the exclusivity-period revenue window using three inputs: the specific exclusivity type and its duration, the addressable market for the modified form (not the parent molecule’s total market), and the probability of a Paragraph IV challenge materializing before or shortly after approval. For products with Orphan Drug designation, 180-day exclusivity is not available for would-be generic challengers during the seven-year ODE window, which is a substantially stronger competitive moat than three-year new clinical study exclusivity. Discount the Orphan Drug-protected 505(b)(2) asset by 10 to 15% less on litigation risk than a non-orphan 505(b)(2).
505(b)(2) Development Roadmap: From Candidate Selection to Launch
Stage one is candidate selection and freedom-to-operate. The target molecule should have an established safety profile robust enough to substitute for de novo Phase I toxicology. The modification must be clinically meaningful enough to support both the FDA’s efficacy determination and a pricing premium over the parent generic. The freedom-to-operate analysis must clear both the RLD holder’s Orange Book-listed patents and any third-party patents on the modified form.
Stage two is regulatory strategy and study design. The 505(b)(2) applicant works with the FDA in a Type B pre-NDA meeting to define exactly which clinical data will be required to supplement the reference data. For a new extended-release formulation, this typically means one or two pharmacokinetic bridging studies comparing the new formulation’s absorption profile to the RLD under fasted and fed conditions, plus appropriate safety monitoring data. The FDA may require additional clinical endpoint data if the modification alters therapeutic effect in ways not captured by PK bridging alone.
Stage three is Orange Book strategy and launch preparation. Patents covering the new formulation, the delivery mechanism, or the method of use for the new indication are filed and submitted for Orange Book listing at NDA approval. Each listed patent requires a subsequent ANDA or 505(b)(2) filer to certify under Paragraph I, II, III, or IV. Paragraph IV certifications trigger the 30-month stay and the 45-day litigation window. Companies that fail to list eligible patents at approval leave the exclusivity position partially unprotected.
Stage four is commercial launch with pricing positioned between the branded originator and the generic version of the parent molecule. A 505(b)(2) extended-release product at two to three times the generic price of the immediate-release parent but 30 to 40% below the originator brand captures a defensible market segment if physician preference for the modified form is established through promotional activity and formulary placement.
Key Takeaways: 505(b)(2) Strategy
Three-year new clinical study exclusivity applies to the specific modification approved, not the parent molecule. Orphan Drug exclusivity at seven years is the most commercially valuable 505(b)(2) exclusivity type and applies independently of any underlying patent position. Paragraph IV risk is highest when the 505(b)(2) references a competitor’s NDA as RLD. The full 505(b)(2) development process, from candidate selection through approval, typically runs 24 to 48 months at a cost 40 to 50% below a traditional NDA requiring de novo Phase I through Phase III data packages. 505(b)(2) products should be valued using an exclusivity-specific DCF model, not a generic revenue erosion curve.
Part IV: ANDA Strategy, Paragraph IV Litigation, and Generic Market Dynamics
The ANDA Pathway and How Generic Entry Actually Works
The Abbreviated New Drug Application, established under the Hatch-Waxman Act of 1984, requires a generic manufacturer to demonstrate bioequivalence to a Reference Listed Drug rather than re-prove safety and efficacy through new clinical trials. Bioequivalence is established via pharmacokinetic studies measuring area under the concentration-time curve (AUC) and maximum concentration (Cmax) within 80 to 125% of the RLD’s values in healthy volunteers. This standard applies to standard oral solid dosage forms. Complex generics, including inhaled products, topical formulations, certain injectables, and transdermal systems, require product-specific bioequivalence guidance and often biostudy designs far more involved than simple PK comparison.
The ANDA filer must also certify with respect to each patent listed in the Orange Book for the RLD. Paragraph I certifies no patent is listed. Paragraph II certifies all listed patents are expired. Paragraph III certifies the ANDA will not launch before the relevant patent expires. Paragraph IV, the most commercially significant certification, asserts that the listed patent is invalid, unenforceable, or will not be infringed by the generic product.
A Paragraph IV certification triggers two immediate consequences. The NDA holder and patent owner have 45 days from receiving the Paragraph IV notice to file a patent infringement suit in federal district court. If they do, a 30-month stay of ANDA approval automatically applies, preventing the FDA from approving the ANDA until the stay expires or the patent is adjudicated, whichever comes first. The first applicant to file an ANDA with a Paragraph IV certification for a given drug-patent combination earns 180 days of generic market exclusivity before subsequent ANDA filers can enter.
The Economics of 180-Day First-Filer Exclusivity
The 180-day first-filer exclusivity is the primary financial driver of paragraph IV litigation strategy for generic manufacturers. During the 180-day window, only the first filer and any authorized generic launched by the branded manufacturer share the generic market. A second or third generic filer cannot launch until the 180-day period runs.
The revenue impact is substantial. For a drug with $1 billion in annual branded sales at patent expiry, the first-filer generic can expect to capture 40 to 50% of prescription volume at a price roughly 20 to 30% below the branded WAC during the 180-day window. With no other generic competition, price erosion is moderate. That translates to $75 to $150 million in net revenue for the first filer over six months, on a drug for which the ANDA development and litigation cost might total $15 to $40 million. The IRR on first-filer paragraph IV strategy, when successfully executed, frequently exceeds 100%.
Teva’s 2019 generic EpiPen launch captured over 30% of epinephrine auto-injector market volume within six months by exploiting precise patent expiry timing. Mylan’s 2018 generic Advair Diskus launch targeted the $3.4 billion Advair market at a time when the complex inhaler device patent landscape had thinned enough to support ANDA approval. Both executions required years of patent landscape monitoring, product-specific bioequivalence protocol development, and litigation management before a dollar of revenue was realized.
Patent Challenge Strategy: Identifying Vulnerable Orange Book Listings
Not every Orange Book patent is worth challenging. The decision to file a Paragraph IV certification is a capital allocation decision that should be modeled with the same rigor applied to any other R&D investment.
Orange Book patent vulnerability assessment involves four factors. First, claim scope: composition-of-matter claims covering the active ingredient itself are the hardest to invalidate because prior art must predate the filing date and the synthetic route is usually proprietary. Formulation patents, method-of-use patents, and polymorph patents are progressively more vulnerable to prior art challenges. Second, post-grant validity: patents that have survived inter partes review at the PTAB carry stronger presumption of validity than patents that have not been tested. Third, infringing product design: a generic manufacturer can design around method-of-use claims if the labeled indication for the generic product excludes the patented use, though carve-outs are subject to induced infringement risk if prescribers routinely use the drug for the patented indication off-label. Fourth, litigation history: patents already defeated in district court or at the PTAB for one generic filer are weak targets for continued defense, even if the branded manufacturer appeals.
Patent intelligence platforms including DrugPatentWatch track Orange Book listings, Paragraph IV certifications filed, litigation status by patent and ANDA, PTAB petition activity, and tentative approval dates across 134 countries. For a generic manufacturer’s business development team, this data is the primary screening tool for identifying first-filer opportunities with manageable litigation risk before competitors file.
Complex Generics: The Next Strategic Frontier
The FDA defines complex generics as products where the route of administration, dosage form, delivery mechanism, or the complexity of the drug substance itself creates a higher-than-standard bioequivalence challenge. Drug products in this category include inhaled corticosteroids (Advair, Symbicort), locally acting gastrointestinal drugs (Apriso, Asacol HD), topical drug products, complex injectables including liposomal and nanoparticle formulations, and transdermal delivery systems.
The FDA’s GDUFA III framework (2022) specifically targets complex generic development, funding agency resources for product-specific bioequivalence guidance development and for research integrating empirical biostudy data with physiologically based pharmacokinetic (PBPK) modeling. The commercial implication is that complex generics carry higher barriers to entry, fewer generic filers at patent expiry, and slower post-LOE price erosion compared to standard oral solids. A complex generic market with two to three entrants will see price erosion of 50 to 60%, versus 79% with four entrants in a standard solid oral dosage form market.
For generic portfolio managers, the strategic shift is from vanilla tablet programs that are commoditized and often underwater on margin to complex generic programs with three to five years of clinical and analytical development investment that yield six to eight years of above-average margins post-launch.
Investment Strategy Note for Analysts: When screening generic manufacturers for acquisition or investment, the ratio of complex generic ANDAs pending to total ANDA count is a useful quality indicator. Companies with 30% or more of their pending ANDAs in complex generic categories (inhaled, topical, injectable) carry a structurally better margin profile than those concentrated in standard oral solid programs. Teva’s 2024 strategic plan explicitly prioritized complex generics and biosimilars as the margin recovery pathway after years of vanilla generic pricing pressure.
Key Takeaways: ANDA and Generic Strategy
Paragraph IV first-filer 180-day exclusivity is the most reliably high-IRR investment in generic pharmaceutical strategy when patent vulnerability is correctly assessed. Orange Book patent challenge decisions should be modeled as capital allocation decisions with explicit assumptions about litigation probability, settlement risk, and at-risk launch exposure. Complex generics carry higher development costs but structurally better post-launch margins due to lower entrant counts at expiry. GDUFA III accelerates FDA processing for complex generic applications, improving the economics of the development timeline. The shift to complex generics and biosimilars is not optional for large generic manufacturers competing on profitability rather than volume.
Part V: Patent Intelligence and Competitive Surveillance
Building a Patent Surveillance Operation
Patent applications become publicly available 18 months after filing under the Patent Cooperation Treaty. This means a competitor’s R&D program is visible in the patent record roughly 18 months after the invention is made, years before it enters clinical development. For a pharmaceutical IP team or competitive intelligence function, systematic monitoring of competitor patent filings is the earliest possible signal of pipeline activity.
The signals to track include new composition-of-matter applications naming previously uncharted chemical series or biological targets, continuation patents in an established series that indicate active structural optimization, process patents that reveal manufacturing route changes suggesting a program approaching clinical or commercial scale, and formulation patents that indicate a compound is being prepared for specific delivery requirements consistent with late-stage development.
Geographic scope of patent filings is independently informative. Companies typically seek patent protection in markets where they anticipate commercial activity. A compound with patent filings in the U.S., EU, Japan, and China but not in Latin America or Southeast Asia communicates a commercial scope that shapes competitive market entry planning for both generic and branded competitors.
The PTAB’s inter partes review data adds a second intelligence layer. IPR petitions reveal which patents competitors or generic manufacturers consider commercially significant enough to challenge, and PTAB decisions on patent validity signal which assets are legally vulnerable before any district court action is filed.
Using DrugPatentWatch for Actionable Intelligence
DrugPatentWatch aggregates pharmaceutical patent data, Orange Book listings, ANDA and NDA regulatory milestones, litigation status, and tentative approval records across 134 countries into a single queryable platform. For IP and business development teams, the core use cases are specific and operational.
Tracking patent expiry and exclusivity cliffs for competitor branded drugs, with estimated generic entry dates, enables commercial teams to prepare for market disruption before it occurs rather than reacting to generic launch announcements. Identifying tentatively approved ANDAs for a branded drug the company markets tells a branded manufacturer exactly which generic manufacturers are positioned to launch the moment a 30-month stay expires or a court rules against the listed patent. Screening for first-filer 180-day exclusivity opportunities on upcoming LOE drugs, filtering by the absence of pending Paragraph IV certifications, identifies low-competition ANDA opportunities that carry above-average margins without the litigation overhead.
The platform’s predictive modeling function applies historical patent challenge success rates by technology category and patent owner to estimate the probability distribution of generic entry dates for individual drugs. This output feeds directly into risk-adjusted branded revenue models.
Freedom-to-Operate: The Precompetitive Diligence Step
Freedom-to-operate (FTO) analysis determines whether a company can commercialize a product without infringing third-party patent rights. In pharmaceutical development, FTO analysis is the precompetitive gate that precedes capital commitment to development programs. A company that develops a 505(b)(2) formulation of Drug X without clearing the formulation patents owned by Drug X’s NDA holder is building a product it cannot launch without licensing or litigation.
The FTO scope for a generic or 505(b)(2) program includes all Orange Book-listed patents for the RLD, all non-Orange-Book patents covering the active ingredient, its known polymorphs, its key metabolites, its primary formulation technologies, and its established manufacturing processes. For complex generics, the FTO also covers device patents if the generic product incorporates a drug-device combination.
Defects in FTO analysis are among the most common causes of failed generic or 505(b)(2) launches. A product approved by the FDA but blocked from commercial distribution by an unexpected patent infringement injunction is the worst-case scenario, especially if the company has already committed manufacturing capacity and distribution infrastructure.
Key Takeaways: Patent Intelligence
Patent filings become public 18 months after submission, giving IP surveillance teams a multi-year lead time on competitor pipeline activity. PTAB IPR petition data reveals which patents the market considers commercially significant and legally vulnerable. DrugPatentWatch’s tracking of tentative ANDA approvals and litigation status by patent provides a real-time LOE risk signal for branded companies and a market entry timing tool for generic manufacturers. FTO analysis must cover Orange Book and non-Orange Book patents before development capital is committed.
Part VI: AI, Biosimilars, and the Regulatory Landscape Through 2028
AI in Portfolio and IP Decision-Making
Artificial intelligence applications in pharmaceutical portfolio management moved from proof-of-concept to operational deployment between 2022 and 2025. The primary commercially validated use cases are target identification and molecular screening, clinical trial patient matching and protocol optimization, and real-world evidence analysis for post-approval market access.
For IP and competitive intelligence functions specifically, natural language processing (NLP) applied to patent claim sets extracts claim scope data at scale, enabling automated monitoring of competitor filings across multiple jurisdictions without manual review. Machine learning models trained on historical PTAB and district court outcomes generate probabilistic validity assessments for individual patent claims, helping prioritize which Orange Book patents to challenge via Paragraph IV certification.
The portfolio optimization application, where AI models analyze historical clinical development outcomes by therapeutic area, modality, mechanism of action, and trial design to predict probability of technical success, is increasingly used to set hurdle rates that reflect modality-specific risk rather than applying a uniform discount across all programs. A monoclonal antibody in autoimmune disease with a validated target has a structurally different probability of technical success than a small molecule in CNS with a novel mechanism, and risk-adjusted NPV models should reflect that difference explicitly.
Companies investing in proprietary training datasets, where AI models are trained on internal clinical and commercial outcomes rather than only public data, are generating IP intelligence capabilities that cannot be replicated from publicly available models. This creates a data moat that is itself an intangible asset.
Biosimilars: The Biologic LOE Playbook
The Biologics Price Competition and Innovation Act (BPCIA) established the 351(k) abbreviated approval pathway for biosimilar biologics, requiring demonstration of high similarity to the reference biologic with no clinically meaningful differences in safety, purity, or potency. Reference biologics receive 12 years of regulatory exclusivity from approval, four years longer than small molecule NCE exclusivity.
The biosimilar market reached a record 18 approvals in 2024. Approved biosimilars to major reference products including adalimumab (Humira), etanercept (Enbrel), and bevacizumab (Avastin) have driven price competition that was structurally unavailable during the biologic exclusivity period. But unlike small molecule generic market dynamics, biosimilar market penetration is slower and more variable. Formulary access, interchangeability designation requirements, and physician confidence in the biosimilar’s clinical equivalence all moderate uptake in ways that do not apply to small molecule generic substitution.
Interchangeability designation, a separate FDA determination beyond biosimilarity finding, permits pharmacist-level substitution without prescriber intervention for interchangeable biosimilars. It requires additional switching study data demonstrating consistent therapeutic response when patients alternate between the biosimilar and the reference product. As of 2025, fewer than 20 approved biosimilars carry interchangeability designation, limiting automatic substitution for most approved products.
For branded biologic manufacturers, the biosimilar LOE strategy differs from small molecule LOE planning in two respects. Patent thickets around biologic drugs, covering not just the molecule but manufacturing process patents, formulation patents, and device patents on pre-filled syringe or auto-injector presentations, are deliberately dense. AbbVie listed over 100 patents in the Orange Book for Humira prior to biosimilar entry. This thicket strategy delayed U.S. biosimilar entry until 2023, nine years after the first U.S. biosimilar approval in another product class.
The IP valuation implication for biologic assets: a biologic with a robust patent thicket spanning composition of matter, manufacturing process, and device patents carries a much longer effective market exclusivity period than its 12-year regulatory exclusivity alone suggests. Analysts modeling biologic LOE dates must account for the litigation timeline required to clear each layer of the thicket, not just the earliest nominal patent expiry.
Investment Strategy Note for Analysts: The biosimilar competitive entry sequence matters more than the expiry date of any single patent. Map each layer of the reference biologic’s patent thicket, identify which patents have been challenged by tentatively approved biosimilar applications, and model the expected litigation resolution timeline. The delta between regulatory exclusivity expiry and effective market entry for biosimilars has averaged four to six years for major reference biologics in the U.S. Branded biologic valuations should not be haircut at the 12-year mark. The realistic LOE adjustment should reflect expected litigation runway.
Regulatory Initiatives: DCAP, GDUFA III, and the IRA
The FDA’s Drug Competition Action Plan (DCAP), launched in 2017, targets two persistent barriers to generic entry. The first is the REMS abuse tactic, where branded manufacturers use Risk Evaluation and Mitigation Strategies to deny generic developers access to branded product samples needed for bioequivalence testing. The FDA has moved to address this through shared REMS programs. The second is the “citizen petition delay” tactic, where branded manufacturers file citizen petitions near ANDA approval dates to delay competitive entry. The FDA now evaluates citizen petitions received within 150 days of a pending ANDA’s approval date with heightened scrutiny.
GDUFA III committed the FDA to specific review performance goals for complex generic ANDA applications in exchange for industry user fees. For first-cycle review, the target is 90% of standard ANDAs reviewed within 12 months and 90% of priority ANDAs reviewed within 8 months. These timelines, if met, materially reduce the risk discount on complex generic development programs.
The Inflation Reduction Act’s Medicare drug price negotiation mechanism, fully operational from 2026, specifically excludes orphan drugs designated for a single rare disease (a carve-out created in the legislative text), small manufacturers below defined revenue thresholds, and drugs with fewer than seven years of market experience (for small molecules) or 11 years (for biologics). The IRA also penalizes price increases above the rate of inflation for Medicare Part B and Part D drugs, with manufacturers required to pay rebates on the excess. For portfolio managers, the IRA creates a structural incentive to price new launches higher at approval rather than increasing price post-launch, since the inflation rebate mechanism punishes the latter.
Key Takeaways: AI, Biosimilars, and Regulatory Evolution
AI-driven NLP patent monitoring and probabilistic patent validity models are operational tools, not future capabilities. Biosimilar interchangeability designation remains rare and substantially increases formulary access. Biologic patent thickets routinely extend effective market exclusivity four to six years beyond the 12-year regulatory exclusivity period. DCAP has reduced REMS abuse and citizen petition delay as systematic LOE barriers. The IRA creates a front-loaded pricing incentive for new branded launches and a long-term negotiation exposure for drugs at years nine to thirteen post-approval.
Part VII: Case Studies in Market Entry Execution
Teva Generic EpiPen: First-Filer Execution
Teva’s 2019 generic EpiPen approval and launch is a case study in Paragraph IV execution. The epinephrine auto-injector market had been effectively monopolized by Pfizer’s EpiPen (distributed by Mylan) for years. Device patents, not just drug patents, created the primary IP barrier. Teva’s development program required both an ANDA demonstrating drug bioequivalence and a device design sufficiently differentiated from the EpiPen auto-injector to avoid device patent infringement. This dual-track development approach, addressing drug and device IP simultaneously, added development cost but enabled a Paragraph IV certification covering the full product.
Teva captured over 30% of epinephrine auto-injector market volume within six months of launch. The first-filer 180-day exclusivity window compressed total competition during that period, enabling pricing well above where price would settle with five or six entrants. The program cost is not publicly disclosed but is estimated to have required $20 to $40 million in development and litigation investment, against revenues of approximately $100 to $150 million during the 180-day exclusivity window.
Narcan Nasal Spray: 505(b)(2) Addressing Public Health
The Narcan (naloxone 4 mg nasal spray) 505(b)(2) approval in 2015 created a commercially defensible product in the opioid overdose reversal space where the underlying molecule was off-patent and injectable naloxone was inexpensive. The commercial thesis rested entirely on the 505(b)(2) pathway’s ability to create an independent regulatory exclusivity position on a novel delivery form for an existing drug.
Emergent BioSolutions supported the clinical development; the product was later acquired, reformulated for OTC use, and approved for over-the-counter sale by the FDA in 2023. The OTC switch created a second 505(b)(2) application cycle, generating additional three-year new clinical study exclusivity on the OTC-specific use. The OTC Narcan launch at $45 per dose competed against prescription naloxone products at substantially higher net-of-rebate prices and generated first-year retail revenues estimated at $200 to $250 million. The IP engine for the entire franchise was the original 2015 505(b)(2) formulation patent and regulatory exclusivity stack.
AstraZeneca Prilosec to Nexium: Chiral Switch at Scale
AstraZeneca’s transition of its proton pump inhibitor franchise from omeprazole (Prilosec) to esomeprazole (Nexium) is the textbook chiral switch example. The racemic omeprazole mixture was the active ingredient in Prilosec. AstraZeneca isolated the S-enantiomer, esomeprazole, generated clinical data showing modestly improved acid suppression metrics compared to racemic omeprazole, filed for new composition-of-matter patent coverage on the pure enantiomer, and began transitioning prescribers to Nexium before Prilosec’s patent expired.
The commercial result was peak Nexium sales of approximately $5.7 billion globally by 2009. The enantiomer separation produced a new 20-year patent clock. AstraZeneca’s Nexium patents were not challenged successfully until years later, extending the franchise well past what omeprazole’s original patent term would have permitted.
The IP valuation lesson: the incremental cost of a chiral switch program, primarily synthetic chemistry and comparative clinical studies, is a fraction of the revenue extension value. The investment justified a $500 million to $1 billion R&D allocation that generated a $5 billion-plus peak sales asset. The ratio of investment to exclusivity-period value creation is the metric that makes lifecycle management economically rational, regardless of public controversy about the tactic.
Key Takeaways: Case Studies
First-filer Paragraph IV strategy delivers the highest IRR in generic pharmaceutical investment when device IP is addressed alongside drug IP. 505(b)(2) exclusivity positions on off-patent molecules create independent commercial value that persists beyond the parent molecule’s generic market. Chiral switch investments generate returns that justify allocation even when total development cost reaches hundreds of millions of dollars. In each case, IP valuation at program initiation, not just clinical proof of concept, drove the strategic decision.
Part VIII: Investment Strategy Master Framework
Scoring a Pharma Asset for Market Entry Potential
Analysts evaluating biopharmaceutical market entry opportunities, whether as a potential acquirer, licensor, or internal portfolio decision-maker, should apply a consistent scoring framework across five dimensions.
The first dimension is exclusivity runway. Calculate total effective market exclusivity remaining, accounting for all layers of the exclusivity stack (patents, PTE, NCE, orphan, pediatric), and probability-weight the runway for litigation risk of each layer. A five-year exclusivity runway with 70% confidence is worth more than an eight-year runway with 40% confidence.
The second dimension is market size and pricing defensibility. Model the addressable market at net realized price, not WAC. Apply gross-to-net adjustments appropriate to the payer mix (commercial, Medicare Part D, Medicaid) and the therapeutic category. For specialty drugs, 40 to 55% gross-to-net discounts are standard. For complex generics in the 180-day window, the price premium over eventual multi-entrant generic pricing determines total first-mover revenue.
The third dimension is competitive density at launch. Count the number of approved or tentatively approved ANDAs or 505(b)(2) applications for the same indication and dosage form. Each additional approved competitor at launch compresses the price-revenue curve. First-filer with no approved competitor earns approximately 50% market share at 70 to 80% of branded price. A market with six approved generics at launch averages 20 to 30% price erosion from Day 1.
The fourth dimension is litigation exposure. Assess each Orange Book patent’s validity vulnerability, the branded manufacturer’s historical litigation behavior (some companies settle aggressively; others litigate through every appeal), and the PTAB’s historical record on similar patent claim types in the same technology category.
The fifth dimension is manufacturing and regulatory execution risk. Complex generics and 505(b)(2) products with novel delivery systems carry higher CMC risk than standard oral solid generics. FTO clearance must be confirmed before manufacturing investment is committed.
Assign each dimension a score from one to five, weight by strategic priority (IP teams may weight exclusivity runway highest; commercial teams may weight market size highest), and rank programs accordingly.
When to Acquire versus Build
The build-versus-buy decision for market entry programs reduces to a comparison of internal capability cost and time against acquisition cost and integration risk. For standard oral solid generics in established therapeutic areas, internal development is almost always cheaper than acquisition at the ANDA filing stage. For complex generics requiring product-specific bioequivalence protocols not yet in the FDA’s guidance library, or for 505(b)(2) programs requiring novel formulation technology not available internally, acquisition of a development-stage company with the technology in hand may accelerate time to market by two to three years.
In the biologics space, biosimilar development cost runs $100 to $250 million per program, and the patent challenge landscape is complex enough that very few companies develop all capabilities internally. Strategic alliances pairing a large generic manufacturer’s regulatory and commercial infrastructure with a specialized biosimilar developer’s analytical and manufacturing capabilities have become the standard execution model.
The M&A premium for a Phase III-ready 505(b)(2) or complex generic program with confirmed FTO, a Paragraph IV certification already filed, and a strong probability of first-filer status typically runs three to five times program development cost, reflecting the commercial value of the timing advantage.
Conclusion: The Framework Is the Strategy
Market entry in biopharmaceuticals is not a single decision. It is a sequence of IP valuation, exclusivity modeling, regulatory pathway selection, patent challenge strategy, and commercial execution planning, each of which depends on the quality of the data underlying it.
Companies that treat patent intelligence as a quarterly report rather than a continuous monitoring function consistently enter markets late. Companies that model branded asset value without accounting for the full exclusivity stack consistently overpay in M&A. Companies that execute 505(b)(2) programs without clearing formulation patent exposure consistently face launch delays that eliminate the pricing premium the pathway was intended to capture.
The frameworks described here are not theoretical. They describe how IP teams, portfolio managers, and competitive intelligence functions at well-run pharmaceutical organizations actually operate. Applying them requires current, accurate data at every step. DrugPatentWatch’s patent expiry tracking, litigation status monitoring, ANDA approval pipeline, and multi-country exclusivity data provide the operational foundation for each layer of this analysis.
The companies that consistently find and win biopharmaceutical market entry opportunities are the ones that make IP intelligence a core operational function, not a due diligence checkbox.
Frequently Asked Questions
What is the difference between patent term and effective market exclusivity for a branded drug?
Patent term runs 20 years from filing date. Effective market exclusivity is the period during which no competing generic or biosimilar product can enter the market, which is shorter due to development time but can be extended by Patent Term Extension, regulatory exclusivities (NCE, orphan, pediatric), and successful patent litigation. The two figures routinely diverge by five to eight years.
How does NCE exclusivity interact with Paragraph IV certification?
During the five-year NCE exclusivity period following NDA approval, the FDA cannot accept an ANDA or 505(b)(2) application that references the NDA. One exception: if the generic filer includes a Paragraph IV certification, the FDA can accept the application after four years of NCE exclusivity have elapsed. This creates a four-year, rather than five-year, effective Paragraph IV filing window for first movers targeting NCE-protected drugs.
What defines a ‘complex generic’ for FDA purposes?
The FDA defines complex generics by one or more of the following characteristics: complex active ingredient (peptides, polymers, iron-carbohydrate complexes), complex formulation (liposomal, nanoparticle, albumin-bound), complex route of administration (inhaled, topical, locally acting GI products), complex drug-device combination, or a situation where a complex relationship between active ingredient and clinical outcomes makes standard bioequivalence methods insufficient.
How long does a Paragraph IV litigation case typically take?
Most Paragraph IV cases filed in district court resolve within 18 to 30 months, either through settlement or trial judgment. The 30-month automatic stay of ANDA approval runs simultaneously. If the case is not resolved within 30 months, the stay expires and the FDA can approve the ANDA regardless of ongoing litigation, creating risk of at-risk launch by the generic manufacturer.
What does biosimilar interchangeability designation require?
The FDA requires switching study data demonstrating that alternating between the biosimilar and the reference biologic produces no greater reduction in clinical performance or increase in safety risk than continued use of the reference product alone. Only products with interchangeability designation can be substituted at the pharmacy level without prescriber intervention, making this designation critical for formulary-driven volume uptake.
Data sources: IQVIA Institute, Deloitte R&D Returns Analysis 2024, FDA Orange Book, PTAB annual statistics, DrugPatentWatch patent expiry database, CBO Pharmaceutical R&D analysis, BPCIA 15th Anniversary FDA CDER summary.


(2) Pathway: Unlocking a Hybrid Strategy for Drug Innovation")

(2) Pathway")
(2) Beats the Branded Generic Every Time — Unless It Doesn't")


(2) Goldmine: How Pharma Extracts Maximum IP Value from Modified Drugs")
(2) Pathway")