Buprenorphine - Generic Drug Details
✉ Email this page to a colleague
What are the generic sources for buprenorphine and what is the scope of freedom to operate?
Buprenorphine
is the generic ingredient in fourteen branded drugs marketed by Amneal, Difgen Pharms, Mylan Tech Viatris, Strides Pharma Intl, Watson Labs Teva, Purdue Pharma Lp, Braeburn, Indivior, Bdsi, Reacx Pharms, Am Regent, Hikma, Hospira, Ph Health, Somerset Theraps Llc, Actavis Elizabeth, Ascent Pharms Inc, Barr, Ethypharm, Pharmobedient, Rhodes Pharms, Rubicon Research, Specgx Llc, Sun Pharm, Alvogen, Dr Reddys Labs Sa, Mylan Technologies, Teva Pharms Usa, Alkem Labs Ltd, Amneal Pharms, Lannett Co Inc, Wes Pharma Inc, and Edenbridge Pharms, and is included in fifty-two NDAs. There are thirty-eight patents protecting this compound and two Paragraph IV challenges. Additional information is available in the individual branded drug profile pages.Buprenorphine has one hundred and seventy-six patent family members in thirty-six countries.
There are twenty-nine drug master file entries for buprenorphine. Ten suppliers are listed for this compound. There are two tentative approvals for this compound.
Summary for buprenorphine
| International Patents: | 176 |
| US Patents: | 38 |
| Tradenames: | 14 |
| Applicants: | 33 |
| NDAs: | 52 |
| Drug Master File Entries: | 29 |
| Finished Product Suppliers / Packagers: | 10 |
| Raw Ingredient (Bulk) Api Vendors: | 20 |
| Clinical Trials: | 537 |
| Patent Applications: | 4,646 |
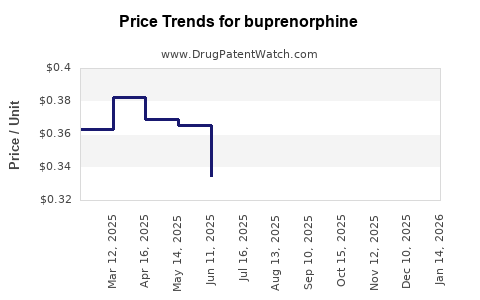
| Drug Prices: | Drug price trends for buprenorphine |
| Patent Litigation and PTAB cases: | See patent lawsuits and PTAB cases for buprenorphine |
| What excipients (inactive ingredients) are in buprenorphine? | buprenorphine excipients list |
| DailyMed Link: | buprenorphine at DailyMed |
Recent Clinical Trials for buprenorphine
Identify potential brand extensions & 505(b)(2) entrants
| Sponsor | Phase |
|---|---|
| Montefiore Medical Center | PHASE3 |
| Wake Forest University Health Sciences | PHASE4 |
| Braeburn Inc | PHASE4 |
Generic filers with tentative approvals for BUPRENORPHINE
| Applicant | Application No. | Strength | Dosage Form |
| ⤷ Start Trial | ⤷ Start Trial | EQ 8MG BASE;EQ 2MG BASE | FILM;BUCCAL, SUBLINGUAL |
| ⤷ Start Trial | ⤷ Start Trial | EQ 0.7MG BASE;EQ 0.18MG BASE | TABLET;SUBLINGUAL |
| ⤷ Start Trial | ⤷ Start Trial | EQ 2.9MG BASE;EQ 0.71MG BASE | TABLET;SUBLINGUAL |
The 'tentative' approval signifies that the product meets all FDA standards for marketing, and, but for the patents / regulatory protections, it would approved.
Pharmacology for buprenorphine
| Drug Class | Partial Opioid Agonist |
| Mechanism of Action | Partial Opioid Agonists |
Medical Subject Heading (MeSH) Categories for buprenorphine
Anatomical Therapeutic Chemical (ATC) Classes for buprenorphine
Paragraph IV (Patent) Challenges for BUPRENORPHINE
| Tradename | Dosage | Ingredient | Strength | NDA | ANDAs Submitted | Submissiondate |
|---|---|---|---|---|---|---|
| BUTRANS | Transdermal System | buprenorphine | 15 mcg/hr | 021306 | 1 | 2013-12-16 |
| BUTRANS | Transdermal System | buprenorphine | 5 mcg/hr 10 mcg/hr 20 mcg/hr | 021306 | 1 | 2013-06-06 |
US Patents and Regulatory Information for buprenorphine
| Applicant | Tradename | Generic Name | Dosage | NDA | Approval Date | TE | Type | RLD | RS | Patent No. | Patent Expiration | Product | Substance | Delist Req. | Exclusivity Expiration |
|---|---|---|---|---|---|---|---|---|---|---|---|---|---|---|---|
| Bdsi | BUNAVAIL | buprenorphine hydrochloride; naloxone hydrochloride | FILM;BUCCAL | 205637-001 | Jun 6, 2014 | DISCN | Yes | No | ⤷ Start Trial | ⤷ Start Trial | Y | ⤷ Start Trial | |||
| Rhodes Pharms | BUPRENORPHINE HYDROCHLORIDE | buprenorphine hydrochloride | TABLET;SUBLINGUAL | 207276-002 | Mar 27, 2017 | AB | RX | No | No | ⤷ Start Trial | ⤷ Start Trial | ⤷ Start Trial | |||
| Difgen Pharms | BUPRENORPHINE | buprenorphine | FILM, EXTENDED RELEASE;TRANSDERMAL | 210272-002 | Sep 23, 2021 | AB | RX | No | No | ⤷ Start Trial | ⤷ Start Trial | ⤷ Start Trial | |||
| >Applicant | >Tradename | >Generic Name | >Dosage | >NDA | >Approval Date | >TE | >Type | >RLD | >RS | >Patent No. | >Patent Expiration | >Product | >Substance | >Delist Req. | >Exclusivity Expiration |
Expired US Patents for buprenorphine
| Applicant | Tradename | Generic Name | Dosage | NDA | Approval Date | Patent No. | Patent Expiration |
|---|---|---|---|---|---|---|---|
| Purdue Pharma Lp | BUTRANS | buprenorphine | FILM, EXTENDED RELEASE;TRANSDERMAL | 021306-005 | Jun 30, 2014 | ⤷ Start Trial | ⤷ Start Trial |
| Purdue Pharma Lp | BUTRANS | buprenorphine | FILM, EXTENDED RELEASE;TRANSDERMAL | 021306-005 | Jun 30, 2014 | ⤷ Start Trial | ⤷ Start Trial |
| Braeburn | BRIXADI | buprenorphine | SOLUTION, EXTENDED RELEASE;SUBCUTANEOUS | 210136-003 | May 23, 2023 | ⤷ Start Trial | ⤷ Start Trial |
| >Applicant | >Tradename | >Generic Name | >Dosage | >NDA | >Approval Date | >Patent No. | >Patent Expiration |
EU/EMA Drug Approvals for buprenorphine
| Company | Drugname | Inn | Product Number / Indication | Status | Generic | Biosimilar | Orphan | Marketing Authorisation | Marketing Refusal |
|---|---|---|---|---|---|---|---|---|---|
| L. Molteni & C. dei Fratelli Alitti Società di Esercizio S.p.A. | Sixmo | buprenorphine | EMEA/H/C/004743Sixmo is indicated for substitution treatment for opioid dependence in clinically stable adult patients who require no more than 8 mg/day of sublingual buprenorphine, within a framework of medical, social and psychological treatment. | Authorised | no | no | no | 2019-06-19 | |
| Camurus AB | Buvidal | buprenorphine | EMEA/H/C/004651Treatment of opioid dependence within a framework of medical, social and psychological treatment. Treatment is intended for use in adults and adolescents aged 16 years or over. | Authorised | no | no | no | 2018-11-20 | |
| >Company | >Drugname | >Inn | >Product Number / Indication | >Status | >Generic | >Biosimilar | >Orphan | >Marketing Authorisation | >Marketing Refusal |
International Patents for buprenorphine
| Country | Patent Number | Title | Estimated Expiration |
|---|---|---|---|
| Australia | 2011263478 | Injectable flowable composition comprising buprenorphine | ⤷ Start Trial |
| Brazil | 112012031290 | composição fluidificável injetável compreendendo buprenorfina | ⤷ Start Trial |
| Canada | 2801676 | COMPOSITIONS (COMPOSITIONS) | ⤷ Start Trial |
| >Country | >Patent Number | >Title | >Estimated Expiration |
Buprenorphine: Market Dynamics and Financial Trajectory
More… ↓
Make Better Decisions: Try a trial or see plans & pricing
Drugs may be covered by multiple patents or regulatory protections. All trademarks and applicant names are the property of their respective owners or licensors. Although great care is taken in the proper and correct provision of this service, thinkBiotech LLC does not accept any responsibility for possible consequences of errors or omissions in the provided data. The data presented herein is for information purposes only. There is no warranty that the data contained herein is error free. We do not provide individual investment advice. This service is not registered with any financial regulatory agency. The information we publish is educational only and based on our opinions plus our models. By using DrugPatentWatch you acknowledge that we do not provide personalized recommendations or advice. thinkBiotech performs no independent verification of facts as provided by public sources nor are attempts made to provide legal or investing advice. Any reliance on data provided herein is done solely at the discretion of the user. Users of this service are advised to seek professional advice and independent confirmation before considering acting on any of the provided information. thinkBiotech LLC reserves the right to amend, extend or withdraw any part or all of the offered service without notice.
ISSN: 2162-2639

Privacy and Cookies
Terms & Conditions
Site Map
DrugPatentWatch Alternatives
LOE / Major Patent Expirations 2026 - 2027
NCE-1 Patent Challenge Dates 2026 - 2027
Friedman, Yali. "DrugPatentWatch" DrugPatentWatch, thinkBiotech, 2026, www.DrugPatentWatch.com.
See Primary Research Papers Citing DrugPatentWatch