Last updated: April 27, 2026
What is the current commercial market structure for pravastatin sodium?
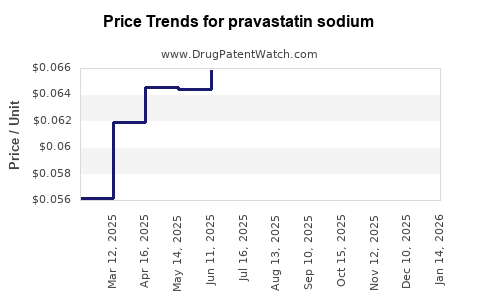
Pravastatin sodium is a first-generation statin with a long commercial history and a mature global market. The product’s economics are shaped by (1) patent expiries that shifted the market to generics, (2) persistent but slower unit growth versus newer statin competitors, and (3) ongoing price compression across US and major ex-US markets.
Core structural features of the market
- Mature, generic-dominated category: Statins as a class trade as routine chronic-care therapy, with payer preference and automatic substitution favoring low-cost options.
- Price-setting driven by formularies and rebates: In the US, net pricing depends on contracts with PBMs and managed-care formularies rather than wholesale list price.
- Clinical positioning is increasingly not differentiating: For cholesterol reduction, pravastatin competes primarily on cost, tolerability profile claims, and clinician familiarity rather than on unique mechanism-driven outcomes.
How does competition affect pricing and demand?
Pravastatin’s competitive set is dominated by other statins that generally have stronger market share on a global basis, particularly:
- Atorvastatin (major volume leader in many markets)
- Rosuvastatin
- Simvastatin (often cost-led where generic utilization is high)
Competitive dynamics that compress pravastatin margins
- Therapeutic interchangeability: All statins are HMG-CoA reductase inhibitors. That supports payer-driven switching and pharmacist substitution.
- Aggressive generic pricing: Multiple suppliers reduce prices toward low-cost equilibrium.
- Formulary tiering: If a plan places competitors on lower tiers or under preferred contracting, pravastatin volume declines or migrates to cash pay.
Where does pravastatin fit in formularies and payer behavior?
In managed-care systems, statins usually follow a stepped approach:
- Plans typically prefer a small formulary subset for LDL-C lowering.
- When a plan’s lowest-cost statin is available, utilization migrates to that option, especially for new starts.
Pravastatin maintains use in specific subpopulations where prescribers or plans consider it acceptable based on tolerability considerations, but overall volume typically tracks generic penetration and payer cost-minimization.
What does the financial trajectory look like across typical life-cycle stages?
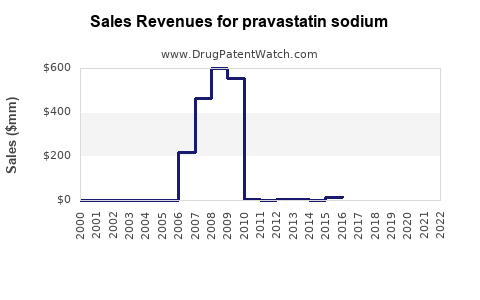
Pravastatin’s financial trajectory follows the classic pattern for early statins:
- Peak brand period (historical): Single-brand pricing supported higher margins.
- Post-patent decline: Price and revenue drop as generics enter.
- Long-tail stabilization: Revenue continues but at lower price points, with volume sustained by chronic indications and continued clinical adoption.
Implication for current financial trajectory
- Revenue is sustained by chronic use, not premium pricing.
- Profitability is driven by manufacturing scale, procurement cost, and contracting leverage.
- US and EU are typically margin-limited by generic competition and price controls.
How do regulatory and labeling realities shape commercialization economics?
Pravastatin is marketed in standard oral solid-dose formats across strengths that align with longstanding prescribing routines. Competitive positioning depends less on regulatory novelty and more on:
- Generic acceptance
- Bioequivalence and manufacturing robustness
- Supply continuity
- Contracting and distribution
Because pravastatin is well established, new entrants compete primarily on cost, supply assurance, and administrative simplicity (NDC availability, package size alignment, and payer paperwork).
What are the key market drivers supporting continued demand?
Even in a compressed price environment, pravastatin maintains demand because:
- Hypercholesterolemia is a chronic condition
- Statins are long-term therapy
- Clinicians continue to prescribe established agents
- Some patients remain stable on a given regimen, reducing forced switching
Demand is therefore “sticky” but price-elastic. That means unit volumes can hold up while dollar revenue trends downward as net pricing declines.
What are the key headwinds?
The biggest headwinds are category-wide and structural:
- Persistent price erosion across generics
- Switching to preferred low-cost statins on formularies
- Competition from more recently preferred statins depending on payer contracts
- Constrained margin pool because multiple generic manufacturers supply the market
How does geography change the financial picture?
The value chain differs by region:
- US: Heavily rebate and formulary driven; net price is often far below list price.
- EU and UK: In many countries, external reference pricing, tendering, and health-technology decision frameworks compress prices further.
- Emerging markets: Demand can remain higher on a unit basis, but gross margins depend on local reimbursement structures and import economics.
In all geographies, the overarching trend stays consistent: after brand loss, revenue sustains through volume, while profits track lowest-cost production and strongest contracting.
What product forms and strengths influence market access and volume?
Commercial availability in multiple strengths and generic package formats supports broad market coverage:
- Higher utilization generally follows strengths commonly prescribed in maintenance regimens.
- Smaller package sizes and frequent NDC offerings typically improve pharmacy-level access and substitution speed.
Market share is usually not won on clinical differentiation but on the ability to capture prescriptions at point-of-sale through supply and payer placement.
What does the patent and exclusivity reality imply for financial trajectory?
Pravastatin is no longer in a period where brand exclusivity materially protects pricing in major markets. That shifts financial outcomes to:
- Generic entry timing
- Number of competing suppliers
- Regulatory approvals that enable additional manufacturers
- Market consolidation among suppliers
Once multiple generics are available, price becomes a function of cost structure and contracting leverage, not product differentiation.
How do typical financial KPIs behave for mature generic statins?
For pravastatin in a mature market, investors and commercial teams typically watch:
- Net revenue trend: tied to unit volume and contracted net price
- Gross margin: tied to manufacturing cost and competitive price pressure
- Market share stability: influenced by formulary inclusion and switching behavior
- Working capital and supply performance: chronic therapy means steady demand, but shortages or quality issues can quickly shift utilization
Expected KPI pattern: gradual or stepwise net revenue contraction with relative market-share stability, followed by margin stabilization when supplier intensity falls or manufacturing advantages emerge.
Competitive benchmark: how pravastatin economics compare to other statins
Across statins, financial performance tends to diverge based on:
- Generic count and intensity in each SKU and geography
- Formulary placement
- Patient switching rates
- Contracting and PBM dynamics
Pravastatin generally sits lower in premium economics than atorvastatin or rosuvastatin where those agents maintain stronger market share and contracting advantages, but it still benefits from broad chronic-care utilization and established prescribing patterns.
What is the practical investment or R&D conclusion for this asset class?
For pravastatin sodium, the commercialization frontier is not clinical innovation in the statin mechanism. The center of gravity is:
- Supply-chain economics
- Regulatory execution for AB-rated generics
- Contracting execution with payers and wholesalers
- Quality and continuity of supply
Any new development strategy in this category typically targets formulation, dosing convenience, or combination opportunities rather than relying on IP-driven premium pricing.
Key Takeaways
- Pravastatin sodium is a mature statin with a generic-dominated market where net pricing and contracting determine economics more than clinical differentiation.
- Competitive pressure from other statins and multiple generic suppliers drives sustained price erosion and limits margin expansion.
- Demand is chronic and relatively stable in units, but revenue and profitability are highly price-elastic and trend downward after each competitive entry wave.
- Financial trajectory is best described as post-brand decline into long-tail stabilization, supported by formulary access and manufacturing scale.
FAQs
1) Is pravastatin sodium still a high-growth product?
No. Growth is limited by maturity, generic penetration, and payer-led switching to preferred low-cost statins.
2) What drives net revenue for pravastatin in the US?
PBM and payer contracts, formulary positioning, rebate structures, and generic substitution at the pharmacy level.
3) What are the main risks to profitability for pravastatin suppliers?
Price competition from additional generic entrants, loss of preferred formulary status, manufacturing cost disadvantages, and supply continuity issues.
4) Does pravastatin maintain demand despite generic competition?
Yes. Chronic hypercholesterolemia treatment creates unit-level stickiness, even when pricing compresses.
5) Where do opportunities typically exist in this market?
In operational execution: low-cost manufacturing, reliable supply, SKU availability, and contracting for preferred access.
References
[1] FDA. Drug Approval Reports and related product labeling database. https://www.accessdata.fda.gov/scripts/cder/daf/
[2] FDA. Orange Book: Approved Drug Products with Therapeutic Equivalence Evaluations. https://www.accessdata.fda.gov/scripts/cder/daf/index.cfm
[3] IQVIA. Medicines Use and Pricing in the US (historical industry reporting on pricing dynamics). https://www.iqvia.com/insights/the-iqvia-institute/reports/medicines-use-and-pricing-in-the-us
[4] GlobalData. Statins market and competitive dynamics reporting (industry market structure summaries). https://www.globaldata.com/