In 2023, Goldman Sachs put the ceiling on the global anti-obesity drug market at $100 billion by 2030 [1]. By late 2025, GLP-1 medicines alone were already generating $131.9 billion a year in U.S. drug spending [2], and J.P. Morgan’s research desk was projecting the broader incretin market to reach $200 billion annually by the same 2030 deadline [3]. A ceiling set two years earlier had already become a floor. That gap is not a footnote about one drug class. It is the clearest recent illustration of how far even well-resourced, model-driven forecasts can drift from what actually happens in the market, and why the mechanics behind those models deserve more scrutiny than most pharma organizations give them.
This guide breaks down what has changed in drug market potential forecasting since the standard playbook of unmet need, patient population, competitive landscape, risk-adjusted net present value (rNPV), and Monte Carlo simulation was written. It adds four things a generic forecasting primer usually leaves out: updated, source-cited probability-of-success data from 2025; a detailed accounting of the 2025-2030 patent cliff by drug and by company; the Inflation Reduction Act’s “pill penalty” as a structural input that changes rNPV math for small molecules; and two recent, fully sourced case studies — one of a forecast that undershot by tens of billions, and one of an FDA-approved drug that became a commercial failure for reasons no epidemiological model would have caught.
Where Recent Forecasts Missed, and Why
Before adopting any forecasting methodology, it helps to know its failure modes. Two 2020s-era cases show the opposite kinds of miss: one where the market outgrew the model, and one where the model captured the science but not the payer.
The GLP-1 Miss: When the Market Outgrew the Model
The original obesity-drug forecasts assumed a bounded, largely self-pay cash market for a once-weekly injectable. What actually happened was different in kind, not just in degree. Novo Nordisk’s semaglutide franchise (Ozempic, Wegovy, Rybelsus) generated $31.1 billion in 2024 revenue, up from $11.9 billion in 2022 [4]. Analysts at Evaluate Pharma now project Novo’s Ozempic and Wegovy plus Eli Lilly’s Mounjaro and Zepbound will each individually rank among the world’s ten best-selling medicines by 2030, with Lilly’s Mounjaro alone forecast to reach roughly $36 billion in that year [5]. Grand View Research puts the narrower GLP-1 weight-loss segment at $27.5 billion in 2026, growing to $48.8 billion by 2030 at an 18.5 percent compound annual growth rate [6], while J.P. Morgan’s broader incretin-market estimate (which includes diabetes indications) reaches $200 billion by 2030 [3].
Three inputs the early models underweighted explain most of the gap: expanding indications beyond diabetes and obesity into cardiovascular risk reduction, which broadened the addressable population beyond a single ICD-10 code; the arrival of oral formulations (Novo’s oral Wegovy pill and Lilly’s orforglipron, branded Foundayo) that unlock patients who decline injections, with Novo’s oral pill reportedly signing up more than 170,000 patients in its first three weeks on the U.S. market [7]; and a rapid escalation in employer and Medicaid coverage, with state Medicaid GLP-1 spending rising from $1 billion to $8.6 billion between 2019 and 2024, a 760 percent increase [8]. None of these three variables is exotic. All three are the kind of adoption-curve and access assumption that a Monte Carlo sensitivity analysis is specifically designed to stress-test — which is exactly why the miss is instructive: the tool existed, but the base-case assumptions fed into it were too conservative on formulation expansion and payer coverage simultaneously.
Aduhelm: A Forecast That Modeled the Science but Not the Payer
Biogen’s Aduhelm (aducanumab) shows the inverse failure. Peak sales projections reportedly reached as high as $9 billion annually before the drug’s 2021 accelerated approval for Alzheimer’s disease [9]. Actual results: third-quarter 2021 sales of $300,000, fourth-quarter sales of roughly $1 million against an early-projection benchmark of $10.79 million, and full-year 2022 U.S. revenue of $4.8 million [9][10]. Biogen discontinued the drug entirely in January 2024 [11].
The clinical data were genuinely contested — an FDA advisory committee had voted against approval before the agency granted it anyway on an accelerated pathway [12] — but the commercial collapse was not primarily a science story. In April 2022, the Centers for Medicare and Medicaid Services issued a National Coverage Determination restricting Medicare reimbursement for the entire anti-amyloid antibody class to patients enrolled in CMS-approved clinical studies, which effectively denied Medicare beneficiaries broad access to the drug [13]. Since Alzheimer’s disease is overwhelmingly a Medicare-age condition, this single payer decision eliminated most of the addressable market regardless of what any epidemiological patient-count model had projected. Eisai and Biogen’s follow-on drug Leqembi (lecanemab) received the same initial restriction under accelerated approval, saw it lifted after full approval in July 2023, and still posted only about $10 million in U.S. sales in 2023 [14] — evidence that even removing the payer obstacle does not automatically restore the forecast, because physician caution about a drug class linked to brain-swelling side effects and diagnostic infrastructure gaps (amyloid PET scans, infusion capacity) remained real adoption barriers.
The lesson for forecasters: a payer coverage decision is not a soft, qualitative afterthought to bolt onto a patient-population model. For any drug where a single payer (Medicare, a national health service, a dominant PBM) controls access for the bulk of the addressable population, that payer’s evidentiary bar needs its own explicit probability-weighted scenario in the model, separate from and multiplicative with clinical probability of success.
The R&D Probability Inputs Have Been Updated Since 2020
Most industry decks still cite the Biotechnology Innovation Organization’s 2011-2020 dataset, which put the overall likelihood of approval (LOA) from Phase I at 7.9 percent [15]. Two newer analyses refine that figure and are worth building into any current model.
The 2025 Nature Communications Update
A 2025 dynamic clinical-trial-success-rate study published in Nature Communications recalculated phase-transition probabilities using a larger, more recent dataset and found an overall Phase I-to-approval likelihood of 9.6 percent across roughly 9,985 development programs [16] — modestly higher than the BIO 2011-2020 figure, though still consistent with the same order of magnitude. A separate 2025 medRxiv analysis using calendar-period estimation for the 2017-2019 cohort found phase-by-phase transition rates of 47.2 percent (Phase I to II), 32.4 percent (Phase II to III), and 50.4 percent (Phase III to approval), compounding to a 7.7 percent overall probability of success [17]. A 2018-2022 cohort analysis of fourteen major pharmaceutical companies found a clinical success rate of 10.8 percent across all therapeutic areas [18]. Taken together, these more recent studies bracket a range of roughly 7.7 to 10.8 percent for overall Phase-I-to-approval probability, a tighter and slightly more favorable band than the widely cited 7.9 percent figure, but not different enough to change how a forecaster should size a discount for probability of success.
Data set
Period covered
Overall Phase I-to-approval LOA
Source
BIO / Pharma Intelligence / QLS Advisors
2011-2020
7.9%
go.bio.org [15]
Nature Communications dynamic success-rate study
Through 2025 publication
9.6%
Nature Communications, 2025 [16]
Calendar-period transition-probability study
2017-2019 cohort
7.7%
medRxiv, 2025 [17]
Fourteen major pharma companies, cross-therapeutic
2018-2022
10.8%
Alexandria research repository, unisg.ch [18]
What This Means for an rNPV Model
Because probability of success is the single most sensitivity-heavy input in a risk-adjusted valuation, the practical takeaway is not to anchor on one number but to run the rNPV and any accompanying Monte Carlo simulation across this full 7.7-to-10.8 percent range as a scenario band, rather than treating 7.9 percent as a fixed constant. For therapeutic-area-specific work, the older BIO breakdown by disease area remains the most granular public source: hematology programs cleared Phase I to approval at roughly 23.9 percent, versus 5.3 percent for oncology and single digits for urology and respiratory disease [15]. Until an equivalently granular therapeutic-area breakdown of the newer datasets is published, forecasters modeling a specific disease area should apply the newer aggregate correction factor (roughly a 0 to 3 percentage-point uplift relative to the 2011-2020 baseline) to the older area-specific figures rather than discarding the area-specific granularity entirely.
AI Has Changed One Input in the rNPV Equation, Not the Whole Model
The clearest, most citable data point on AI-driven drug discovery is no longer a market-size projection. It is a single peer-reviewed clinical result.
Rentosertib: The First Fully AI-Designed Drug With Phase 2a Data
On June 3, 2025, Insilico Medicine and collaborators published Phase IIa results for rentosertib (ISM001-055), a TNIK inhibitor for idiopathic pulmonary fibrosis, in Nature Medicine — described as the industry’s first peer-reviewed clinical proof-of-concept for a molecule whose target and structure were both generated by AI [19][20]. In the 71-patient GENESIS-IPF trial, the 60 mg once-daily dose group showed a mean forced vital capacity improvement of 98.4 mL over twelve weeks, against a mean decline of 20.3 mL in the placebo arm [19].
A comprehensive review published in Pharmacological Reviews found that AI-designed molecules show 80 to 90 percent success rates in Phase 1 trials, versus roughly 52 percent for historically developed compounds [21].
That Phase I gap is real and well-documented across several independent write-ups of the same underlying analysis [21][22]. What has not moved is Phase II. The same reporting notes that in Phase II, where the test shifts from safety to efficacy, AI-derived drugs succeed at roughly 40 percent, statistically in line with traditionally developed compounds [22][23]. For an rNPV model, this means AI-sourced candidates justify a higher conditional probability specifically for the Phase I-to-II transition — evidence supports treating this as closer to 80-90 percent rather than the roughly 47-52 percent historical average — but Phase II and Phase III probabilities should still be modeled at standard historical rates until a larger, disease-matched sample says otherwise. Insilico also reports that its AI-nominated preclinical candidates moved from project initiation to nomination in an average of 12 to 18 months, versus a typical 2.5 to 4 years, with a 100 percent success rate from candidate nomination to IND-enabling stage across 22 nominated candidates from 2021 to 2024 [24]. A faster, cheaper preclinical stage compresses the time-to-cash-flow term in an rNPV calculation and is a legitimate, separate input from the Phase I probability uplift; the two should not be conflated into a single blanket “AI discount rate” adjustment.
Patent Cliff 2.0: Sizing the 2025-2030 Loss-of-Exclusivity Wave
Every major intelligence house has published a figure for the 2025-2030 patent cliff, and the estimates cluster in a wide but bounded range depending on methodology, time horizon, and whether biosimilar as well as small-molecule generic exposure is included.
Source
Estimated revenue at risk
Window
Notes
Drug Discovery News / industry tracking
>$230 billion (U.S. only)
2025-2030
Cites Merck and Pfizer among the most exposed [25]
GeneOnline analysis
$236 billion (global)
2025-2030
~190 drugs, including 69 blockbusters [26]
DeepCeutix / industry synthesis
>$300 billion
2025-2030
Describes this as roughly triple the scale of the 2016 cliff, which eroded about $100 billion [27]
Longer-horizon estimates incorporating IRA dynamics
Up to $400 billion
2025-2033
Extends the window and includes Medicare-negotiation-driven exposure [28]
William Blair (as reported)
Aggregate sales fall from $162.8B to $67B
2023-2029
Nearly 50 products losing protection [29]
The spread exists because analysts disagree on three methodological choices: whether to count only U.S. exposure or global; whether to use a five-year (2025-2030) or eight-year (2025-2033) window; and whether to include revenue that Medicare price negotiation effectively removes before a patent formally expires. None of the estimates is wrong so much as differently scoped — a forecaster building a company-specific model should state which of these three choices they are making rather than importing a headline number without its denominator.
Which Companies Carry the Most Exposure
At the company level, the picture is more concrete than the aggregate figures suggest. Bristol Myers Squibb faces what one analysis describes as the steepest proportional cliff among large-cap peers, with Eliquis and Opdivo together accounting for roughly half of total earnings and a combined at-risk figure near $38 billion [30][31]. Merck is the most exposed in absolute revenue terms, with Keytruda’s core U.S. composition-of-matter patent expiring in 2028 against 2023-2024 revenue of $25 billion rising to $29.5 billion [32][33]. AstraZeneca has responded by setting a public 2030 revenue target of $80 billion specifically to signal that new-product revenue is intended to backfill cliff losses [27].
Drug (generic name)
Company
Approx. recent annual revenue
U.S. loss-of-exclusivity window
Keytruda (pembrolizumab)
Merck
~$29.5B (2024)
2028 (core patent)
Eliquis (apixaban)
BMS / Pfizer
Major share of BMS earnings
2026-2028 window (Medicare-negotiated price already in effect for 2026)
Stelara (ustekinumab)
J&J
~$10.8-10.9B
2025 (biosimilar entry underway)
Eylea (aflibercept)
Regeneron / Bayer
~$5.9-6B (U.S.)
2025-2026
Entresto (sacubitril/valsartan)
Novartis
~$7.8B
2025
Farxiga (dapagliflozin)
AstraZeneca
~$7.7B
2025
Ibrance (palbociclib)
Pfizer
~$5.0B
2027
Prolia/Xgeva (denosumab)
Amgen
~$6.5B combined
2025-2026
Figures are drawn from the sources cited in this table’s column notes [30][32][34][35][36] and are approximate; a forecaster relying on precise figures for deal or valuation work should confirm against the company’s most recent 10-K and Orange Book or Purple Book listing rather than any secondary aggregation, including this one.
Lifecycle Management as a Forecasting Variable: Reading the Defense in Real Time
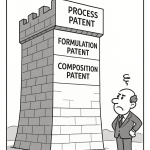
The original patent-thicket concept — building formulation, method-of-use, process, and polymorph patents around a core composition-of-matter patent — is well established. What is new is the degree to which lifecycle defenses are now visible, dated, and quantifiable in real time, which means they belong in the model as an explicit delay probability rather than a qualitative footnote.
Keytruda’s Subcutaneous Defense
Facing its 2028 core patent expiration, Merck secured FDA approval in 2025 for Keytruda Qlex, a subcutaneous formulation covering most of the 38 solid-tumor indications approved for the intravenous product [37]. The subcutaneous formulation carries its own, later-expiring patent estate, and Merck’s stated commercial strategy is to shift physicians and patients from the IV to the SC product ahead of the 2028 cliff so that a meaningful share of revenue sits on the newer patent family when generic and biosimilar competitors reach the intravenous version [38][39]. Merck has also signaled it will price the subcutaneous product competitively against anticipated biosimilar pricing rather than at a premium, explicitly to preserve volume [40]. Reported first-half 2025 Keytruda revenue of over $15 billion, up 8 percent year over year, shows the franchise still growing into the cliff rather than already declining [39] — evidence that a single “generic entry equals immediate 80-90 percent revenue collapse” assumption, valid for a single-molecule small-molecule drug, does not automatically transfer to a biologic with an active formulation-switching strategy and a wide indication base providing separate method-of-use protection.
Humira’s Seven-Year Delay, Revisited
AbbVie’s Humira remains the reference case for patent-thicket durability: a primary patent that expired in 2016 but a U.S. biosimilar market that did not open until 2023, seven years later, behind a portfolio widely reported at more than 70 secondary patents covering formulation, manufacturing, and use [41]. The forecasting lesson from Humira that is easy to miss is not the delay itself but what happened after entry: even with more than a dozen biosimilars competing by 2024, biosimilar substitution in the U.S. proceeded far more slowly than small-molecule generic substitution typically does, because payer formulary dynamics, pharmacy-benefit-manager rebate structures, and physician switching inertia all move at a different pace for an injectable biologic than for an oral small molecule. A biosimilar loss-of-exclusivity model should not reuse a small-molecule generic-erosion curve; it needs its own, slower erosion assumption calibrated to prior biosimilar launches (Humira, Neulasta, Herceptin) rather than to Lipitor-era small-molecule data.
Definitions Worth Anchoring in Any Model
A patent thicket is a dense, overlapping set of secondary patents — covering formulation, method of use, manufacturing process, or crystalline polymorph — filed around a core molecule patent to extend the practical cost and duration of a generic or biosimilar challenge well beyond the core patent’s expiration date. A formulation patent covers a specific delivery form, such as an extended-release tablet or a subcutaneous injection; a method-of-use patent covers a specific approved indication rather than the molecule itself, meaning a generic can sometimes launch for unprotected indications while remaining blocked from patent-protected ones (a “skinny label” scenario); NCE (new chemical entity) exclusivity is a five-year FDA regulatory exclusivity period, separate from any patent, during which no generic version of a new active ingredient may be approved, running from a fixed date (NCE-1) that generic filers track independently of the patent estate.
The IRA “Pill Penalty”: A Structural Variable No Model Should Skip in 2026
The Inflation Reduction Act’s Medicare Drug Price Negotiation Program is now a forecasting input with a specific, quantifiable effect on rNPV, and it did not exist when most standard forecasting frameworks were written.
How the Exemption Clock Actually Works
Under current law, a small-molecule drug becomes eligible for Medicare price negotiation nine years after FDA approval, with the negotiated price taking effect in year nine; a biologic is not eligible until eleven years after approval, with the negotiated price taking effect in year thirteen [42][43]. Because a small molecule’s negotiation-eligible date typically arrives three to four years before generic entry would otherwise erode its price, sponsors and investors must now discount anticipated small-molecule revenue for a negotiated-price event that occurs well before the traditional loss-of-exclusivity date used in legacy rNPV models [43]. Critically, the negotiation clock is calculated from the date of first approval of the active moiety, and expanded indications do not reset it: Farxiga (dapagliflozin), first approved for type 2 diabetes in 2014, became eligible based on that 2014 date even though it later received an expanded heart-failure indication in 2019 [44].
A Documented Real-World Effect on Pipeline Decisions
Eli Lilly’s chief executive has stated publicly that the company deprioritized three drug candidates as a direct result of this dynamic, and has specifically cited Jardiance (empagliflozin) — approved for diabetes in 2014 — as a drug whose 2010s-era expansion into a heart-failure indication might not have been pursued had the current small-molecule negotiation timeline applied at the time, since the negotiation clock would have started from the original 2014 approval and cut short the commercial runway available to fund the additional indication’s trial costs [45]. This is a rare, named, on-the-record example of a policy-driven rNPV input changing an actual go/no-go decision rather than a hypothetical one.
Where the Policy Stands as of Late 2026
An April 2025 executive order (Executive Order 14273) directed the Department of Health and Human Services to explore aligning the small-molecule and biologic exemption periods, but as of this writing no legislative fix — commonly referenced under bills such as the Ensuring Pathways to Innovative Cures (EPIC) Act — has been enacted [46][47]. A forecaster building a ten-year rNPV today should therefore model at least two explicit scenarios: the current nine-year small-molecule exemption holding through the projection period, and a policy-change scenario in which the exemption is extended toward the eleven-year biologic standard, weighting each by an explicitly stated subjective probability rather than picking one as a silent base case.
Rebuilding the rNPV and Monte Carlo Workflow With Current Inputs
The mechanics of risk-adjusted net present value have not changed: forecast unrisked cash flows, multiply each year’s cash flow by the cumulative probability of reaching that year, discount the risk-adjusted cash flows at a rate that reflects biotech-sector risk (commonly 10 to 15 percent), and sum. What should change in 2026 is which inputs feed that structure.
A Worked Example With Updated Inputs
Consider a hypothetical small-molecule oncology asset entering Phase II. Under the older BIO 2011-2020 oncology-specific data, the cumulative probability of Phase II success through approval was roughly 9.6 percent from Phase I, meaning a Phase-II-stage asset’s remaining probability of success is materially lower than the all-disease average [15]. Layer in three 2026-specific adjustments: first, if peak-year cash flows are projected past year nine post-launch, the model should apply a negotiated-price haircut consistent with the small-molecule IRA exemption clock rather than assuming full list-price revenue through generic entry; second, if the program shows any AI-assisted discovery lineage, the Phase I-to-II transition probability (not the full chain) can reasonably be shifted toward the 80-90 percent band documented for AI-designed molecules, while Phase II and III probabilities stay at historical oncology-specific rates; third, the projected patent-protected revenue tail should be modeled with an explicit distribution over possible secondary-patent-driven delay (for example, 0, 2, 4, or 6 additional years past the core patent, each with an assigned probability informed by the strength of the filed secondary patents) rather than a single fixed loss-of-exclusivity date.
Where Monte Carlo Earns Its Keep
Once these inputs are defined as ranges rather than points — a probability-of-success band, a small-molecule negotiation-timing scenario weight, and a secondary-patent delay distribution — a Monte Carlo simulation running the rNPV calculation across thousands of sampled combinations produces a defensible confidence interval (for example, a 90 percent probability the asset’s value falls between two bounds) rather than a single number that implies more precision than the underlying inputs support. The output is most useful not as a final valuation but as a sensitivity ranking: running the simulation reveals whether the asset’s value is most sensitive to clinical probability of success, to the negotiation-timing scenario weight, or to the secondary-patent delay distribution, which tells a management team exactly where to spend the next research dollar — on more clinical data, on IP strategy, or on policy engagement.
Turning Real-World Data Into a Forecasting Input, Not Just a Buzzword
Two applications of real-world data and natural language processing have moved from conceptual to operational since the standard forecasting literature was written, and both are concrete enough to specify rather than gesture at.
Claims-Based Patient Segmentation in Practice
A functioning real-world-data workflow for a cardiometabolic asset, for example, starts from a claims database such as MarketScan or a comparable commercial-claims source, identifies patients carrying an atherosclerotic cardiovascular disease diagnosis code together with a diabetes diagnosis code, filters that cohort by current statin prescription fills, and then further segments by the most recent recorded LDL-cholesterol lab value to isolate the specific subpopulation a new lipid-lowering therapy would actually be indicated for. Because claims data skew toward the commercially insured, working-age population, any resulting estimate needs a correction step — commonly a post-stratification adjustment against published national prevalence estimates from a source such as the CDC — before it is presented as a national patient-population figure.
NLP for Competitive Intelligence, Specifically
Natural language processing tools applied to patent filings, clinical trial registrations, and conference abstracts can extract a competitor’s stated trial endpoints, primary and secondary outcome measures, and enrollment criteria at a scale no analyst team can match manually, surfacing a shift in a rival’s registered endpoint (for example, a change in the primary endpoint of an ongoing trial) as an early signal of a data readout that missed its original target, months before any public announcement. This is a genuinely new capability, not a rebranded version of a manual literature review, and it belongs in the competitive-intelligence pillar of a forecast as a monitoring workflow with a defined update cadence, not a one-time input.
A Forecasting Checklist for the Patent-Cliff Decade
Pulling the preceding sections together, a defensible 2026-era drug market potential forecast should be able to answer each of the following before it is presented to a decision-maker: which of the three patent-cliff scope choices (U.S. or global, five-year or eight-year window, IRA-inclusive or not) the headline exposure number reflects; which probability-of-success dataset and range was used, and whether an AI-lineage adjustment was applied to the correct phase transition only; whether the asset’s projected revenue tail crosses the nine-year small-molecule or eleven-year biologic Medicare negotiation threshold, and if so, whether a negotiated-price scenario was modeled; whether the loss-of-exclusivity date used is the core composition-of-matter patent or reflects a documented secondary-patent delay distribution; and whether a single payer or reimbursement body controls access for the bulk of the target population, in which case that payer’s evidentiary and coverage-decision risk needs its own probability term, separate from and multiplicative with clinical probability of success.
Methodology Note
Figures in this article are drawn from the cited primary and secondary sources as of their publication dates; company-specific revenue and patent-expiration figures should be verified against current 10-K filings, the FDA’s Orange Book or Purple Book, and platforms such as DrugPatentWatch before use in a deal, licensing, or investment decision, since patent litigation outcomes, settlement terms, and regulatory exclusivity determinations change over time. Ranges reported for patent-cliff exposure and probability-of-success figures reflect genuine methodological disagreement across sources rather than a single settled number, and are presented as ranges rather than resolved into one figure. Nothing in this article constitutes investment, legal, or regulatory advice.
Key Takeaways
The GLP-1 market shows that even sophisticated forecasts can undershoot by tens of billions of dollars when they underweight formulation expansion (oral versus injectable), indication broadening beyond the original approval, and payer-coverage momentum happening simultaneously.
Aduhelm shows the opposite failure: a peak-sales projection near $9 billion collapsed to single-digit millions in annual revenue because a single payer’s coverage decision, not clinical data, controlled the addressable market.
Updated 2025 probability-of-success research (Nature Communications, medRxiv) puts overall Phase I-to-approval likelihood in a 7.7 to 10.8 percent range, modestly different from the widely cited 7.9 percent BIO 2011-2020 figure; forecasters should model across this range rather than anchoring on one number.
AI-designed drug candidates show a documented 80 to 90 percent Phase I success rate versus roughly 52 percent historically, but Phase II success rates remain at parity with traditional drug development; the AI adjustment belongs on the Phase I-to-II transition specifically, not on the full probability chain.
The 2025-2030 patent cliff is estimated at $230 billion to $400 billion in exposed revenue depending on scope and time horizon, with Merck (Keytruda, 2028) and Bristol Myers Squibb (Eliquis, Opdivo) carrying the largest documented exposure among major companies.
The IRA’s small-molecule Medicare negotiation exemption (nine years) versus the biologic exemption (eleven years) is now a documented input into real pipeline decisions, not a theoretical policy risk; Eli Lilly has publicly cited it as a factor in deprioritizing pipeline candidates.
Lifecycle management strategies such as Keytruda’s subcutaneous reformulation and Humira’s secondary-patent estate show that a single loss-of-exclusivity date materially understates a biologic’s effective revenue tail; model a delay distribution, not a single date.
FAQ
1. Why did GLP-1 obesity drug forecasts undershoot so significantly? Early 2023-era forecasts assumed a bounded injectable-only, largely cash-pay market. The actual market expanded through oral formulation launches, indication broadening into cardiovascular risk reduction, and a sharp rise in Medicaid and employer insurance coverage, three adoption-curve variables that compounded together rather than individually [3][6][8].
2. What probability-of-success figure should I use for an rNPV model in 2026? Rather than a single number, use the 7.7 to 10.8 percent range spanning the 2025 Nature Communications study, the 2025 medRxiv calendar-period analysis, and the 2018-2022 fourteen-company cross-therapeutic study, and run the valuation across that range as a scenario band [16][17][18].
3. Does using AI in drug discovery justify a lower risk discount across the whole development pathway? No. The documented evidence supports a higher probability specifically for the Phase I-to-Phase II transition (roughly 80-90 percent for AI-designed molecules versus roughly 52 percent historically). Phase II efficacy success rates for AI-derived candidates are currently at parity with traditionally developed drugs, so Phase II and III probabilities should remain at standard historical rates until larger, disease-matched samples show otherwise [21][22][23].
4. How does the IRA’s Medicare Drug Price Negotiation Program actually change a revenue forecast? It introduces a negotiated-price event at year nine post-approval for small molecules (year eleven for biologics), which for many drugs arrives years before the patent-driven loss-of-exclusivity date a legacy model would use. This negotiated-price event should be modeled as its own cash-flow discontinuity, separate from generic or biosimilar entry [42][43].
5. Do expanded indications reset the Medicare negotiation eligibility clock? No. Eligibility is based on the original approval date of the active moiety. Farxiga’s negotiation eligibility traces to its 2014 diabetes approval despite a later 2019 heart-failure indication expansion [44].
6. How much does a patent thicket actually delay generic or biosimilar entry? It varies by asset, but Humira’s case is the most heavily documented reference point: a core patent expiring in 2016 followed by no U.S. biosimilar entry until 2023, a seven-year gap attributed to a secondary-patent portfolio widely reported at more than 70 patents [41]. A forecaster should not assume this delay applies uniformly; it should be modeled as a probability-weighted range informed by the specific strength and number of an asset’s own secondary patents.
7. Should biosimilar revenue erosion be modeled the same way as small-molecule generic erosion? No. Small-molecule generic entry commonly cuts branded revenue by 80 to 90 percent within the first year. Biosimilar substitution for biologics such as Humira has proceeded more slowly in practice, due to formulary, rebate, and physician-switching dynamics specific to injectable biologics, so a biosimilar-specific erosion curve calibrated to prior biosimilar launches is more defensible than reusing small-molecule assumptions.
8. What is the single most commonly missed variable in market potential forecasts for drugs treating older or Medicare-heavy populations? Payer coverage risk, modeled as its own explicit probability term. Aduhelm’s collapse from a projected multi-billion-dollar peak to single-digit-million-dollar actual revenue was driven almost entirely by a Centers for Medicare and Medicaid Services national coverage determination, not by any change in the underlying epidemiological patient count [13].
9. How large is the 2025-2030 patent cliff, in one number? There is no single agreed number; credible published estimates range from roughly $230 billion (U.S.-only, five-year window) to $400 billion (global, extended to 2033 and incorporating IRA-related dynamics), and any figure cited should specify its scope and time horizon [25][26][27][28].
10. Which companies have the most documented revenue exposure to the current patent cliff? Merck carries the largest absolute exposure, centered on Keytruda’s 2028 core patent expiration against roughly $29.5 billion in 2024 revenue. Bristol Myers Squibb faces the steepest proportional exposure, with Eliquis and Opdivo together described as accounting for roughly half of total company earnings [30][32][33].
References
Goldman Sachs Research, obesity drug market projection, as cited in Beckers Hospital Review, “3 big shifts for the GLP-1 market.”
Beckers Hospital Review. “3 Big Shifts for the GLP-1 Market.” https://www.beckershospitalreview.com/glp-1s/3-big-shifts-for-the-glp-1-market/
J.P. Morgan Global Research. “How Supply and Demand for Weight Loss Drugs Is Playing Out in 2026.” https://www.jpmorgan.com/insights/global-research/current-events/obesity-drugs
FiercePharma. “Diabetes and Obesity Boom Will Propel Lilly, Novo to Front of Pharma Sales Pack by 2030: Evaluate.” https://www.fiercepharma.com/pharma/2030-eli-lilly-will-generate-113b-drug-sales-including-62b-mounjaro-zepbound-evaluate
Grand View Research. “GLP-1 Agonists Weight Loss Drugs Market Report, 2025-2030.” https://www.grandviewresearch.com/industry-analysis/glp-1-agonists-weight-loss-drugs-market-report
Beckers Hospital Review. “3 Big Shifts for the GLP-1 Market” (oral Wegovy launch data).
BioSpace. “Biogen Abandons Aduhelm Study Following Low Patient Enrollment.” https://www.biospace.com/article/biogen-abandons-real-world-study-of-alzheimer-s-drug-aduhelm/
Pharmacy Times / PharmExec. “Biogen Pulls Plug on Controversial Alzheimer Disease Drug Aduhelm.” https://www.pharmexec.com/view/biogen-pulls-plug-on-controversial-alzheimer-disease-drug-aduhelm
Drug Discovery and Development. “A Timeline of Aduhelm’s Rise and Fall.” https://www.drugdiscoverytrends.com/a-timeline-of-aduhelms-rise-and-fall/
Pharmaphorum. “Aduhelm and an Expensive Failure to Launch.” https://pharmaphorum.com/market-access/aduhelm-and-expensive-failure-launch
Pharmaceutical Technology. “Biogen Discontinues Aduhelm” (Leqembi 2023 U.S. sales figure).
Biotechnology Innovation Organization, Pharma Intelligence, and QLS Advisors. “Clinical Development Success Rates and Contributing Factors, 2011-2020.” https://go.bio.org/rs/490-EHZ-999/images/ClinicalDevelopmentSuccessRates2011_2020.pdf
Nature Communications. “Dynamic Clinical Trial Success Rates for Drugs in the 21st Century,” 2025.
medRxiv. “Calendar Period Estimation of Probabilities of Transition in Drug Development,” 2025.
University of St. Gallen Alexandria repository. Analysis of R&D productivity across fourteen major pharmaceutical companies, 2018-2022. https://www.alexandria.unisg.ch/server/api/core/bitstreams/1869410b-3d44-4d2d-9127-89da153d1c0f/content
Insilico Medicine. “Insilico Announces Nature Medicine Publication of Rentosertib Phase IIa Results.” https://insilico.com/news/tnrecuxsc1-insilico-announces-nature-medicine
Drug Discovery Trends. “Insilico’s AI-Designed Rentosertib Shows Promise in First Phase 2a Trial Results.” https://www.drugdiscoverytrends.com/insilicos-ai-designed-rentosertib-shows-promise-in-first-phase-2a-trial-results/
Live in the Future. “The First Drug Designed Entirely by AI Just Improved Lung Function in Humans.” https://liveinthefuture.org/stories/ai-drug-discovery-first-clinical-proof
Policy Circle. “AI-Generated Drug Reaches Human Trial Milestone.” https://www.policycircle.org/opinion/ai-generated-drug-trial/
Code Blue / Galen Centre. “Is AI Hype in Drug Development About to Turn Into Reality?” https://codeblue.galencentre.org/2025/09/is-ai-hype-in-drug-development-about-to-turn-into-reality/
ISPE Boston. Insilico Medicine preclinical candidate nomination timeline and success-rate data. https://www.ispeboston.org/?p=24620606
Drug Discovery News. “Blockbuster Drugs Face a Massive Patent Cliff in 2026.” https://www.drugdiscoverynews.com/blockbuster-drugs-face-a-massive-patent-cliff-in-2026-17019
GeneOnline, as cited in Life Science Daily, “Biologics on the Brink: The Patent Cliff Facing Big Pharma.” https://lifesciencedaily.news/biologics-on-the-brink-the-patent-cliff-facing-big-pharma/
DeepCeutix. “$300 Billion in Pharma Revenue Loses Patent Protection by 2030.” https://deepceutix.com/insights/patent-cliff-reformulation
DrugPatentWatch. “Kill the Patent Cliff: How to Turn a $400 Billion Revenue Loss Into a Competitive Edge.” https://www.drugpatentwatch.com/blog/kill-the-patent-cliff-how-to-turn-a-400-billion-revenue-loss-into-a-competitive-edge/
DrugPatentWatch. “The Patent Cliff Panic: A Pain Point Every Pharma Investor Faces” (citing William Blair report). https://www.drugpatentwatch.com/blog/the-patent-cliff-panic-a-pain-point-every-pharma-investor-faces/
DrugPatentWatch. “Pharma Doesn’t Buy on Features. They Buy on Fear of LOE.” https://www.drugpatentwatch.com/blog/pharma-doesnt-buy-on-features-they-buy-on-fear-of-loe-sell-more-drugs-by-knowing-when-they-die/
DrugPatentWatch. “The $236 Billion Cliff: How Pharma Loses Its Blockbusters.” https://www.drugpatentwatch.com/blog/as-blockbuster-drugs-fizzle-biotech-looks-warily-to-the-next-big-thing/
Pharmaceutical Technology. “Humira by AbbVie: The Highs and Lows of the World’s Most [Successful Drug].” https://www.pharmaceutical-technology.com/features/humira-abbvie-drug/
Brownstein. “Reflections on the Inflation Reduction Act’s Pill Penalty.” https://www.bhfs.com/insight/reflections-on-the-inflation-reduction-act-s-pill-penalty/
Charles River Associates. “Evaluating Unintended Impacts of the IRA’s Medicare Drug Price Negotiation Program on Small and Large Molecule Medicines.” https://www.crai.com/engagements/evaluating-unintended-impacts-of-the-iras-medicare-price-negotiation-program-on-small-and-large-molecule-medicines/
Milliman. “Medicare Price Negotiation: A Paradigm Shift in Part D Access and Cost” (Farxiga example). https://milliman.com/en/insight/medicare-price-negotiation-paradigm-shiftpart-d-access-cost
Evaluate. “World Preview 2023: Pharma’s Age of Uncertainty” (Eli Lilly CEO comments on Jardiance and pipeline deprioritization). https://evaluate.turtl.co/story/world-preview-2023-pharmas-age-of-uncertainty-prospect/page/4
Inizio. “Evaluation of Drug Price Executive Order: Potential Implications.” https://inizio.com/insights/evaluation-of-drug-price-executive-order-potential-implications-lowering-drug-prices-by-once-again-putting-americans-first/
Pharmacy Times. “The Inflation Reduction Act and Oncology Drug Pricing: What Pharmacists Need to Know,” August 11, 2026. https://www.pharmacytimes.com/view/the-inflation-reduction-act-and-oncology-drug-pricing-what-pharmacists-need-to-know