The Hatch-Waxman Roadmap: How ANDA Filings and Patent Challenges Really Work
The Drug Price Competition and Patent Term Restoration Act of 1984, universally called Hatch-Waxman, created the legal architecture that now […]
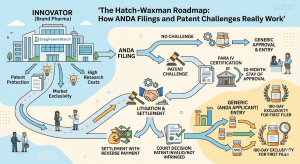
The Hatch-Waxman Roadmap: How ANDA Filings and Patent Challenges Really Work Read Post »