ELIQUIS Drug Patent Profile
✉ Email this page to a colleague
Which patents cover Eliquis, and when can generic versions of Eliquis launch?
Eliquis is a drug marketed by Bristol Myers Squibb and Bristol and is included in two NDAs. There are three patents protecting this drug and one Paragraph IV challenge.
This drug has one hundred and seventy-five patent family members in forty-two countries.
The generic ingredient in ELIQUIS is apixaban. There are thirty drug master file entries for this compound. Nine suppliers are listed for this compound. Additional details are available on the apixaban profile page.
DrugPatentWatch® Litigation and Generic Entry Outlook for Eliquis
A generic version of ELIQUIS was approved as apixaban by ACCORD HLTHCARE on July 28th, 2020.
AI Deep Research
Questions you can ask:
- What is the 5 year forecast for ELIQUIS?
- What are the global sales for ELIQUIS?
- What is Average Wholesale Price for ELIQUIS?
Summary for ELIQUIS
| International Patents: | 175 |
| US Patents: | 2 |
| Applicants: | 2 |
| NDAs: | 2 |
| Finished Product Suppliers / Packagers: | 6 |
| Raw Ingredient (Bulk) Api Vendors: | 101 |
| Clinical Trials: | 77 |
| Patent Applications: | 3,968 |
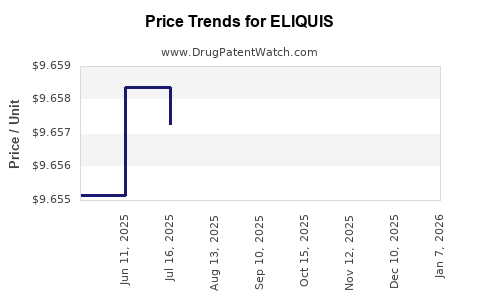
| Drug Prices: | Drug price information for ELIQUIS |
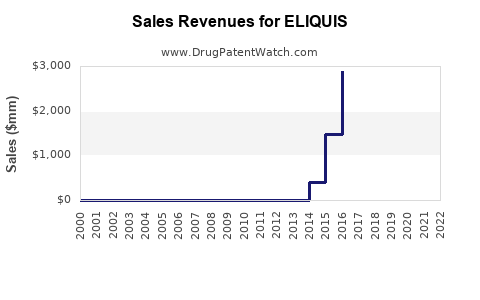
| Drug Sales Revenues: | Drug sales revenues for ELIQUIS |
| Patent Litigation and PTAB cases: | See patent lawsuits and PTAB cases for ELIQUIS |
| What excipients (inactive ingredients) are in ELIQUIS? | ELIQUIS excipients list |
| DailyMed Link: | ELIQUIS at DailyMed |

Recent Clinical Trials for ELIQUIS
Identify potential brand extensions & 505(b)(2) entrants
| Sponsor | Phase |
|---|---|
| University of Vermont | PHASE3 |
| U.S. Food and Drug Administration (FDA) | PHASE4 |
| VA Office of Research and Development | PHASE4 |
Pharmacology for ELIQUIS
| Drug Class | Factor Xa Inhibitor |
| Mechanism of Action | Factor Xa Inhibitors |
US Patents and Regulatory Information for ELIQUIS
ELIQUIS is protected by two US patents and three FDA Regulatory Exclusivities.
| Applicant | Tradename | Generic Name | Dosage | NDA | Approval Date | TE | Type | RLD | RS | Patent No. | Patent Expiration | Product | Substance | Delist Req. | Exclusivity Expiration |
|---|---|---|---|---|---|---|---|---|---|---|---|---|---|---|---|
| Bristol Myers Squibb | ELIQUIS | apixaban | TABLET, FOR SUSPENSION;ORAL | 202155-003 | Apr 17, 2025 | RX | Yes | Yes | 6,967,208*PED | ⤷ Start Trial | Y | ⤷ Start Trial | |||
| Bristol Myers Squibb | ELIQUIS | apixaban | TABLET;ORAL | 202155-001 | Dec 28, 2012 | AB | RX | Yes | No | ⤷ Start Trial | ⤷ Start Trial | ⤷ Start Trial | |||
| Bristol Myers Squibb | ELIQUIS | apixaban | TABLET, FOR SUSPENSION;ORAL | 202155-003 | Apr 17, 2025 | RX | Yes | Yes | ⤷ Start Trial | ⤷ Start Trial | ⤷ Start Trial | ||||
| Bristol Myers Squibb | ELIQUIS | apixaban | TABLET;ORAL | 202155-002 | Dec 28, 2012 | AB | RX | Yes | Yes | ⤷ Start Trial | ⤷ Start Trial | ⤷ Start Trial | |||
| Bristol Myers Squibb | ELIQUIS | apixaban | TABLET;ORAL | 202155-001 | Dec 28, 2012 | AB | RX | Yes | No | ⤷ Start Trial | ⤷ Start Trial | ⤷ Start Trial | |||
| >Applicant | >Tradename | >Generic Name | >Dosage | >NDA | >Approval Date | >TE | >Type | >RLD | >RS | >Patent No. | >Patent Expiration | >Product | >Substance | >Delist Req. | >Exclusivity Expiration |
Expired US Patents for ELIQUIS
| Applicant | Tradename | Generic Name | Dosage | NDA | Approval Date | Patent No. | Patent Expiration |
|---|---|---|---|---|---|---|---|
| Bristol Myers Squibb | ELIQUIS | apixaban | TABLET;ORAL | 202155-001 | Dec 28, 2012 | 6,413,980 | ⤷ Start Trial |
| Bristol Myers Squibb | ELIQUIS | apixaban | TABLET;ORAL | 202155-002 | Dec 28, 2012 | 6,413,980 | ⤷ Start Trial |
| >Applicant | >Tradename | >Generic Name | >Dosage | >NDA | >Approval Date | >Patent No. | >Patent Expiration |
EU/EMA Drug Approvals for ELIQUIS
| Company | Drugname | Inn | Product Number / Indication | Status | Generic | Biosimilar | Orphan | Marketing Authorisation | Marketing Refusal |
|---|---|---|---|---|---|---|---|---|---|
| Bristol-Myers Squibb / Pfizer EEIG | Eliquis | apixaban | EMEA/H/C/002148For Eliquis 2.5 mg film-coated tablets:Prevention of venous thromboembolic events (VTE) in adult patients who have undergone elective hip or knee replacement surgery.Prevention of stroke and systemic embolism in adult patients with non-valvular atrial fibrillation (NVAF), with one or more risk factors, such as prior stroke or transient ischaemic attack (TIA); age ≥ 75 years; hypertension; diabetes mellitus; symptomatic heart failure (NYHA Class ≥ II).Treatment of deep vein thrombosis (DVT) and pulmonary embolism (PE), and prevention of recurrent DVT and PE in adults (see section 4.4 for haemodynamically unstable PE patients).For Eliquis 5 mg film-coated tablets:Prevention of stroke and systemic embolism in adult patients with non-valvular atrial fibrillation (NVAF), with one or more risk factors, such as prior stroke or transient ischaemic attack (TIA); age≥ 75 years; hypertension; diabetes mellitus; symptomatic heart failure (NYHA Class ≥ II).Treatment of deep vein thrombosis (DVT) and pulmonary embolism (PE), and prevention of recurrent DVT and PE in adults (see section 4.4 for haemodynamically unstable PE patients). | Authorised | no | no | no | 2011-05-18 | |
| Accord Healthcare S.L.U. | Apixaban Accord | apixaban | EMEA/H/C/005358Prevention of venous thromboembolic events (VTE) in adult patients who have undergone elective hip or knee replacement surgery.Prevention of stroke and systemic embolism in adult patients with non-valvular atrial fibrillation (NVAF), with one or more risk factors, such as prior stroke or transient ischaemic attack (TIA); age ≥ 75 years; hypertension; diabetes mellitus; symptomatic heart failure (NYHA Class ≥ II).Treatment of deep vein thrombosis (DVT) and pulmonary embolism (PE), and prevention of recurrent DVT and PE in adults (see section 4.4 for haemodynamically unstable PE patients).Prevention of stroke and systemic embolism in adult patients with non-valvular atrial fibrillation (NVAF), with one or more risk factors, such as prior stroke or transient ischaemic attack (TIA); age≥ 75 years; hypertension; diabetes mellitus; symptomatic heart failure (NYHA Class ≥ II).Treatment of deep vein thrombosis (DVT) and pulmonary embolism (PE), and prevention of recurrent DVT and PE in adults (see section 4.4 for haemodynamically unstable PE patients). | Authorised | yes | no | no | 2020-07-23 | |
| >Company | >Drugname | >Inn | >Product Number / Indication | >Status | >Generic | >Biosimilar | >Orphan | >Marketing Authorisation | >Marketing Refusal |
International Patents for ELIQUIS
See the table below for patents covering ELIQUIS around the world.
| Country | Patent Number | Title | Estimated Expiration |
|---|---|---|---|
| Argentina | 024242 | COMPUESTO HETEROBICICLO CON CONTENIDO DE NITROGENO, COMPOSICION FARMACEUTICA QUE LO COMPRENDE , Y EL USO DE DICHOS COMPUESTOS EN LA FABRICACIoN DE UN MEDICAMENTO. | ⤷ Start Trial |
| Austria | 280171 | ⤷ Start Trial | |
| Australia | 2371700 | ⤷ Start Trial | |
| Australia | 759711 | ⤷ Start Trial | |
| Brazil | 9917080 | ⤷ Start Trial | |
| >Country | >Patent Number | >Title | >Estimated Expiration |
Supplementary Protection Certificates for ELIQUIS
| Patent Number | Supplementary Protection Certificate | SPC Country | SPC Expiration | SPC Description |
|---|---|---|---|---|
| 1427415 | C300500 | Netherlands | ⤷ Start Trial | PRODUCT NAME: APIXABAN DESGEWENST IN DE VORM VAN EEN FARMACEUTISCH AANVAARDBAAR ZOUT; REGISTRATION NO/DATE: EU/1/11/691/001-005 20110518 |
| 1427415 | C20110017 00045 | Estonia | ⤷ Start Trial | PRODUCT NAME: ELIQUIS - APIKSABAAN; REG NO/DATE: C(2011)3595 18.05.2011 |
| 1427415 | CA 2011 00028 | Denmark | ⤷ Start Trial | |
| 1427415 | 91888 | Luxembourg | ⤷ Start Trial | 91888, EXPIRES: 20260518 |
| 1427415 | 1190029-7 | Sweden | ⤷ Start Trial | PRODUCT NAME: APIXABAN OCH FARMACEUTISKT ACCEPTABLA SALTER DAERAV; REG. NO/DATE: EU/1/11/691/001-005 20110518 |
| >Patent Number | >Supplementary Protection Certificate | >SPC Country | >SPC Expiration | >SPC Description |
More… ↓
Make Better Decisions: Try a trial or see plans & pricing
Drugs may be covered by multiple patents or regulatory protections. All trademarks and applicant names are the property of their respective owners or licensors. Although great care is taken in the proper and correct provision of this service, thinkBiotech LLC does not accept any responsibility for possible consequences of errors or omissions in the provided data. The data presented herein is for information purposes only. There is no warranty that the data contained herein is error free. We do not provide individual investment advice. This service is not registered with any financial regulatory agency. The information we publish is educational only and based on our opinions plus our models. By using DrugPatentWatch you acknowledge that we do not provide personalized recommendations or advice. thinkBiotech performs no independent verification of facts as provided by public sources nor are attempts made to provide legal or investing advice. Any reliance on data provided herein is done solely at the discretion of the user. Users of this service are advised to seek professional advice and independent confirmation before considering acting on any of the provided information. thinkBiotech LLC reserves the right to amend, extend or withdraw any part or all of the offered service without notice.
ISSN: 2162-2639

Privacy and Cookies
Terms & Conditions
Site Map
DrugPatentWatch Alternatives
LOE / Major Patent Expirations 2026 - 2027
NCE-1 Patent Challenge Dates 2026 - 2027
Friedman, Yali. "DrugPatentWatch" DrugPatentWatch, thinkBiotech, 2026, www.DrugPatentWatch.com.
See Primary Research Papers Citing DrugPatentWatch