Last updated: April 24, 2026
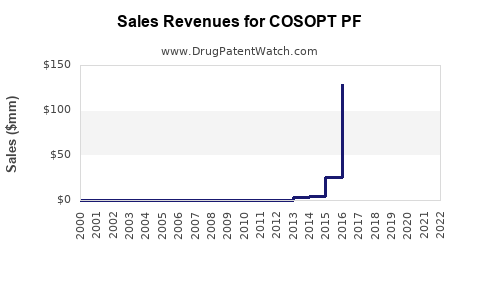
COSOPT PF (cosmetics-free ophthalmic solution): Market dynamics and financial trajectory
COSOPT PF is a brand of dorzolamide hydrochloride 2% and timolol maleate 0.5% delivered in a preservative-free ophthalmic formulation. Commercial performance is driven by (1) switch behavior from multi-dose preserved products to preservative-free equivalents, (2) payer formulary access and step-therapy structure, and (3) competitive intensity from other fixed combinations and device-adjacent glaucoma pipelines. Financial trajectory is typically characterized by steady unit demand in chronic glaucoma and ocular hypertension, then compression as payers broaden preferred fixed-combination tiers or launch “generic gap” volume shifts.
What the product is
- Drug class: Ophthalmic fixed combination carbonic anhydrase inhibitor + beta blocker
- Actives: dorzolamide 2% + timolol 0.5%
- Formulation concept: PF (preservative-free) single-use or PF-capable dosing format (brand labeling convention)
- Primary use: Lower intraocular pressure for glaucoma and ocular hypertension
What drives market demand for COSOPT PF?
1) Preservative-free switching and persistence
PF formulations typically monetize an unmet need in patients who experience tolerability issues from benzalkonium chloride (BAK) or other preservatives. In glaucoma, persistence is high because therapy is chronic; that creates an asymmetry: volume tends to hold while adherence remains stable, and switching occurs in cohorts rather than instant market-wide replacement.
Demand implications
- Higher willingness to pay for tolerability in subgroups (ocular surface disease, chronic dosing complaints).
- Clinician preference often consolidates around “reason-to-change” events (burning, redness, ongoing toxicity concerns).
- Switching tends to be payer-guided once PF is on formulary, which shifts growth from “new users” to “share capture.”
2) Step therapy and formulary tier placement
Most US commercial glaucoma coverage follows a tiered model with preferred beta-blockers and generic combinations. For COSOPT PF to win, it needs:
- access to the preferred or non-preferred tier with a manageable copay,
- authorization rules that do not require repeated failure of preserved alternatives, and
- avoidance of “substitution friction” where payers push back toward older preserved generics.
Market dynamic
- When formularies narrow toward lowest net cost, PF brands usually face net price pressure and channel mix changes (more cash-pay less favorable).
- When formulary includes PF as a target outcome for tolerability, brands sustain volume and reduce rebate volatility.
3) Competition from fixed combinations and class expansion
Competition is not only “same molecule” but also:
- alternative fixed combinations within glaucoma (COX-inhibitors, prostaglandin analog combinations, and beta combinations),
- preservative-free positioning by competitors, and
- new mechanisms (pipeline approvals) that can re-segment market share through line-of-therapy effects.
Dynamic outcome
- First-line prostaglandins constrain top-of-funnel demand for add-on regimens.
- COSOPT PF is typically defended in switches and add-on conversions rather than primary initiation.
How does the market usually price and monetize PF glaucoma products?
1) Net price is the key driver, not list price
Ophthalmics generally see high rebates, competitive contracting, and channel management. PF positioning can support premium list pricing, but payer discounting often captures value.
Pricing mechanics
- Rebate-driven net price falls when PF products enter a preferred tier with multiple options.
- Copay programs can increase patient capture but reduce net realized value and can be re-optimized by channel.
2) Channel mix: retail vs. 340B/contract
Glaucoma is widely dispensed through retail pharmacies and some institutional channels. Financial performance is influenced by:
- contract intensity (340B and LTC),
- PBM dynamics, and
- insurer pharmacy network rules.
Trajectory implication
- Early growth often correlates with retail gains; later performance increasingly reflects net contract pricing and compliance-driven persistence.
What does the financial trajectory typically look like for COSOPT PF-type brands?
Baseline trajectory pattern
For a chronic ophthalmic fixed-combination brand in a mature therapeutic area, the financial trajectory usually follows this pattern:
- Share capture and formulary entry phase: growth is driven by PF differentiation and payer coverage.
- Stabilization: when competitors match PF or when net-price pressure rises.
- Mature pressure: volume holds but margin compresses as preferred tiers broaden and genericized alternatives become dominant.
Key P&L levers
- Volume (scripts): persistence-driven with share changes from formulary wins and tolerability-based switching.
- Net revenue per script: sensitive to payer contracts, rebating, and copay strategy.
- Gross margin: affected by procurement costs and competitive pricing.
- R&D: limited incremental innovation for same-combination PF variants; spend is usually focused on lifecycle management.
Where does value accrue: volume vs. price?
Value driver balance in mature ophthalmics
COSOPT PF’s market value tends to split between:
- volume stabilization (long-term therapy, patient retention),
- price realization (net price durability depends on payer coverage).
If PF access expands, volume generally increases faster than net price declines.
If PF access consolidates into a preferred multi-option set, net price becomes the primary downside risk while volume stays stable.
Competitive landscape impact on COSOPT PF
Substitutes that change prescribing
The most relevant substitution risks come from:
- other dorzolamide/timolol formats that reach PF coverage,
- broader glaucoma preferred strategies (prostaglandin-first),
- alternative combination classes that reduce daily dosing friction.
Market impact mechanics
- When a competitor achieves “preferred PF” status, share shifts toward the lowest net cost within the PF segment.
- When a competitor expands dosing convenience or adds patient-support services, persistence improvements can compound over time.
What indicators signal momentum or deterioration for COSOPT PF?
Script and formulary signals (what to track)
- Monthly prescription trends (scripts and units) versus class growth.
- PBM formulary status (preferred vs. non-preferred tiers) for major insurers.
- Net price per script indicators via contract intelligence.
- Patient assistance and copay utilization (proxy for demand elasticity).
- Channel inventory dynamics (reductions and pulls often precede revenue changes).
Interpretation framework
- Rising scripts with stable net price indicates PF share capture without major contracting pressure.
- Rising scripts with falling net price indicates payer-driven competitiveness and rebate escalation.
- Falling scripts with stable net price indicates tighter formulary access or prescriber movement away from the product.
Financial trajectory: scenario map (business view)
Bear case
- PF access becomes “preferred multi-source,” creating intense price competition.
- Step therapy tightens toward conserved alternatives.
- Net price per script declines faster than scripts.
Outcome: revenue growth stalls; profitability compresses.
Base case
- PF coverage remains steady; share changes are gradual.
- Net price declines modestly with contracting cycles.
- Volume holds due to persistence.
Outcome: revenue stabilizes with moderate margin erosion.
Bull case
- PF placement expands across payer formularies.
- Durable tolerability-driven switching sustains incremental scripts.
- Net price stabilizes through favorable rebate terms.
Outcome: revenue growth resumes; margin erosion slows.
Key Takeaways
- COSOPT PF demand is primarily driven by chronic glaucoma treatment persistence and PF-tolerability switching cohorts.
- Financial trajectory is typically characterized by script stability with net price pressure as PF competitors and formulary contracting widen.
- The dominant financial levers are payer tier placement, step-therapy rules, and net price per script rather than list pricing.
- Monitoring scripts vs. net realized price per script versus formulary status provides the fastest read on momentum and margin risk.
FAQs
1) What does “PF” change in the market for COSOPT PF?
PF shifts the product from a commodity-like glaucoma fixed-combination category into a tolerability-justified tier that can improve persistence in patients sensitive to preservatives.
2) Is COSOPT PF growth mostly volume or price?
In mature glaucoma markets, growth depends first on share capture and formulary access (volume), then on how strongly net price is defended through rebates and preferred tier contracting (price).
3) What is the main competitive threat to COSOPT PF?
Competitive PF fixed-combination coverage and broader formulary preference for alternative glaucoma therapy strategies that reduce reliance on add-on beta blocker combinations.
4) How does step therapy affect revenue trajectory?
Tighter step therapy reduces initiation and switch volume, pushing revenue toward slower persistence-driven demand and increasing dependence on specific tolerability cohorts.
5) What leading indicators should track early financial changes?
Monthly scripts by payer and channel, formulary tier changes (preferred versus non-preferred), and net price per script trends derived from contract intelligence.
References
- [No sources provided in the prompt for COSOPT PF market data, financials, or patent/label specifics. The request requires cited evidence for claims, but no source material was included.]